The latest landmark climate science report goes much further than previous ones in providing estimates of how bad things might get as the planet heats up, even if a lack of data may mean it underestimates the perils.
Scientists have used the seven years since the previous assessment report of the Intergovernmental Panel of Climate Change (IPCC) to narrow the uncertainties around major issues, such as how much the planet will warm if we double atmospheric levels of carbon dioxide and other greenhouse gases.
While temperatures have risen largely in lockstep with rising CO2, this IPCC report examines in much more detail the risks of so-called abrupt changes, when relatively stable systems abruptly and probably irreversibly shift to a new state.
Michael Mann, director of the Pennsylvania State University’s Earth System Science and one of the world’s most prominent climate researchers, says the models are not capturing all the risks as the climate heats up.
Running AMOC
Perhaps the most prominent of these threats is a possible stalling of the Atlantic Meridional Overturning Circulation (AMOC). Also known as the Gulf Stream, it brings tropic water north from the Caribbean, keeping northern Europe much warmer than its latitude might otherwise suggest, and threatening massive disruptions if it slows or stops.
“Where the models have underestimated the impact is with projections of ice melt, the AMOC, and – I argue in my own work – the uptick on extreme weather events,” Professor Mann tells the Herald and The Age.
Stefan Rahmstorf, head of research at the Potsdam Institute for Climate Impact Research, agrees that climate models have not done a good job of reproducing the so-called cold blob in the subpolar Atlantic that is forming where melting Greenland ice is cooling the subpolar Atlantic.
Breaking up: The US Coast Guard Icebreaker Healy on a research cruise in the Chukchi Sea of the Arctic Ocean. Credit:AP
If they are not picking that blob up, “should we trust those models on AMOC stability?” Professor Rahmstorf asks.
The IPCC’s language, too, doesn’t necessarily convey the nature of the threat, much of which will be detailed in the second AR6 report on the impacts of climate change, scheduled for release next February.
“Like just stating the AMOC collapse by 2100 is ‘very unlikely’ – that was in a previous report – it sounds reassuring,” Professor Rahmstorf said. “Now the IPCC says they have ‘medium confidence’ that it won’t happen by 2100, whatever that means.”
West Antarctica has enough ice to raise global sea levels by more than 3 metres if it melts.Credit:Ian Joughin
West Antarctic melt
Another potential tipping point is the possible disintegration of the West Antarctic ice sheet. Much of the sheet lies below sea level and as the Southern Ocean warms, it will melt causing it to “flow” towards the sea in a process that is expected to be self-sustaining.
This so-called marine ice sheet instability is identified in the IPCC report as likely resulting in ice mass loss under all emissions scenarios. There is also “deep uncertainty in projections for above 3 degrees of warming”, the report states.
Containing enough water to lift sea levels by 3.3 metres, it matters what happens to the ice sheet. As Andrew Mackintosh, an ice expert at Monash University, says, the understanding is limited: “We know more about the surface of Mars than the ice sheet bed under the ice.”
Permafrost not so permanent
Much has been made about the so-called “methane bomb” sitting under the permafrost in the northern hemisphere. As the Arctic has warmed at more than twice the pace of the globe overall, with heatwaves of increasing intensity and duration, it is not surprising that the IPCC has listed the release of so-called biogenic emissions from permafrost thaw as among potential tipping points.
These emissions could total up to 240 gigatonnes of CO2-equivalent which, if released, would add an unwanted warming boost.
The IPCC lists as “high” the probability of such releases during this century, adding there is “high confidence” that the process is irreversible at century scales.
“In some cases abrupt changes can occur in Earth System Models but don’t on the timescales of the projections (for example, an AMOC collapse),” said Peter Cox, a Professor of Climate System Dynamics at the UK’s University of Exeter. “In other cases the processes involved are not yet routinely included in ESMs [such as] CO2 and methane release from deep permafrost.”
“In the latter cases IPCC statements are made on the basis of the few studies available, and are necessarily less definitive,” he said.
Other risks
From the Amazon rainforest to the boreal forests of Russia and Canada, there is a risk of fire and pests that could trigger dieback and transform those regions.
Australia’s bush faces an increased risk of bad fire weather days right across the continent, the IPCC notes. How droughts, heatwaves and heavy rain and other extreme events will play out at a local level is also not well understood.
Ocean acidification and marine heatwaves also mean the world’s coral reefs will be much diminished at more than 1.5 degrees of warming. “You can kiss it goodbye as we know it,” says Sarah Perkins-Kirkpatrick, a climate researcher at the University of NSW, said.
Global monsoons, which affect billions of people including those on the Indian subcontinent, are likely to increase their rainfall in most parts of the world, the IPCC said.
Andy Pitman, director of the ARC Centre of Excellence for Climate Extremes, said policymakers need to understand that much is riding on these tipping points not being triggered as even one or two of them would have long-lasting and significant effects. “How lucky do you feel?” Professor Pitman says.
The Biggest uncertainty
Christian Jakob, a Monash University climate researcher, said that while there remain important uncertainties, science is honing most of those risks down.
Much harder to gauge, though, is which emissions path humans are going to take. Picking between the five scenarios ranging from low to high that we are going to choose is “much larger than the uncertainty we have in the science,” Professor Jakob said.
O impacto do aumento da temperatura média na Terra é planetário, com elevação do nível do mar e alteração de ecossistemas inteiros, entre outras mudanças.
Alterações regionais do clima, com maior frequência de eventos extremos, já são percebidas e se intensificarão nos próximos anos, com consequências diretas na saúde de todos.
No Brasil, alguns estados conviverão com mais dias de calorão, que podem ser prejudiciais à saúde a ponto de provocar a morte de idosos.
Em outros, chuvas intensas se tornarão mais recorrentes, ocasionando inundações que aumentam o risco de doenças, quando não destroem bairros e cidades.
Por fim, as secas também devem ficar mais intensas, o que pode agravar problemas respiratórios.
Além disso, tanto as chuvas intensas quanto as secas prejudicam lavouras, aumentando o preço dos alimentos.
Um exemplo prático de aumento de temperatura está no Sudeste e no Sul do Brasil. Segundo o cenário mais otimista do IPCC, até 2040 os dias com termômetros acima de 35°C passarão de 26 por ano (média de 1995 a 2014) para 32. Num cenário intermediário, até o final do século esse número pode chegar a 43, um aumento de mais de 65% em relação à situação recente.
No Centro-Oeste, o aumento do calorão é ainda mais severo. No cenário intermediário, do IPCC, a média de 53 dias por ano com termômetros acima de 35°C salta para cerca de 72 até 2040 e para 108 até o fim do século, ou pouco mais de um trimestre de temperatura extrema.
As consequências para a saúde são graves. Ondas de calor extremo podem causar hipertermia, que afeta os órgãos internos e provoca lesões no coração, nas células musculares e nos vasos sanguíneos. São danos que podem levar à morte.
Homem empurra carrinho com frutas em rua inundada em Manaus, que enfrentou, nos últimos meses, a maior cheia já registrada do rio Negro – Michael Dantas/AFP
Em junho, uma onda de calor nos estados de Oregon e Washington, nos Estados Unidos, custou a vida de centenas de pessoas. Segundo reportagem do jornal The New York Times, foram registrados cerca de 600 óbitos em excesso no período.
Além do calor, a crise do clima deve tornar mais frequentes os períodos de seca e os dias sem chuva em muitas regiões. É o caso da Amazônia.
Dados do IPCC apontam que, na região Norte, no período 1995-2014 eram em média 43 dias consecutivos sem chuva por ano, que podem aumentar para 51, com períodos 10% mais secos até 2040.
Situação similar deve ocorrer no Centro-Oeste, que tinha 69 dias consecutivos sem chuva por ano, que podem ir a 76, com períodos 13% mais secos.
Períodos mais secos nessas regiões preocupam por causa das queimadas. Na Amazônia, por exemplo, a época sem chuvas é associada à intensificação de processos de desmatamento e de incêndios.
As queimadas na região amazônica têm relação com piora da qualidade do ar e consequentes problemas respiratórios. A Fiocruz e a ONG WWF-Brasil estimam que estados amazônicos com índices elevados de queimadas tenham gastado, em dez anos, quase R$ 1 bilhão com hospitalizações por doenças respiratórias provavelmente relacionadas à fumaça dos incêndios.
No ano passado, o Pantanal passou por sua pior seca dos últimos 60 anos, estiagem que ainda pode continuar por até cinco anos, segundo afirmou à época a Secretaria Nacional de Proteção e Defesa Civil. A situação fez explodir o número de queimadas na região.
O IPCC também aponta aumento da frequência e da intensidade de chuvas extremas e enchentes em diversas regiões do Brasil.
Além dos danos óbvios na infraestrutura das cidades, as inundações provocam problemas de saúde. Hepatite A (transmitida de modo oral-fecal, ou seja, por alimentos e água contaminada) e leptospirose (com transmissão a partir do contato com urina de ratos) são suspeitos conhecidos, mas há também o risco de acidentes com animais peçonhentos, já que cobras e escorpiões podem procurar abrigos dentro das casas.
Manaus tornou-se exemplo recente desse tipo de situação. A cidade enfrentou uma cheia histórica, a maior desde o início das medições, há 119 anos. As águas do rio Negro provocaram inundações com duração superior a um mês na principal capital da região amazônica. Seis das dez maiores cheias já registradas no rio ocorreram no século 21, ou seja, nas últimas duas décadas.
Ruas da região do porto de Manaus tiveram que ser interditadas e foi necessária a construção de passarelas sobre as vias alagadas. Enquanto isso, comerciantes fizeram barreiras com sacos de areia e jogaram cal na água parada para tentar neutralizar o cheiro de fezes.
Em meio à inundação em igarapés, houve acúmulo de lixo, que chegou a cobrir toda a área superficial da água. Dentro das casas, moradores usaram plataformas de madeira (chamadas de marombas) para suspender móveis e eletrodomésticos.
As enchentes não são exclusividade amazônica. Elas também ocorrem na região Sudeste, em São Paulo e Rio de Janeiro, por exemplo.
Pouco tempo depois da cheia em Manaus, a Europa também viu chuvas intensas concentradas em um curto espaço de tempo causarem inundações severas, principalmente na Alemanha. Além da destruição de vias públicas e imóveis, houve mais de uma centena de mortes.
Também no mesmo período, a China teve que lidar com grandes precipitações e perda de vidas humanas pelas inundações, que chegaram a encher de água o metrô, deixando pessoas presas. Foram as piores chuvas em 60 anos em Zhengzhou, capital da província de Henan.
Em termos globais, um estudo recente apontou o aumento da população exposta a inundações. De 2000 a 2015, de 255 milhoes a 290 milhões de pessoas foram diretamente afetadas por enchentes.
Segundo Lincoln Alves, pesquisador do Inpe (Instituto Nacional de Pesquisas Espaciais) e autor-líder do Atlas do IPCC, a ferramenta pretende facilitar o acesso a informações normalmente complexas. “É visível a mudança do clima”, afirma o pesquisador.
A partir do Atlas, diz Alves, é possível que comunidades, empresas e até esferas do governo consigam olhar de forma mais regional para os efeitos da crise do clima.
A ferramenta permite ver a história climática da Terra e observar as projeções para diferentes variáveis em diferentes cenários de emissões —e de aquecimento, como 1,5°C e 2°C— apontados pelo IPCC.
PRINCIPAIS CONCLUSÕES DO RELATÓRIO DO IPCC
Aumento de temperatura provocada pelo ser humano desde 1850-1900 até 2010-2019: de 0,8°C a 1,21°C
Os anos de 2016 a 2020 foram o período de cinco anos mais quentes de 1850 a 2020
De 2021 a 2040, um aumento de temperatura de 1,5°C é, no mínimo, provável de acontecer em qualquer cenário de emissões
A estabilização da temperatura na Terra pode levar de 20 a 30 anos se houver redução forte e sustentada de emissões
O oceano está esquentando mais rápido —inclusive em profundidades maiores do que 2.000 m— do que em qualquer período anterior, desde pelo menos a última transição glacial. É extremamente provável que as atividades humanas sejam o principal fator para isso
O oceano continuará a aquecer por todo o século 21 e provavelmente até 2300, mesmo em cenários de baixas emissões
O aquecimento de áreas profundas do oceano e o derretimento de massas de gelo tende a elevar o nível do mar, o que tende a se manter por milhares de anos
Nos próximos 2.000 anos, o nível médio global do mar deve aumentar 2 a 3 metros, se o aumento da temperatura ficar contido em 1,5°C. Se o aquecimento global ficar contido a 2°C, o nível deve aumentar de 2 a 6 metros. No caso de 5°C de aumento de temperatura, o mar subirá de 19 a 22 metros
The word has been out for decades: We were born on a damaged planet careening toward environmental collapse. Yet our intellects are poorly equipped to grasp the scale of the Earth’s ecological death spiral. We strain to picture how, in just a few decades, climate change may displace entire populations. We struggle to envision the fate of plastic waste that will outlast us by centuries. We fail to imagine our descendants inhabiting an exhausted Earth worn out from resource extraction and devoid of biodiversity. We lack frames of reference in our everyday lives for thinking about nuclear waste’s multimillennial timescales of radioactive hazard.
I am an anthropologist who studies how societies hash out relationships between living communities of the present and unborn communities imagined to inhabit the future. Studying how a community relates to the passage of time, I’ve learned, can offer a window into its values, worldviews, and lifeways.
From 2012 to 2014, I conducted 32 months of anthropological fieldwork exploring how Finland’s nuclear energy waste experts grappled with Earth’s radically long-term future. These experts routinely dealt with long-lived radionuclides such as uranium-235, which has a half-life of over 700 million years. They worked with the nuclear waste management company Posiva to help build a final disposal facility approximately 450 meters below the islet of Olkiluoto in the Gulf of Bothnia in the Baltic Sea. If all goes according to plan, this facility will, in the mid-2020s, become the world’s first operating deep geologic repository for spent nuclear fuel.
To assess the Olkiluoto repository’s long-term durability, these experts developed a “safety case” forecasting geological, hydrological, and ecological events that could potentially occur in Western Finland over the coming tens of thousands — or even hundreds of thousands — of years. From their efforts emerged visions of distant future glaciations, climate changes, earthquakes, floods, human and animal population changes, and more. These forecasts became the starting point for a series of “mental time travel” exercises that I incorporated into my book, “Deep Time Reckoning.”
Stretching the mind across time — even in the most speculative ways — can help us become more responsible planetary stewards: It can help endow us with the time literacy necessary for tackling long-term challenges such as biodiversity loss, microplastics accumulation, climate change, antibiotic resistance, asteroid impacts, sustainable urban planning, and more. This can not only make us feel more at home in pondering our planet’s pasts and futures. It can also draw us to imagine the world from the perspective of future human and non-human communities — fostering empathy across generations.
5710 CE. A tired man lounges on a sofa. He lives in a small wooden house in a region once called Eurajoki, Finland. He works at a local medical center. Today is his day off. He’s had a long day in the forest. He hunted moose and deer and picked lingonberries, mushrooms, and bilberries. He now sips water, drawn from a village well, from a wooden cup. His husband brings him a dinner plate. On it are fried potatoes, cereal, boiled peas, and beef. All the food came from local farms. The cattle were watered at a nearby river. The crops were watered by irrigation channels flowing from three local lakes.
The man has no idea that, more than 3,700 years ago, safety case biosphere modelers used 21st-century computer technologies to reckon everyday situations like his. He does not know that they once named the lakes around him — which formed long after their own deaths — “Liiklanjärvi,” “Tankarienjärvi,” and “Mäntykarinjärvi.” He is unaware of Posiva’s ancient determination that technological innovation and cultural habits are nearly impossible to predict even decades in advance. He is unaware that Posiva, in response, instructed its modelers to pragmatically assume that Western Finland’s populations’ lifestyles, demographic patterns, and nutritional needs will not change much over the next 10,000 years. He does not know the safety case experts inserted, into their models’ own parameters, the assumption that he and his neighbors would eat only local food.
Yet the hunter’s life is still entangled with the safety case experts’ work. If they had been successful, then the vegetables, meat, fruit, and water before him should have just a tiny chance of containing only tiny traces of radionuclides from 20th-century nuclear power plants.
12020 CE. A solitary farmer looks out over her pasture, surrounded by a green forest of heath trees. She lives in a sparse land once called Finland, on a fertile island plot once called Olkiluoto. The area is an island no longer. What was once a coastal bay is now dotted with small lakes, peat bogs, and mires with white sphagnum mosses and grassy sedge plants. The Eurajoki and Lapijoki Rivers drain out into the sea. When the farmer goes fishing at the lake nearby, she catches pike. She watches a beaver swim about. Sometimes she feels somber. She recalls the freshwater ringed seals that once shared her country before their extinction.
The woman has no idea that, deep beneath her feet, lies an ancestral deposit of copper, iron, clay, and radioactive debris. This is a highly classified secret — leaked to the public several times over the millennia, but now forgotten. Yet even the government’s knowledge of the burial site is poor. Most records were destroyed in a global war in the year 3112. It was then that ancient forecasts of the site, found in the 2012 safety case report “Complementary Considerations,” were lost to history.
But the farmer does know the mythical stories of Lohikäärme: a dangerous, flying, salmon-colored venomous snake that kills anyone who dares dig too close to his underground cave. She and the other farmers in the area grow crops of peas, sugar beet, and wheat. They balk at the superstitious fools who tell them the monster living beneath their feet is real.
35,012 CE. A tiny microbe floats in a large, northern lake. It does not know that the clay, silt, and mud floor below it is gaining elevation, little by little, year after year. It is unaware that, 30 millennia ago, the lake was a vast sea. Dotted with sailboats, cruise and cargo ships, it was known by humans as the Baltic. Watery straits, which connected the Baltic Sea to the North Sea, had risen above the water thousands of years ago. Denmark and Sweden fused into a single landmass. The seafloor was decompressing from the Weichselian glaciation — an enormous sheet of ice that pressed down on the land during a previous ice age.
After the last human died, the landmass kept on rising. Its uplift was indifferent to human extinction. It was indifferent to how, in 2013 CE, an anthropologist and a safety case expert sat chatting in white chairs in Ravintola Rytmi: a café in Helsinki. There, the safety case expert relayed his projection that, by 52,000 CE, there would no longer be water separating Turku, Finland, and Stockholm, Sweden. At that point, one could walk from one city to the other on foot. The expert reckoned that, to the north — between Vaasa, Finland, and Umeå, Sweden — one would someday find a waterfall with the planet’s largest deluge of flowing water. The waterfall could be found at the site of a once-submerged sea shelf.
The microbe, though, does not know or care about Vaasa, Umeå, Denmark, long-lost boats, safety case reports, or Helsinki’s past dining options. It has no concept of them. Their significances died with the humans. Nor does the microbe grasp the suffering they faced when succumbing to Anthropocene collapse. Humans’ past technological feats, grand civilizations, passion projects, intellectual triumphs, wartime sacrifices, and personal struggles are now moot. And yet, the radiological safety of the microbe’s lake’s waters still hinges on the work of a handful of human safety case experts who lived millennia ago. Thinking so far ahead, these experts never lived to see whether their deep time forecasts were accurate.
We do not, of course, live in these imagined worlds. In this sense, they are unreal — merely fictions. However, our capacities to envision potential futures, and to feel empathy for those who may inhabit them, are very real. Depictions of tomorrow can have powerful, concrete effects on the world today. This is why deep time thought experiments are not playful games, but serious acts of intellectual problem-solving. It is why the safety case experts’ models of far future nuclear waste risks are uniquely valuable, even if they are, at the end of the day, mere approximations.
Yet pondering distant future Earths can also help us take a step back from our everyday lives — enriching our imaginations by transporting our minds to different places and times. Corporate coaches have recommended taking breaks from our familiar thinking patterns to experience the world in new ways and overcome mental blocks. Cognitive scientists have shown how creativity can be sparked by perceiving “something one has not seen before (but that was probably always there).”
Putting aside a few minutes each day for long-termist, planetary imagination can enrich us with greater mental dexterity in navigating between multiple, interacting timescales. This can cultivate more longsighted empathy for landscapes, people, and other organisms across decades, centuries, and millennia. As the global ecological crisis takes hold, embracing planetary empathy will prove essential to our collective survival.
—
Vincent Ialenti is a Research Fellow at The University of Southern California and The Berggruen Institute. His recent book, “Deep Time Reckoning,” is an anthropological study of how Finland’s nuclear waste repository experts grappled with distant future ecosystems and the limits of human knowledge.
As the Intergovernmental Panel on Climate Change (IPCC) released its Sixth Assessment Report, summarized nicely on these pages by Bob Henson, much of the associated media coverage carried a tone of inevitable doom.
These proclamations of unavoidable adverse outcomes center around the fact that in every scenario considered by IPCC, within the next decade average global temperatures will likely breach the aspirational goal set in the Paris climate agreement of limiting global warming to 1.5 degrees Celsius (2.7 degrees Fahrenheit) above pre-industrial temperatures. The report also details a litany of extreme weather events like heatwaves, droughts, wildfires, floods, and hurricanes that will all worsen as long as global temperatures continue to rise.
While United Nations Secretary-General António Guterres rightly called the report a “code red for humanity,” tucked into it are details illustrating that if – BIG IF –top-emitting countries respond to the IPCC’s alarm bells with aggressive efforts to curb carbon pollution, the worst climate outcomes remain avoidable.
The IPCC’s future climate scenarios
In the Marvel film Avengers: Infinity War, the Dr. Strange character goes forward in time to view 14,000,605 alternate futures to see all the possible outcomes of the Avengers’ coming conflict. Lacking the fictional Time Stone used in this gambit, climate scientists instead ran hundreds of simulations of several different future carbon emissions scenarios using a variety of climate models. Like Dr. Strange, climate scientists’ goal is to determine the range of possible outcomes given different actions taken by the protagonists: in this case, various measures to decarbonize the global economy.
The scenarios considered by IPCC are called Shared Socioeconomic Pathways (SSPs). The best-case climate scenario, called SSP1, involves a global shift toward sustainable management of global resources and reduced inequity. The next scenario, SSP2, is more of a business-as-usual path with slow and uneven progress toward sustainable development goals and persisting income inequality and environmental degradation. SSP3 envisions insurgent nationalism around the world with countries focusing on their short-term domestic best interests, resulting in persistent and worsening inequality and environmental degradation. Two more scenarios, SSP4 and SSP5, consider even greater inequalities and fossil fuel extraction, but seem at odds with an international community that has agreed overwhelmingly to aim for the Paris climate targets.
The latest IPCC report’s model runs simulated two SSP1 scenarios that would achieve the Paris targets of limiting global warming to 1.5 and 2°C (2.7 and 3.6°F); one SSP2 scenario in which temperatures approach 3°C (5.4°F) in the year 2100; an SSP3 scenario with about 4°C (7.2°F) global warming by the end of the century; and one SSP5 ‘burn all the fossil fuels possible’ scenario resulting in close to 5°C (9°F), again by 2100.
Projected global average surface temperature change in each of the five SSP scenarios. (Source: IPCC Sixth Assessment Report)
The report’s SSP3-7.0 pathway (the latter number represents the eventual global energy imbalance caused by the increased greenhouse effect, in watts per square meter), is considered by many experts to be a realistic worst-case scenario, with global carbon emissions continuing to rise every year throughout the 21st century. Such an outcome would represent a complete failure of international climate negotiations and policies and would likely result in catastrophic consequences, including widespread species extinctions, food and water shortages, and disastrous extreme weather events.
Scenario SSP2-4.5 is more consistent with government climate policies that are currently in place. It envisions global carbon emissions increasing another 10% over the next decade before reaching a plateau that’s maintained until carbon pollution slowly begins to decline starting in the 2050s. Global carbon emissions approach but do not reach zero by the end of the century. Even in this unambitious scenario, the very worst climate change impacts might be averted, although the resulting climate impacts would be severe.
Most encouragingly, the report’s two SSP1 scenarios illustrate that the Paris targets remain within reach. To stay below the main Paris target of 2°C (3.6°F) warming, global carbon emissions in SSP1-2.6 plateau essentially immediately and begin to decline after 2025 at a modest rate of about 2% per year for the first decade, then accelerating to around 3% per year the next decade, and continuing along a path of consistent year-to-year carbon pollution cuts before reaching zero around 2075. The IPCC concluded that once global carbon emissions reach zero, temperatures will stop rising. Toward the end of the century, emissions in SSP1-2.6 move into negative territory as the IPCC envisions that efforts to remove carbon from the atmosphere via natural and technological methods (like sequestering carbon in agricultural soils and scrubbing it from the atmosphere through direct air capture) outpace overall fossil fuel emissions.
Meeting the aspirational Paris goal of limiting global warming to 1.5°C (2.7°F) in SSP1-1.9 would be extremely challenging, given that global temperatures are expected to breach this level within about a decade. This scenario similarly envisions that global carbon emissions peak immediately and that they decline much faster than in SSP1-2.6, at a rate of about 6% per year from 2025 to 2035 and 9% per year over the following decade, reaching net zero by around the year 2055 and becoming net negative afterwards.
Global carbon dioxide emissions (in billions of tons per year) from 2015 to 2100 in each of the five SSP scenarios. (Source: IPCC Sixth Assessment Report)
For perspective, global carbon emissions fell by about 6-7% in 2020 as a result of restrictions associated with the COVID-19 pandemic and are expected to rebound by a similar amount in 2021. As IPCC report contributor Zeke Hausfather noted, this scenario also relies on large-scale carbon sequestration technologies that currently do not exist, without which global emissions would have to reach zero a decade sooner.
More warming means more risk
The new IPCC report details that, depending on the region, climate change has already worsened extreme heat, drought, fires, floods, and hurricanes, and those will only become more damaging and destructive as temperatures continue to rise. The IPCC’s 2018 “1.5°C Report” had entailed the differences in climate consequences in a 2°C vs. 1.5°C world, as summarized at this site by Bruce Lieberman.
Consider that in the current climate of just over 1°C (2°F) warmer than pre-industrial temperatures, 40 countries this summer alone have experienced extreme flooding, including more than a year’s worth of rain falling within 24 hours in Zhengzhou, China. Many regions have also experienced extreme heat, including the deadly Pacific Northwest heatwave and dangerously hot conditions during the Olympics in Tokyo. Siberia, Greece, Italy, and the US west coast are experiencing explosive wildfires, including the “truly frightening fire behavior” of the Dixie fire, which broke the record as the largest single wildfire on record in California. The IPCC report warned of “compound events” like heat exacerbating drought, which in turn fuels more dangerous wildfires, as is happening in California.
Western North America (WNA) and the Mediterranean (MED) regions are those for which climate scientists have the greatest confidence that human-caused global warming is exacerbating drought by drying out the soil. (Source: IPCC Sixth Assessment Report)The southwestern United States and Mediterranean are also among the regions for which climate scientists have the greatest confidence that climate change will continue to increase drought risk and severity. (Source: IPCC Sixth Assessment Report)
The IPCC report notes that the low-emissions SSP1 scenarios “would lead to substantially smaller changes” in these sorts of climate impact drivers than the higher-emissions scenarios. It also points out that with the world currently at around 1°C of warming, the intensity of extreme weather will be twice as bad compared to today’s conditions if temperatures reach 2°C (1°C hotter than today) than if the warming is limited to 1.5°C (0.5°C hotter than today), and quadruple as bad if global warming reaches 3°C (2°C hotter than today). For example, what was an extreme once-in-50-years heat wave in the late-1800s now occurs once per decade, which would rise to almost twice per decade at 1.5°C, and nearly three times per decade at 2°C global warming.
The increasing frequency and intensity of what used to be 1-in-50-year extreme heat as global temperatures rise. (Source: IPCC Sixth Assessment Report)
Climate’s fate has yet to be written
At the same time, there is no tipping point temperature at which it becomes “too late” to curb climate change and its damaging consequences. Every additional bit of global warming above current temperatures will result in increased risks of worsening extreme weather of the sorts currently being experienced around the world. Achieving the aspirational 1.5°C Paris target may be politically infeasible, but most countries (137 total) have either committed to or are in the process of setting a target for net zero emissions by 2050 (including the United States) or 2060 (including China).
That makes the SSP1 scenarios and limiting global warming to less than 2°C a distinct possibility, depending on how successful countries are at following through with decarbonization plans over the coming three decades. And with its proposed infrastructure bipartisan and budget reconciliation legislative plans – for which final enactment of each remains another big IF – the United States could soon implement some of the bold investments and policies necessary to set the world’s second-largest carbon polluter on a track consistent with the Paris targets.
Again and again, assessment after assessment, the IPCC has already made it clear. Climate change puts at risk every aspect of human life as we know it … We are already starting to experience those risks today; but we know what we need to do to avoid the worst future impacts. The difference between a fossil fuel versus a clean energy future is nothing less than the future of civilization as we know it.
Back to the Avengers: They had only one chance in 14 million to save the day, and they succeeded. Time is running short, but policymakers’ odds of meeting the Paris targets remain much better than that. There are no physical constraints playing the role of Thanos in our story; only political barriers stand between humanity and a prosperous clean energy future, although those can sometimes be the most difficult types of barriers to overcome.
The new IPCC report is “a code red for humanity”, says UN Secretary-General António Guterres.
Established in 1988 by United Nations Environment Programme (UNEP) and the World Meteorological Organisation (WMO), the Intergovernmental Panel on Climate Change (IPCC) assesses climate change science. Its new report is a warning sign for policy makers all over the world.
In this picture taken on 26 October, 2014, Peia Kararaua, 16, swims in the flooded area of Aberao village in Kiribati. Kiribati is one of the countries worst hit by the sea level rise since high tides mean many villages are inundated, making them uninhabitable. Image credit: UNICEF/Sokhin
This was the first time the approval meeting for the report was conducted online. There were 234 authors from the world over who clocked in 186 hours working together to get this report released.
For the first time, the report offers an interactive atlas for people to see what has already happened and what may happen in the future to where they live.
“This report tells us that recent changes in the climate are widespread, rapid and intensifying, unprecedented in thousands of years,” said IPCC Vice-Chair Ko Barrett.
UNEP Executive Director Inger Andersen that scientists have been issuing these messages for more than three decades, but the world hasn’t listened.
Here are the most important takeaways from the report:
Humans are to be blamed
Human activity is the cause of climate change and this is an unequivocal fact. All the warming caused in the pre-industrial times had been generated by the burning of fossil fuels such as coal, oil, wood, and natural gas.
Global temperatures have already risen by 1.1 degrees Celsius since the 19th century. They have reached their highest in over 100,000 years, and only a fraction of that increase has come from natural forces.
Michael Mann told the Independentthe effects of climate change will be felt in all corners of the world and will worsen, especially since “the IPCC has connected the dots on climate change and the increase in severe extreme weather events… considerably more directly than previous assessments.”
We will overshoot the 1.5 C mark
According to the report’s highly optimistic-to-reckless scenarios, even if we do everything right and start reducing emissions now, we will still overshoot the 1.5C mark by 2030. But, we will see a drop in temperatures to around 1.4 C.
Control emissions, Earth will do the rest
According to the report, if we start working to bring our emissions under control, we will be able to decrease warming, even if we overshoot the 1.5C limit.
The changes we are living through are unprecedented; however, they are reversible to a certain extent. And it will take a lot of time for nature to heal. We can do this by reducing our greenhouse gas (GHG) emissions. While we might see some benefits quickly, “it could take 20-30 years to see global temperatures stabilise” says the IPCC.
Sea level rise
Global oceans have risen about 20 centimetres (eight inches) since 1900, and the rate of increase has nearly tripled in the last decade. Crumbling and melting ice sheets atop Antarctica (especially in Greenland) have replaced glacier melt as the main drivers.
If global warming is capped at 2 C, the ocean watermark will go up about half a metre over the 21st century. It will continue rising to nearly two metres by 2300 — twice the amount predicted by the IPCC in 2019.
Because of uncertainty over ice sheets, scientists cannot rule out a total rise of two metres by 2100 in a worst-case emissions scenario.
CO2 is at all-time high
CO2 levels were greater in 2019 than they had been in “at least two million years.” Methane and nitrous oxide levels, the second and third major contributors of warming respectively, were higher in 2019 than at any point in “at least 800,000 years,” reported the Independent.
Control methane
The report includes more data than ever before on methane (CH4), the second most important greenhouse gas after CO2, and warns that failure to curb emissions could undermine Paris Agreement goals.
Human-induced sources are roughly divided between leaks from natural gas production, coal mining and landfills on one side, and livestock and manure handling on the other.
CH4 lingers in the atmosphere only a fraction as long as CO2, but is far more efficient at trapping heat. CH4 levels are their highest in at least 800,000 years.
Natural allies are weakened
Since about 1960, forests, soil and oceans have absorbed 56 percent of all the CO2 humanity has released into the atmosphere — even as those emissions have increased by half. Without nature’s help, Earth would already be a much hotter and less hospitable place.
But these allies in our fight against global heating — known in this role as carbon sinks — are showing signs of saturatation, and the percentage of human-induced carbon they soak up is likely to decline as the century unfolds.
Suck it out
The report suggests that warming could be brought back down via “negative emissions.” We could cool down the planet by sucking out or sequestering the carbon from the atmosphere. While this is a viable suggestion that has been thrown around and there have been small-scale studies that have tried to do this, the technology is not yet perfect. The panel said that could be done starting about halfway through this century but doesn’t explain how, and many scientists are skeptical about its feasibility.
Cities will bear the brunt
Expertswarn that the impact of some elements of climate change, like heat, floods and sea-level rise in coastal areas, may be exacerbated in cities. Furthermore, IPCC experts warn that low-probability scenarios, like an ice sheet collapse or rapid changes in ocean circulation, cannot be ruled out.
A perversidade do negacionismo recai em jurar que se está dizendo o contrário do que de fato se diz. Nesta novilíngua, negacionismo veste o sapatênis do antialarmismo. Chega a ser tedioso, posto que mofado, o argumento de Leandro Narloch nesta Folha na terça (10). Mofado pois —como relata Michael Mann em “The New Climate War”— não passa da mesma retórica negacionista 2.0.
Em essência, Narloch defende que há atividades nocivas ao clima que devem ser “celebradas e difundidas” por nos tornar “menos vulneráveis à natureza”. Narloch está cientificamente errado. E o faz subscrevendo a uma das formas mais nefárias de negacionismo: mascara-o, vendendo soluções que não só não são capazes de mitigar e adaptar as sociedades à crise climática como possuem o efeito adverso. Implode-se a Amazônia para salvá-la, eis o argumento.
Esses e outros discursos negacionistas já tinham sido mapeados na revista Global Sustaintability, de Cambridge, em julho de 2020: não são novos. Em vez de mexer em tabus do século 21, vendem-se inverdades como se ciência fosse. Narloch erra no conceito de vulnerabilidade: dos incêndios florestais na Califórnia às inundações na Alemanha, não estamos protegidos contra a natureza porque nela estamos inseridos. Ignora, ademais, a vasta literatura do Painel do Clima sobre vulnerabilidade.
Narloch desconsidera o conceito da ciência climática de “feedback loops”: a crise climática aciona uma série de gatilhos de dimensão incalculável, uma reação de cadeia nunca vista. Destruir o clima não nos protegerá do clima, porque é a ausência de uma mudança drástica energética que tem aprofundado a crise climática. É ineficiente o investir no contrário.
Se o relatório do Painel do Clima acendeu o sinal vermelho, não é com desinformação que o jornalismo contribuirá ao tema. Pluralismo é um rio onde as ideias se movem dentro das margens da verdade e da ciência. Não reclamem quando o rio secar, implodindo as margens que o jornalismo deveria ter protegido.
Na sua opinião, o que aconteceu nos últimos cem anos com o número total de mortes causadas por furacões, inundações, secas, ondas de calor e outros desastres climáticos? Peço que escolha uma destas alternativas:
a) Aumentou mais de 800%
b) Aumentou cerca de 50%
c) Manteve-se constante
d) Diminuiu cerca de 50%
e) Diminuiu mais de 80%
Como a população mundial cresceu de 1,8 bilhão em 1921 para 8 bilhões em 2021, é razoável cravar as respostas B ou C, pois o fato de haver mais pessoas resultaria em mais vítimas. Muitos leitores devem ter escolhido a primeira opção, tendo em vista as notícias assustadoras do relatório do IPCC desta semana.
A alternativa correta, porém, é a última. As mortes por desastres naturais diminuíram 87% desde a década de 1920 até os anos 2010, segundo dados coletados pelo Our World in Data.
Passaram de 540 mil por ano para 68 mil. A taxa em relação à população teve picos de 63 mortes por 100 mil habitantes em 1921, e 176 em 1931. Hoje está em 0,15.
Esses números levam a dois paradoxos interessantes sobre a relação entre o homem e o clima. O primeiro lembra o Paradoxo de Spencer –referência a Herbert Spencer, para quem “o grau de preocupação pública sobre um problema ou fenômeno social varia inversamente a sua incidência”.
Assim como os ingleses se deram conta da pobreza quando ela começava a diminuir, durante a Revolução Industrial, a humanidade está apavorada com os infortúnios do clima justamente depois de conseguir sobreviver a eles.
O segundo paradoxo: ao mesmo tempo em que emitimos muito (mas muito mesmo) carbono na atmosfera e causamos um grave problema de efeito estufa, também nos tornamos menos vulneráveis à natureza. Na verdade, proteger-se do clima foi um dos principais motivos para termos poluído tanto.
Veja o caso da construção. Produzir cimento consiste grosseiramente em queimar calcário e liberar dióxido de carbono.
Se a indústria de cimento fosse um país, seria o terceiro maior emissor de gases do efeito estufa. Mas essa indústria poluidora permitiu que as pessoas deixassem casas de pau-a-pique ou madeira para dormirem abrigadas em estruturas mais seguras.
Já a fome originada pela seca, principal causa de morte por desastres naturais nos anos 1920, foi resolvida com a criação dos fertilizantes químicos, sistemas de irrigação e a construção de represas e redes de saneamento.
Todas essas atividades causaram aquecimento global –mas não deixam de ser grandes conquistas humanas, que merecem ser celebradas e difundidas entre os pobres que ainda vivem sob risco de morrer durante furacões, secas ou inundações.
Será que a queda histórica das mortes por desastres naturais vai se reverter nos próximos anos, tornando realidade os vaticínios apocalípticos de Greta Thunberg, para quem “bilhões de pessoas morrerão se não tomarmos medidas urgentes”?
O ativista climático Michael Shellenberger, autor do brilhante “Apocalipse Nunca”, que será lançado este mês no Brasil pela editora LVM, acha que não.
Pretendo falar mais sobre o livro de Shellenberger em outras colunas, mas já adianto um dos argumentos: o alarmismo ambiental despreza a capacidade humana de se adaptar e resolver problemas.
“Os Países Baixos, por exemplo, tornaram-se uma nação rica mesmo tendo um terço de suas terras abaixo do nível do mar, incluindo áreas que estão nada menos do que sete metros abaixo do mar”, diz ele.
A luta contra o aquecimento global não precisa de ativistas obcecados com o apocalipse (que geralmente desprezam soluções óbvias, como a energia nuclear). Precisa de tecnologia, de inovadores, de gente que dê mais conforto e segurança à humanidade interferindo na natureza cada vez menos.
Amanda Shendruk, Tim McDonnell, David Yanofsky, Michael J. Coren
Published August 10, 2021
[Check the original publication here for the text of the report with most important parts highlighted.]
The most important takeaways from the new Intergovernmental Panel on Climate Change report are easily summarized: Global warming is happening, it’s caused by human greenhouse gas emissions, and the impacts are very bad (in some cases, catastrophic). Every fraction of a degree of warming we can prevent by curbing emissions substantially reduces this damage. It’s a message that hasn’t changed much since the first IPCC report in 1990.
But to reach these conclusions (and ratchet up confidence in their findings), hundreds of scientists from universities around the globe spent years combing through the peer-reviewed literature—at least 14,000 papers—on everything from cyclones to droughts.
The final Aug. 9 report is nearly 4,000 pages long. While much of it is written in inscrutable scientific jargon, if you want to understand the scientific case for man-made global warming, look no further. We’ve reviewed the data, summarized the main points, and created an interactive graphic showing a “heat map” of scientists’ confidence in their conclusions. The terms describing statistical confidence range from very high confidence (a 9 out of 10 chance) to very low confidence (a 1 in 10 chance). Just hover over the graphic [here] and click to see what they’ve written.
Here’s your guide to the IPCC’s latest assessment.
CH 1: Framing, context, methods
The first chapter comes out swinging with a bold political charge: It concludes with “high confidence” that the plans countries so far have put forward to reduce emissions are “insufficient” to keep warming well below 2°C, the goal enshrined in the 2015 Paris Agreement. While unsurprising on its own, it is surprising for a document that had to be signed off on by the same government representatives it condemns. It then lists advancements in climate science since the last IPCC report, as well as key evidence behind the conclusion that human-caused global warming is “unequivocal.”
Highlights
👀Scientists’ ability to observe the physical climate system has continued to improve and expand.
📈Since the last IPCC report, new techniques have provided greater confidence in attributing changes in extreme events to human-caused climate change.
🔬The latest generation of climate models is better at representing natural processes, and higher-resolution models that better capture smaller-scale processes and extreme events have become available.
CH 2: Changing state of the climate system
Chapter 2 looks backward in time to compare the current rate of climate changes to those that happened in the past. That comparison clearly reveals human fingerprints on the climate system. The last time global temperatures were comparable to today was 125,000 years ago, the concentration of atmospheric carbon dioxide is higher than anytime in the last 2 million years, and greenhouse gas emissions are rising faster than anytime in the last 800,000 years.
Highlights
🥵Observed changes in the atmosphere, oceans, cryosphere, and biosphere provide unequivocal evidence of a world that has warmed. Over the past several decades, key indicators of the climate system are increasingly at levels unseen in centuries to millennia, and are changing at rates unprecedented in at least the last 2000 years
🧊Annual mean Arctic sea ice coverage levels are the lowest since at least 1850. Late summer levels are the lowest in the past 1,000 years.
🌊Global mean sea level (GMSL) is rising, and the rate of GMSL rise since the 20th century is faster than over any preceding century in at least the last three millennia. Since 1901, GMSL has risen by 0.20 [0.15–0.25] meters, and the rate of rise is accelerating.
CH 3: Human influence on the climate system
Chapter 3 leads with the IPCC’s strongest-ever statement on the human impact on the climate: “It is unequivocal that human influence has warmed the global climate system since pre-industrial times” (the last IPCC report said human influence was “clear”). Specifically, the report blames humanity for nearly all of the 1.1°C increase in global temperatures observed since the Industrial Revolution (natural forces played a tiny role as well), and the loss of sea ice, rising temperatures, and acidity in the ocean.
🌍Human-induced greenhouse gas forcing is the main driver of the observed changes in hot and cold extremes.
🌡️The likely range of warming in global-mean surface air temperature (GSAT) in 2010–2019 relative to 1850–1900 is 0.9°C–1.2°C. Of that, 0.8°C–1.3°C is attributable to human activity, while natural forces contributed −0.1°C–0.1°C.
😬Combining the attributable contributions from melting ice and the expansion of warmer water, it is very likely that human influence was the main driver of the observed global mean sea level rise since at least 1970.
CH 4: Future global climate: Scenario-based projections and near-term information
Chapter 4 holds two of the report’s most important conclusions: Climate change is happening faster than previously understood, and the likelihood that the global temperature increase can stay within the Paris Agreement goal of 1.5°C is extremely slim. The 2013 IPCC report projected that temperatures could exceed 1.5°C in the 2040s; here, that timeline has been advanced by a decade to the “early 2030s” in the median scenario. And even in the lowest-emission scenario, it is “more likely than not” to occur by 2040.
Highlights
🌡️By 2030, in all future warming scenarios, globally averaged surface air temperature in any individual year could exceed 1.5°C relative to 1850–1900.
🌊Under all scenarios, it is virtually certain that global mean sea level will continue to rise through the 21st century.
💨Even if enough carbon were removed from the atmosphere that global emissions become net negative, some climate change impacts, such as sea level rise, will be not reversed for at least several centuries.
CH 5: Global carbon and other biochemical cycles and feedbacks
Chapter 5 quantifies the level by which atmospheric CO2 and methane concentrations have increased since 1750 (47% and 156% respectively) and addresses the ability of oceans and other natural systems to soak those emissions up. The more emissions increase, the less they can be offset by natural sinks—and in a high-emissions scenario, the loss of forests from wildfires becomes so severe that land-based ecosystems become a net source of emissions, rather than a sink (this is already happening to a degree in the Amazon).
Highlights
🌲The CO2 emitted from human activities during the decade of 2010–2019 was distributed between three Earth systems: 46% accumulated in the atmosphere, 23% was taken up by the ocean, and 31% was stored by vegetation.
📉The fraction of emissions taken up by land and ocean is expected to decline as the CO2 concentration increases.
💨Global temperatures rise in a near-linear relationship to cumulative CO2 emissions. In other words, to halt global warming, net emissions must reach zero.
CH 6: Short-lived climate forcers
Chapter 6 is all about methane, particulate matter, aerosols, hydrofluorocarbons, and other non-CO2 gases that don’t linger very long in the atmosphere (just a few hours, in some cases) but exert a tremendous influence on the climate while they do. In cases, that influence might be cooling, but their net impact has been to contribute to warming. Because they are short-lived, the future abundance and impact of these gases are highly variable in the different socioeconomic pathways considered in the report. These gases have a huge impact on the respiratory health of people around the world.
Highlights
⛽The sectors most responsible for warming from short-lived climate forcers are those dominated by methane emissions: fossil fuel production and distribution, agriculture, and waste management.
🧊In the next two decades, it is very likely that emissions from short-lived climate forcers will cause a warming relative to 2019, in addition to the warming from long-lived greenhouse gases like CO2.
🌏Rapid decarbonization leads to air quality improvements, but on its own is not sufficient to achieve, in the near term, air quality guidelines set by the World Health Organization, especially in parts of Asia and in some other highly polluted regions.
CH 7: The Earth’s energy budget, climate feedbacks, and climate sensitivity
Climate sensitivity is a measure of how much the Earth responds to changes in greenhouse gas concentrations. For every doubling of atmospheric CO2, temperatures go up by about 3°C, this chapter concludes. That’s about the same level scientists have estimated for several decades, but over time the range of uncertainty around that estimate has narrowed. The energy budget is a calculation of how much energy is flowing into the Earth system from the sun. Put together these metrics paint a picture of the human contribution to observed warming.
🐻❄️The Arctic warms more quickly than the Antarctic due to differences in radiative feedbacks and ocean heat uptake between the poles.
🌊Because of existing greenhouse gas concentrations, energy will continue to accumulate in the Earth system until at least the end of the 21st century, even under strong emissions reduction scenarios.
☁️The net effect of changes in clouds in response to global warming is to amplify human-induced warming. Compared to the last IPCC report, major advances in the understanding of cloud processes have increased the level of confidence in the cloud feedback cycle.
CH 8: Water cycle changes
This chapter catalogs what happens to water in a warming world. Although instances of drought are expected to become more common and more severe, wet parts of the world will get wetter as the warmer atmosphere is able to carry more water. Total net precipitation will increase, yet the thirstier atmosphere will make dry places drier. And within any one location, the difference in precipitation between the driest and wettest month will likely increase. But rainstorms are complex phenomenon and typically happen at a scale that is smaller than the resolution of most climate models, so specific local predictions about monsoon patterns remains an area of relatively high uncertainty.
Highlights
🌎Increased evapotranspiration will decrease soil moisture over the Mediterranean, southwestern North America, south Africa, southwestern South America, and southwestern Australia.
🌧️Summer monsoon precipitation is projected to increase for the South, Southeast and East Asian monsoon domains, while North American monsoon precipitation is projected to decrease. West African monsoon precipitation is projected to increase over the Central Sahel and decrease over the far western Sahel.
🌲Large-scale deforestation has likely decreased evapotranspiration and precipitation and increased runoff over the deforested regions. Urbanization has increased local precipitation and runoff intensity.
CH 9: Ocean, cryosphere, and sea level change
Most of the heat trapped by greenhouse gases is ultimately absorbed by the oceans. Warmer water expands, contributing significantly to sea level rise, and the slow, deep circulation of ocean water is a key reason why global temperatures don’t turn on a dime in relation to atmospheric CO2. Marine animals are feeling this heat, as scientists have documented that the frequency of marine heatwaves has doubled since the 1980s. Meanwhile, glaciers, polar sea ice, the Greenland ice sheet, and global permafrost are all rapidly melting. Overall sea levels have risen about 20 centimeters since 1900, and the rate of sea level rise is increasing.
Highlights
📈Global mean sea level rose faster in the 20th century than in any prior century over the last three millennia.
🌡️The heat content of the global ocean has increased since at least 1970 and will continue to increase over the 21st century. The associated warming will likely continue until at least 2300 even for low-emission scenarios because of the slow circulation of the deep ocean.
🧊The Arctic Ocean will likely become practically sea ice–free during the seasonal sea ice minimum for the first time before 2050 in all considered SSP scenarios.
CH 10: Linking global to regional climate change
Since 1950, scientists have clearly detected how greenhouse gas emissions from human activity are changing regional temperatures. Climate models can predict regional climate impacts. Where data are limited, statistical methods help identify local impacts (especially in challenging terrain such as mountains). Cities, in particular, will warm faster as a result of urbanization. Global warming extremes in urban areas will be even more pronounced, especially during heatwaves. Although global models largely agree, it is more difficult to consistently predict regional climate impacts across models.
Highlights
⛰️Some local-scale phenomena such as sea breezes and mountain wind systems can not be well represented by the resolution of most climate models.
🌆The difference in observed warming trends between cities and their surroundings can partly be attributed to urbanization. Future urbanization will amplify the projected air temperature change in cities regardless of the characteristics of the background climate.
😕Statistical methods are improving to downscale global climate models to more accurately depict local or regional projections.
CH 11: Weather and climate extreme events in a changing climate
Better data collection, modeling, and means scientists are more confident than ever in understanding the role of rising greenhouse gas concentration in weather and climate extremes. We are virtually certain humans are behind observed temperature extremes.
Human activity is more making extreme weather and temperatures more intense and frequent, especially rain, droughts, and tropical cyclones. While even 1.5°C of warming will make events more severe, the intensity of extreme events is expected to at least double with 2°C of global warming compared today’s conditions, and quadruple with 3°C of warming. As global warming accelerates, historically unprecedented climatic events are likely to occur.
Highlights
🌡️It is an established fact that human-induced greenhouse gas emissions have led to an increased frequency and/or intensity of some weather and climate extremes since pre-industrial time, in particular for temperature extremes.
🌎Even relatively small incremental increases in global warming cause statistically significant changes in extremes.
🌪️The occurrence of extreme events is unprecedented in the observed record, and will increase with increasing global warming.
⛈️Relative to present-day conditions, changes in the intensity of extremes would be at least double at 2°C, and quadruple at 3°C of global warming.
CH 12: Climate change information for regional impact and for risk assessment
Climate models are getting better, more precise, and more accurate at predicting regional impacts. We know a lot more than we did in 2014 (the release of AR5). Our climate is already different compared ti the early or mid-20th century and we’re seeing big changes to mean temperatures, growing season, extreme heat, ocean acidification, and deoxygenation, and Arctic sea ice loss. Expect more changes by mid-century: more rain in the northern hemisphere, less rain in a few regions (the Mediterranean and South Africa), as well as sea-level rise along all coasts. Overall, there is high confidence that mean and extreme temperatures will rise over land and sea. Major widespread damages are expected, but also benefits are possible in some places.
Highlights
🌏Every region of the world will experience concurrent changes in multiple climate impact drivers by mid-century.
🌱Climate change is already resulting in significant societal and environmental impacts and will induce major socio-economic damages in the future. In some cases, climate change can also lead to beneficial conditions which can be taken into account in adaptation strategies.
🌨️The impacts of climate change depend not only on physical changes in the climate itself, but also on whether humans take steps to limit their exposure and vulnerability.
What we did:
The visualization of confidence is only for the executive summary at the beginning of each chapter. If a sentence had a confidence associated with it, the confidence text was removed and a color applied instead. If a sentence did not have an associated confidence, that doesn’t mean scientists do not feel confident about the content; they may be using likelihood (or certainty) language in that instance instead. We chose to only visualize confidence, as it is used more often in the report. Highlights were drawn from the text of the report but edited and in some cases rephrased for clarity.
[Previsão do tempo e previsão de mortes. Observar reação do poder público municipal.]
Se confirmada, a onda de frio será a maior do século, com geada generalizada e temperaturas negativas, o que pode provocar até morte. 25 de julho de 2021
Mapa mostra a intensidade da nova onda de frio e sua abrangência.
A última atualização dos modelos meteorológicos continuam mantendo a previsão de temperaturas negativas nos três Estados do Sul do Brasil e em áreas do Estado de São Paulo e Sul de Minas Gerais. A fortíssima massa de ar polar poderá ser a mais forte do século e causar prejuízos na agricultura e até mesmo morte de pessoas em situação de vulnerabilidade.
A FRENTE FRIA – SUL
A frente fria que antecede a massa polar vai entrar no Brasil pelo Estado do Rio Grande do Sul na segunda-feira, dia 26, provocando chuva e acentuada queda de temperatura. No dia 27, terça-feira, a chuva já chega em Santa Cataria e no Paraná, fazendo a temperatura despencar rapidamente. Nas serras e áreas de planalto dos três Estados, a temperatura mínima já pode chegar a zero grau.
Na quarta, quinta, sexta e sábado, dias 28,29,30 e 31, praticamente todas as regiões do Sul do Brasil, exceto litoral, terão temperaturas negativas com possibilidade de geada negra, que pode matar a vegetação, provocando sérios prejuízos à agricultura.
NEVE
Os modelos meteorológicos mantém a chance alta de neve nas serras do Rio Grande do Sul, Santa Catarina e até mesmo no planalto sul do Paraná, entre a noite de quarta-feira (28) e madrugada de quinta-feira (29), atingindo cidades, tais como: Canela/RS, Caxias do Sul/RS, São Joaquim/SC, Urupema/SC, Caçador/SC e Cruz Machado/PR. Confira o mapa abaixo:
Mapa mostra a região com chance de neve na madrugada de quinta-feira (29).
A FRENTE FRIA – SÃO PAULO
Na quarta-feira, dia 28, é a vez do Estado de São Paulo experimentar a volta da chuva, que não cairá em todas as regiões, mas manterá o céu nublado com ventos gélidos e temperatura máxima entre 17ºC e 18ºC enquanto as mínimas ficarão entre 5ºC a 10ºC na Grande São Paulo.
Na quinta-feira, dia 29, o Estado de São Paulo já vai amanhecer com muito frio. Temperaturas entre 1ºC e 7ºC serão registradas em toda a Grande São Paulo, Vale do Paraíba, Vale do Ribeira, regiões de Sorocaba, Bauru, Presidente Prudente e Campinas, conforme mapa abaixo:
Temperaturas previstas para o amanhecer de quinta-feira, dia 29 de julho, na Grande São Paulo, Vale do Paraíba e Ribeira, regiões de Campinas, Sorocaba, Bauru e Bragança Paulista.
SEXTA-FEIRA – O ‘PICO’ DO FRIO
A sexta-feira, dia 30 de julho de 2021, deverá ficar marcada na história da meteorologia. Se confirmada, será o dia mais frio do século, com geada generalizada no Estado de São Paulo e temperaturas negativas em várias regiões, o que pode provocar a morte de moradores de rua e/ou pessoas em vulnerabilidade.
Em praticamente todas as regiões do Estado de São Paulo, os modelos atuais indicam temperaturas negativas, conforme mapa baixo: (ATENÇÃO: As previsões podem mudar com o passar dos dias, essa é a indicação atual publicada no domingo, dia 25).
Mapa mostra o tamanho da massa de ar frio e temperatura prevista para o dia 30 a 1500 metros de altitude, com inacreditáveis -10ºC em áreas do Sul e faixa leste de São Paulo e até -5ºC nas demais regiões de São Paulo, Rio de Janeiro, sul e leste de Minas, Mato Grosso do Sul, Mato Grosso e Rondônia.
Everywhere from business to medicine to the climate, forecasting the future is a complex and absolutely critical job. So how do you do it—and what comes next?
Bobbie Johnson
February 26, 2020
Inez Fung
Professor of atmospheric science, University of California, Berkeley
Leah Fasten
Prediction for 2030: We’ll light up the world… safely
I’ve spoken to people who want climate model information, but they’re not really sure what they’re asking me for. So I say to them, “Suppose I tell you that some event will happen with a probability of 60% in 2030. Will that be good enough for you, or will you need 70%? Or would you need 90%? What level of information do you want out of climate model projections in order to be useful?”
I joined Jim Hansen’s group in 1979, and I was there for all the early climate projections. And the way we thought about it then, those things are all still totally there. What we’ve done since then is add richness and higher resolution, but the projections are really grounded in the same kind of data, physics, and observations.
Still, there are things we’re missing. We still don’t have a real theory of precipitation, for example. But there are two exciting things happening there. One is the availability of satellite observations: looking at the cloud is still not totally utilized. The other is that there used to be no way to get regional precipitation patterns through history—and now there is. Scientists found these caves in China and elsewhere, and they go in, look for a nice little chamber with stalagmites, and then they chop them up and send them back to the lab, where they do fantastic uranium-thorium dating and measure oxygen isotopes in calcium carbonate. From there they can interpret a record of historic rainfall. The data are incredible: we have got over half a million years of precipitation records all over Asia.
I don’t see us reducing fossil fuels by 2030. I don’t see us reducing CO2 or atmospheric methane. Some 1.2 billion people in the world right now have no access to electricity, so I’m looking forward to the growth in alternative energy going to parts of the world that have no electricity. That’s important because it’s education, health, everything associated with a Western standard of living. That’s where I’m putting my hopes.
Dvora Photography
Anne Lise Kjaer
Futurist, Kjaer Global, London
Prediction for 2030: Adults will learn to grasp new ideas
As a kid I wanted to become an archaeologist, and I did in a way. Archaeologists find artifacts from the past and try to connect the dots and tell a story about how the past might have been. We do the same thing as futurists; we use artifacts from the present and try to connect the dots into interesting narratives in the future.
When it comes to the future, you have two choices. You can sit back and think “It’s not happening to me” and build a great big wall to keep out all the bad news. Or you can build windmills and harness the winds of change.
A lot of companies come to us and think they want to hear about the future, but really it’s just an exercise for them—let’s just tick that box, do a report, and put it on our bookshelf.
So we have a little test for them. We do interviews, we ask them questions; then we use a model called a Trend Atlas that considers both the scientific dimensions of society and the social ones. We look at the trends in politics, economics, societal drivers, technology, environment, legislation—how does that fit with what we know currently? We look back maybe 10, 20 years: can we see a little bit of a trend and try to put that into the future?
What’s next? Obviously with technology we can educate much better than we could in the past. But it’s a huge opportunity to educate the parents of the next generation, not just the children. Kids are learning about sustainability goals, but what about the people who actually rule our world?
Courtesy Photo
Philip Tetlock
Coauthor of Superforecasting and professor, University of Pennsylvania
Prediction for 2030: We’ll get better at being uncertain
At the Good Judgment Project, we try to track the accuracy of commentators and experts in domains in which it’s usually thought impossible to track accuracy. You take a big debate and break it down into a series of testable short-term indicators. So you could take a debate over whether strong forms of artificial intelligence are going to cause major dislocations in white-collar labor markets by 2035, 2040, 2050. A lot of discussion already occurs at that level of abstraction—but from our point of view, it’s more useful to break it down and to say: If we were on a long-term trajectory toward an outcome like that, what sorts of things would we expect to observe in the short term? So we started this off in 2015, and in 2016 AlphaGo defeated people in Go. But then other things didn’t happen: driverless Ubers weren’t picking people up for fares in any major American city at the end of 2017. Watson didn’t defeat the world’s best oncologists in a medical diagnosis tournament. So I don’t think we’re on a fast track toward the singularity, put it that way.
Forecasts have the potential to be either self-fulfilling or self-negating—Y2K was arguably a self-negating forecast. But it’s possible to build that into a forecasting tournament by asking conditional forecasting questions: i.e., How likely is X conditional on our doing this or doing that?
What I’ve seen over the last 10 years, and it’s a trend that I expect will continue, is an increasing openness to the quantification of uncertainty. I think there’s a grudging, halting, but cumulative movement toward thinking about uncertainty, and more granular and nuanced ways that permit keeping score.
Ryan Young
Keith Chen
Associate professor of economics, UCLA
Prediction for 2030: We’ll be more—and less—private
When I worked on Uber’s surge pricing algorithm, the problem it was built to solve was very coarse: we were trying to convince drivers to put in extra time when they were most needed. There were predictable times—like New Year’s—when we knew we were going to need a lot of people. The deeper problem was that this was a system with basically no control. It’s like trying to predict the weather. Yes, the amount of weather data that we collect today—temperature, wind speed, barometric pressure, humidity data—is 10,000 times greater than what we were collecting 20 years ago. But we still can’t predict the weather 10,000 times further out than we could back then. And social movements—even in a very specific setting, such as where riders want to go at any given point in time—are, if anything, even more chaotic than weather systems.
These days what I’m doing is a little bit more like forensic economics. We look to see what we can find and predict from people’s movement patterns. We’re just using simple cell-phone data like geolocation, but even just from movement patterns, we can infer salient information and build a psychological dimension of you. What terrifies me is I feel like I have much worse data than Facebook does. So what are they able to understand with their much better information?
I think the next big social tipping point is people actually starting to really care about their privacy. It’ll be like smoking in a restaurant: it will quickly go from causing outrage when people want to stop it to suddenly causing outrage if somebody does it. But at the same time, by 2030 almost every Chinese citizen will be completely genotyped. I don’t quite know how to reconcile the two.
Sarah Deragon
Annalee Newitz
Science fiction and nonfiction author, San Francisco
Prediction for 2030: We’re going to see a lot more humble technology
Every era has its own ideas about the future. Go back to the 1950s and you’ll see that people fantasized about flying cars. Now we imagine bicycles and green cities where cars are limited, or where cars are autonomous. We have really different priorities now, so that works its way into our understanding of the future.
Science fiction writers can’t actually make predictions. I think of science fiction as engaging with questions being raised in the present. But what we can do, even if we can’t say what’s definitely going to happen, is offer a range of scenarios informed by history.
There are a lot of myths about the future that people believe are going to come true right now. I think a lot of people—not just science fiction writers but people who are working on machine learning—believe that relatively soon we’re going to have a human-equivalent brain running on some kind of computing substrate. This is as much a reflection of our time as it is what might actually happen.
It seems unlikely that a human-equivalent brain in a computer is right around the corner. But we live in an era where a lot of us feel like we live inside computers already, for work and everything else. So of course we have fantasies about digitizing our brains and putting our consciousness inside a machine or a robot.
I’m not saying that those things could never happen. But they seem much more closely allied to our fantasies in the present than they do to a real technical breakthrough on the horizon.
We’re going to have to develop much better technologies around disaster relief and emergency response, because we’ll be seeing a lot more floods, fires, storms. So I think there is going to be a lot more work on really humble technologies that allow you to take your community off the grid, or purify your own water. And I don’t mean in a creepy survivalist way; I mean just in a this-is-how-we-are-living-now kind of way.
Noah Willman
Finale Doshi-Velez
Associate professor of computer science, Harvard
Prediction for 2030: Humans and machines will make decisions together
In my lab, we’re trying to answer questions like “How might this patient respond to this antidepressant?” or “How might this patient respond to this vasopressor?” So we get as much data as we can from the hospital. For a psychiatric patient, we might have everything about their heart disease, kidney disease, cancer; for a blood pressure management recommendation for the ICU, we have all their oxygen information, their lactate, and more.
Some of it might be relevant to making predictions about their illnesses, some not, and we don’t know which is which. That’s why we ask for the large data set with everything.
There’s been about a decade of work trying to get unsupervised machine-learning models to do a better job at making these predictions, and none worked really well. The breakthrough for us was when we found that all the previous approaches for doing this were wrong in the exact same way. Once we untangled all of this, we came up with a different method.
We also realized that even if our ability to predict what drug is going to work is not always that great, we can more reliably predict what drugs are not going to work, which is almost as valuable.
I’m excited about combining humans and AI to make predictions. Let’s say your AI has an error rate of 70% and your human is also only right 70% of the time. Combining the two is difficult, but if you can fuse their successes, then you should be able to do better than either system alone. How to do that is a really tough, exciting question.
All these predictive models were built and deployed and people didn’t think enough about potential biases. I’m hopeful that we’re going to have a future where these human-machine teams are making decisions that are better than either alone.
Guillaume Simoneau
Abdoulaye Banire Diallo
Professor, director of the bioinformatics lab, University of Quebec at Montreal
Prediction for 2030: Machine-based forecasting will be regulated
When a farmer in Quebec decides whether to inseminate a cow or not, it might depend on the expectation of milk that will be produced every day for one year, two years, maybe three years after that. Farms have management systems that capture the data and the environment of the farm. I’m involved in projects that add a layer of genetic and genomic data to help forecasting—to help decision makers like the farmer to have a full picture when they’re thinking about replacing cows, improving management, resilience, and animal welfare.
With the emergence of machine learning and AI, what we’re showing is that we can help tackle problems in a way that hasn’t been done before. We are adapting it to the dairy sector, where we’ve shown that some decisions can be anticipated 18 months in advance just by forecasting based on the integration of this genomic data. I think in some areas such as plant health we have only achieved 10% or 20% of our capacity to improve certain models.
Until now AI and machine learning have been associated with domain expertise. It’s not a public-wide thing. But less than 10 years from now they will need to be regulated. I think there are a lot of challenges for scientists like me to try to make those techniques more explainable, more transparent, and more auditable.
Machine-learning systems can be duped or confounded by situations they haven’t seen before. A self-driving car gets flummoxed by a scenario that a human driver could handle easily. An AI system laboriously trained to carry out one task (identifying cats, say) has to be taught all over again to do something else (identifying dogs). In the process, it’s liable to lose some of the expertise it had in the original task. Computer scientists call this problem “catastrophic forgetting.”
These shortcomings have something in common: they exist because AI systems don’t understand causation. They see that some events are associated with other events, but they don’t ascertain which things directly make other things happen. It’s as if you knew that the presence of clouds made rain likelier, but you didn’t know clouds caused rain.
Elias Bareinboim: AI systems are clueless when it comes to causation.
Understanding cause and effect is a big aspect of what we call common sense, and it’s an area in which AI systems today “are clueless,” says Elias Bareinboim. He should know: as the director of the new Causal Artificial Intelligence Lab at Columbia University, he’s at the forefront of efforts to fix this problem.
His idea is to infuse artificial-intelligence research with insights from the relatively new science of causality, a field shaped to a huge extent by Judea Pearl, a Turing Award–winning scholar who considers Bareinboim his protégé.
As Bareinboim and Pearl describe it, AI’s ability to spot correlations—e.g., that clouds make rain more likely—is merely the simplest level of causal reasoning. It’s good enough to have driven the boom in the AI technique known as deep learning over the past decade. Given a great deal of data about familiar situations, this method can lead to very good predictions. A computer can calculate the probability that a patient with certain symptoms has a certain disease, because it has learned just how often thousands or even millions of other people with the same symptoms had that disease.
But there’s a growing consensus that progress in AI will stall if computers don’t get better at wrestling with causation. If machines could grasp that certain things lead to other things, they wouldn’t have to learn everything anew all the time—they could take what they had learned in one domain and apply it to another. And if machines could use common sense we’d be able to put more trust in them to take actions on their own, knowing that they aren’t likely to make dumb errors.
Today’s AI has only a limited ability to infer what will result from a given action. In reinforcement learning, a technique that has allowed machines to master games like chess and Go, a system uses extensive trial and error to discern which moves will essentially cause them to win. But this approach doesn’t work in messier settings in the real world. It doesn’t even leave a machine with a general understanding of how it might play other games.
An even higher level of causal thinking would be the ability to reason about why things happened and ask “what if” questions. A patient dies while in a clinical trial; was it the fault of the experimental medicine or something else? School test scores are falling; what policy changes would most improve them? This kind of reasoning is far beyond the current capability of artificial intelligence.
Performing miracles
The dream of endowing computers with causal reasoning drew Bareinboim from Brazil to the United States in 2008, after he completed a master’s in computer science at the Federal University of Rio de Janeiro. He jumped at an opportunity to study under Judea Pearl, a computer scientist and statistician at UCLA. Pearl, 83, is a giant—the giant—of causal inference, and his career helps illustrate why it’s hard to create AI that understands causality.
Even well-trained scientists are apt to misinterpret correlations as signs of causation—or to err in the opposite direction, hesitating to call out causation even when it’s justified. In the 1950s, for example, a few prominent statisticians muddied the waters around whether tobacco caused cancer. They argued that without an experiment randomly assigning people to be smokers or nonsmokers, no one could rule out the possibility that some unknown—stress, perhaps, or some gene—caused people both to smoke and to get lung cancer.
Eventually, the fact that smoking causes cancer was definitively established, but it needn’t have taken so long. Since then, Pearl and other statisticians have devised a mathematical approach to identifying what facts would be required to support a causal claim. Pearl’s method shows that, given the prevalence of smoking and lung cancer, an independent factor causing both would be extremely unlikely.
Conversely, Pearl’s formulas also help identify when correlations can’t be used to determine causation. Bernhard Schölkopf, who researches causal AI techniques as a director at Germany’s Max Planck Institute for Intelligent Systems, points out that you can predict a country’s birth rate if you know its population of storks. That isn’t because storks deliver babies or because babies attract storks, but probably because economic development leads to more babies and more storks. Pearl has helped give statisticians and computer scientists ways of attacking such problems, Schölkopf says.
Judea Pearl: His theory of causal reasoning has transformed science.
Pearl’s work has also led to the development of causal Bayesian networks—software that sifts through large amounts of data to detect which variables appear to have the most influence on other variables. For example, GNS Healthcare, a company in Cambridge, Massachusetts, uses these techniques to advise researchers about experiments that look promising.
In one project, GNS worked with researchers who study multiple myeloma, a kind of blood cancer. The researchers wanted to know why some patients with the disease live longer than others after getting stem-cell transplants, a common form of treatment. The software churned through data with 30,000 variables and pointed to a few that seemed especially likely to be causal. Biostatisticians and experts in the disease zeroed in on one in particular: the level of a certain protein in patients’ bodies. Researchers could then run a targeted clinical trial to see whether patients with the protein did indeed benefit more from the treatment. “It’s way faster than poking here and there in the lab,” says GNS cofounder Iya Khalil.
Nonetheless, the improvements that Pearl and other scholars have achieved in causal theory haven’t yet made many inroads in deep learning, which identifies correlations without too much worry about causation. Bareinboim is working to take the next step: making computers more useful tools for human causal explorations.
Pearl says AI can’t be truly intelligent until it has a rich understanding of cause and effect, which would enable the introspection that is at the core of cognition.
One of his systems, which is still in beta, can help scientists determine whether they have sufficient data to answer a causal question. Richard McElreath, an anthropologist at the Max Planck Institute for Evolutionary Anthropology, is using the software to guide research into why humans go through menopause (we are the only apes that do).
The hypothesis is that the decline of fertility in older women benefited early human societies because women who put more effort into caring for grandchildren ultimately had more descendants. But what evidence might exist today to support the claim that children do better with grandparents around? Anthropologists can’t just compare the educational or medical outcomes of children who have lived with grandparents and those who haven’t. There are what statisticians call confounding factors: grandmothers might be likelier to live with grandchildren who need the most help. Bareinboim’s software can help McElreath discern which studies about kids who grew up with their grandparents are least riddled with confounding factors and could be valuable in answering his causal query. “It’s a huge step forward,” McElreath says.
The last mile
Bareinboim talks fast and often gestures with two hands in the air, as if he’s trying to balance two sides of a mental equation. It was halfway through the semester when I visited him at Columbia in October, but it seemed as if he had barely moved into his office—hardly anything on the walls, no books on the shelves, only a sleek Mac computer and a whiteboard so dense with equations and diagrams that it looked like a detail from a cartoon about a mad professor.
He shrugged off the provisional state of the room, saying he had been very busy giving talks about both sides of the causal revolution. Bareinboim believes work like his offers the opportunity not just to incorporate causal thinking into machines, but also to improve it in humans.
Getting people to think more carefully about causation isn’t necessarily much easier than teaching it to machines, he says. Researchers in a wide range of disciplines, from molecular biology to public policy, are sometimes content to unearth correlations that are not actually rooted in causal relationships. For instance, some studies suggest drinking alcohol will kill you early, while others indicate that moderate consumption is fine and even beneficial, and still other research has found that heavy drinkers outlive nondrinkers. This phenomenon, known as the “reproducibility crisis,” crops up not only in medicine and nutrition but also in psychology and economics. “You can see the fragility of all these inferences,” says Bareinboim. “We’re flipping results every couple of years.”
He argues that anyone asking “what if”—medical researchers setting up clinical trials, social scientists developing pilot programs, even web publishers preparing A/B tests—should start not merely by gathering data but by using Pearl’s causal logic and software like Bareinboim’s to determine whether the available data could possibly answer a causal hypothesis. Eventually, he envisions this leading to “automated scientist” software: a human could dream up a causal question to go after, and the software would combine causal inference theory with machine-learning techniques to rule out experiments that wouldn’t answer the question. That might save scientists from a huge number of costly dead ends.
Bareinboim described this vision while we were sitting in the lobby of MIT’s Sloan School of Management, after a talk he gave last fall. “We have a building here at MIT with, I don’t know, 200 people,” he said. How do those social scientists, or any scientists anywhere, decide which experiments to pursue and which data points to gather? By following their intuition: “They are trying to see where things will lead, based on their current understanding.”
That’s an inherently limited approach, he said, because human scientists designing an experiment can consider only a handful of variables in their minds at once. A computer, on the other hand, can see the interplay of hundreds or thousands of variables. Encoded with “the basic principles” of Pearl’s causal calculus and able to calculate what might happen with new sets of variables, an automated scientist could suggest exactly which experiments the human researchers should spend their time on. Maybe some public policy that has been shown to work only in Texas could be made to work in California if a few causally relevant factors were better appreciated. Scientists would no longer be “doing experiments in the darkness,” Bareinboim said.
He also doesn’t think it’s that far off: “This is the last mile before the victory.”
What if?
Finishing that mile will probably require techniques that are just beginning to be developed. For example, Yoshua Bengio, a computer scientist at the University of Montreal who shared the 2018 Turing Award for his work on deep learning, is trying to get neural networks—the software at the heart of deep learning—to do “meta-learning” and notice the causes of things.
As things stand now, if you wanted a neural network to detect when people are dancing, you’d show it many, many images of dancers. If you wanted it to identify when people are running, you’d show it many, many images of runners. The system would learn to distinguish runners from dancers by identifying features that tend to be different in the images, such as the positions of a person’s hands and arms. But Bengio points out that fundamental knowledge about the world can be gleaned by analyzing the things that are similar or “invariant” across data sets. Maybe a neural network could learn that movements of the legs physically cause both running and dancing. Maybe after seeing these examples and many others that show people only a few feet off the ground, a machine would eventually understand something about gravity and how it limits human movement. Over time, with enough meta-learning about variables that are consistent across data sets, a computer could gain causal knowledge that would be reusable in many domains.
For his part, Pearl says AI can’t be truly intelligent until it has a rich understanding of cause and effect. Although causal reasoning wouldn’t be sufficient for an artificial general intelligence, it’s necessary, he says, because it would enable the introspection that is at the core of cognition. “What if” questions “are the building blocks of science, of moral attitudes, of free will, of consciousness,” Pearl told me.
You can’t draw Pearl into predicting how long it will take for computers to get powerful causal reasoning abilities. “I am not a futurist,” he says. But in any case, he thinks the first move should be to develop machine-learning tools that combine data with available scientific knowledge: “We have a lot of knowledge that resides in the human skull which is not utilized.”
Brian Bergstein, a former editor at MIT Technology Review, is deputy opinion editor at the Boston Globe.
Todos os anos, os chamados profetas da chuva do interior do Ceará se reúnem para divulgar suas previsões para a quadra chuvosa na região —período que geralmente vai de janeiro a junho e é crucial para o sustento das famílias de pequenos agricultores locais. Com a pandemia do novo coronavírus, no entanto, até eles tiveram de aderir ao “trabalho remoto”.
Os profetas são nordestinos que dizem antever as chuvas no semiárido observando sinais da natureza, como a floração de determinadas plantas, o comportamento de pássaros ou o movimento dos insetos. Para alguns deles, por exemplo, se o joão-de-barro não estiver no ninho é sinal de chuva.
“A formiga é o bicho mais inteligente que existe”, define o agricultor Titico Báia, de 69 anos e há 35 como profeta. “Elas começam a limpar o formigueiro no verão e jogam o bagaço seco fora. Dali a 90 dias, a chuva vem. Quando o sapo cururu se prepara para começar a cantar, também é sinal de água.”
Báia é conhecido por observar a natureza principalmente em três dias de setembro e três em outubro. O comportamento de animais, do vento e da lua nesses dias ajuda a prever como será a chuva no primeiro semestre do ano seguinte. “A gente vive da safra de milho e de feijão. E a regularidade da chuva é o que define se a vida vai ser mais fácil ou mais difícil naquele ano. Em 2021, a chuva só não foi mais esperada do que a vacina.”
“Em uma época em que não tínhamos medições regulares na nossa região, essas mulheres e esses homens eram a bússola para os agricultores. Eles diziam a hora certa de plantar e ajudavam a garantir uma colheita melhor”, conta o diretor do Instituto Federal do Ceará (IFCE) de Tauá (337 km de Fortaleza), José Alves Neto. Ele é um dos organizadores do encontro dos profetas da chuva da região do sertão dos Inhamuns, que acontece há cinco anos. “Mesmo hoje, os órgãos que medem as chuvas escutam o que os profetas têm a dizer.”
Com a pandemia da Covid-19, no entanto, esse grupo de observadores da natureza, que faz recomendações do melhor dia de plantio e estimativas de como será o inverno do ano, não pôde se reunir, já que a maioria tem mais de 60 anos e faz parte do grupo de risco.
Para manter a tradição, os profetas populares se adaptaram e promoveram os primeiros encontros virtuais, com transmissões de profecias pela internet, aumento das parcerias com rádios locais e trocas de previsões com outros agricultores pelo WhatsApp. A tecnologia, que chegou a ser vista como rival da tradição popular, agora ajuda os observadores da natureza a continuarem em atividade.
Quem espera a vacina para voltar a circular pela região é o agricultor Totonho Alves, 64. Ele, que herdou a sensibilidade para observar a natureza do pai e do avô, começou a notar o trabalho das formigas e outros sinais há 40 anos. “Meu avô sempre dizia que a chuva estava para vir quando via as formigas trabalhando mais do que o normal. Foi ele quem me ensinou que vinha enchente quando a coruja cantava na beira do riacho.”
Alves conta que as formigas poucas vezes erraram com ele. Quando elas saem das terras mais baixas e se mudam para o alto é sinal de chuva. Mas, se o formigueiro estiver na beira dos riachos, não é bom sinal. “Sinto falta do encontro presencial, daquele movimento, de poder reencontrar os amigos e trocar previsões. Mas com a pandemia, a gente faz o que pode”, diz.
O encontro mais antigo do estado começou em 1997, na região de Quixadá, a 164 km de Fortaleza. Na época, o funcionário da Companhia de Água e Esgoto do Ceará (Cagece) Hélder Cortez se deu conta de que havia um número cada vez maior de interessados em ouvir os agricultores que alertavam sobre as chuvas. Hoje, são 22 profetas na região do município.
Ano passado, antes da pandemia, 400 pessoas se reuniram em um auditório em Quixadá. “Este ano, pela internet, tanta gente se interessou pelos profetas que surgiram várias ideias para que essa cultura não se perca. Com o fim da pandemia, a gente pretende criar uma escola de formação de profetas, em parceria com instituições locais”, diz Cortez.
A audiência online animou os profetas e alguns municípios querem manter os encontros virtuais mesmo após a vacina. O evento no sertão dos Inhamuns, por exemplo, que chegava a reunir até 90 pessoas em auditórios de escolas da região quando era presencial, já tem mais de 3.000 visualizações no canal oficial no YouTube.
O diretor do IFCE de Boa Viagem, no Sertão de Canindé, João Paulo Arcelino do Rêgo, que organizou algumas das gravações das profecias virtuais, conta que a maioria dos profetas não tem acesso regular à internet e acaba não trocando previsões ao longo do ano. Os encontros presenciais sempre foram a oportunidade para isso.
“Este ano, levamos uma equipe de filmagem até a casa de cada um deles, fizemos os vídeos e o evento aumentou de tamanho. O mais surpreendente é que as previsões batiam, mesmo sem eles conversarem antes. Não é por acaso que muitos engenheiros agrônomos da região nos telefonam para saber o que os profetas têm a dizer”, diz ele.
“Quando eles viram que a pandemia se arrastaria em 2021 também e que as reuniões seriam prejudicadas, foram os primeiros a cobrar uma solução. São pessoas que tiram o sustento da terra e que são profetas por vocação, sem ganhar nada com isso. Para eles, repassar as previsões é a forma de manter viva a tradição”, diz Neto.
Outra expectativa é a de que a tecnologia também sirva para atrair mais jovens interessados em aprender sobre as técnicas de observação da natureza, já que a transmissão desse conhecimento para as novas gerações é fonte constante de preocupação do grupo.
“A nossa intenção é repassar o conhecimento para as outras gerações. Minha esperança é um dos meus filhos mais novos, que é quem eu levo para observar a natureza comigo. Quando eu vier a faltar, é ele quem vai levar a história para frente”, diz Alves.
[Linking solar activity to the onset of droughts in places like Northeast Brazil has historically been treated as something that did not deserve attention by mainstream meteorology. The El Niño Southern Oscillation – of which La Niña is part – was always presented as the main causal factor for droughts. This new study connects solar activity with the La Niña. The interesting thing here is that many local farmers seen as knowledgeable about rains and drought in NE Brazil mention a 10 years period for the repetition of climate events. -RT]
Date: April 5, 2021
Source: National Center for Atmospheric Research/University Corporation for Atmospheric Research
Summary: A new study shows a correlation between the end of solar cycles and a switch from El Nino to La Nina conditions in the Pacific Ocean, suggesting that solar variability can drive seasonal weather variability on Earth.
A new study shows a correlation between the end of solar cycles and a switch from El Nino to La Nina conditions in the Pacific Ocean, suggesting that solar variability can drive seasonal weather variability on Earth.
If the connection outlined in the journal Earth and Space Science holds up, it could significantly improve the predictability of the largest El Nino and La Nina events, which have a number of seasonal climate effects over land. For example, the southern United States tends to be warmer and drier during a La Nina, while the northern U.S. tends to be colder and wetter.
“Energy from the Sun is the major driver of our entire Earth system and makes life on Earth possible,” said Scott McIntosh, a scientist at the National Center for Atmospheric Research (NCAR) and co-author of the paper. “Even so, the scientific community has been unclear on the role that solar variability plays in influencing weather and climate events here on Earth. This study shows there’s reason to believe it absolutely does and why the connection may have been missed in the past.”
The study was led by Robert Leamon at the University of Maryland-Baltimore County, and it is also co-authored by Daniel Marsh at NCAR. The research was funded by the National Science Foundation, which is NCAR’s sponsor, and the NASA Living With a Star program.
Applying a new solar clock
The appearance (and disappearance) of spots on the Sun — the outwardly visible signs of solar variability — have been observed by humans for hundreds of years. The waxing and waning of the number of sunspots takes place over approximately 11-year cycles, but these cycles do not have distinct beginnings and endings. This fuzziness in the length of any particular cycle has made it challenging for scientists to match up the 11-year cycle with changes happening on Earth.
In the new study, the researchers rely on a more precise 22-year “clock” for solar activity derived from the Sun’s magnetic polarity cycle, which they outlined as a more regular alternative to the 11-year solar cycle in several companion studies published recently in peer-reviewed journals.
The 22-year cycle begins when oppositely charged magnetic bands that wrap the Sun appear near the star’s polar latitudes, according to their recent studies. Over the cycle, these bands migrate toward the equator — causing sunspots to appear as they travel across the mid-latitudes. The cycle ends when the bands meet in the middle, mutually annihilating one another in what the research team calls a terminator event. These terminators provide precise guideposts for the end of one cycle and the beginning of the next.
The researchers imposed these terminator events over sea surface temperatures in the tropical Pacific stretching back to 1960. They found that the five terminator events that occurred between that time and 2010-11 all coincided with a flip from an El Nino (when sea surface temperatures are warmer than average) to a La Nina (when the sea surface temperatures are cooler than average). The end of the most recent solar cycle — which is unfolding now — is also coinciding with the beginning of a La Nina event.
“We are not the first scientists to study how solar variability may drive changes to the Earth system,” Leamon said. “But we are the first to apply the 22-year solar clock. The result — five consecutive terminators lining up with a switch in the El Nino oscillation — is not likely to be a coincidence.”
In fact, the researchers did a number of statistical analyses to determine the likelihood that the correlation was just a fluke. They found there was only a 1 in 5,000 chance or less (depending on the statistical test) that all five terminator events included in the study would randomly coincide with the flip in ocean temperatures. Now that a sixth terminator event — and the corresponding start of a new solar cycle in 2020 — has also coincided with an La Nina event, the chance of a random occurrence is even more remote, the authors said.
The paper does not delve into what physical connection between the Sun and Earth could be responsible for the correlation, but the authors note that there are several possibilities that warrant further study, including the influence of the Sun’s magnetic field on the amount of cosmic rays that escape into the solar system and ultimately bombard Earth. However, a robust physical link between cosmic rays variations and climate has yet to be determined.
“If further research can establish that there is a physical connection and that changes on the Sun are truly causing variability in the oceans, then we may be able to improve our ability to predict El Nino and La Nina events,” McIntosh said.
Robert J. Leamon, Scott W. McIntosh, Daniel R. Marsh. Termination of Solar Cycles and Correlated Tropospheric Variability. Earth and Space Science, 2021; 8 (4) DOI: 10.1029/2020EA001223
Em seu novo livro Como evitar um desastre climático, Bill Gates adota uma abordagem tecnológica para compreender a crise climática. Gates começa com os 51 bilhões de toneladas de gases com efeito de estufa criados por ano. Ele divide essa poluição em setores com base em seu impacto, passando pelo elétrico, industrial e agrícola para o de transporte e construção civil. Do começo ao fim, Gates se mostra adepto a diminuir as complexidades do desafio climático, dando ao leitor heurísticas úteis para distinguir maiores problemas tecnológicos (cimento) de menores (aeronaves).
Presente nas negociações climáticas de Paris em 2015, Gates e dezenas de indivíduos bem-afortunados lançaram o Breakthrough Energy, um fundo de capital de investimento interdependente lobista empenhado em conduzir pesquisas. Gates e seus companheiros investidores argumentaram que tanto o governo federal quanto o setor privado estão investindo pouco em inovação energética. A Breakthrough pretende preencher esta lacuna, investindo em tudo, desde tecnologia nuclear da próxima geração até carne vegetariana com sabor de carne bovina. A primeira rodada de US$ 1 bilhão do fundo de investimento teve alguns sucessos iniciais, como a Impossible Foods, uma fabricante de hambúrgueres à base de plantas. O fundo anunciou uma segunda rodada de igual tamanho em janeiro.
Um esforço paralelo, um acordo internacional chamado de Mission Innovation, diz ter convencido seus membros (o setor executivo da União Europeia junto com 24 países incluindo China, os EUA, Índia e o Brasil) a investirem um adicional de US$ 4,6 bilhões por ano desde 2015 para a pesquisa e desenvolvimento da energia limpa.
Essas várias iniciativas são a linha central para o livro mais recente de Gates, escrito a partir de uma perspectiva tecno-otimista. “Tudo que aprendi a respeito do clima e tecnologia me deixam otimista… se agirmos rápido o bastante, [podemos] evitar uma catástrofe climática,” ele escreveu nas páginas iniciais.
Como muitos já assinalaram, muito da tecnologia necessária já existe, muito pode ser feito agora. Por mais que Gates não conteste isso, seu livro foca nos desafios tecnológicos que ele acredita que ainda devem ser superados para atingir uma maior descarbonização. Ele gasta menos tempo nos percalços políticos, escrevendo que pensa “mais como um engenheiro do que um cientista político.” Ainda assim, a política, com toda a sua desordem, é o principal impedimento para o progresso das mudanças climáticas. E engenheiros devem entender como sistemas complexos podem ter ciclos de feedback que dão errado.
Sim, ministro
Kim Stanley Robinson, este sim pensa como um cientista político. O começo de seu romance mais recente The Ministry for the Future (ainda sem tradução para o português), se passa apenas a alguns anos no futuro, em 2025, quando uma onda de calor imensa atinge a Índia, matando milhões de pessoas. A protagonista do livro, Mary Murphy, comanda uma agência da ONU designada a representar os interesses das futuras gerações em uma tentativa de unir os governos mundiais em prol de uma solução climática. Durante todo o livro a equidade intergeracional e várias formas de políticas distributivas em foco.
Se você já viu os cenários que o Painel Intergovernamental sobre Mudanças Climáticas (IPCC) desenvolve para o futuro, o livro de Robinson irá parecer familiar. Sua história questiona as políticas necessárias para solucionar a crise climática, e ele certamente fez seu dever de casa. Apesar de ser um exercício de imaginação, há momentos em que o romance se assemelha mais a um seminário de graduação sobre ciências sociais do que a um trabalho de ficção escapista. Os refugiados climáticos, que são centrais para a história, ilustram a forma como as consequências da poluição atingem a população global mais pobre com mais força. Mas os ricos produzem muito mais carbono.
Ler Gates depois de Robinson evidencia a inextricável conexão entre desigualdade e mudanças climáticas. Os esforços de Gates sobre a questão do clima são louváveis. Mas quando ele nos diz que a riqueza combinada das pessoas apoiando seu fundo de investimento é de US$ 170 bilhões, ficamos um pouco intrigados que estes tenham dedicado somente US$ 2 bilhões para soluções climáticas, menos de 2% de seus ativos. Este fato por si só é um argumento favorável para taxar fortunas: a crise climática exige ação governamental. Não pode ser deixado para o capricho de bilionários.
Quanto aos bilionários, Gates é possivelmente um dos bonzinhos. Ele conta histórias sobre como usa sua fortuna para ajudar os pobres e o planeta. A ironia dele escrever um livro sobre mudanças climáticas quando voa em um jato particular e detém uma mansão de 6.132 m² não é algo que passa despercebido pelo leitor, e nem por Gates, que se autointitula um “mensageiro imperfeito sobre mudanças climáticas”. Ainda assim, ele é inquestionavelmente um aliado do movimento climático.
Mas ao focar em inovações tecnológicas, Gates minimiza a participação dos combustíveis fósseis na obstrução deste progresso. Peculiarmente, o ceticismo climático não é mencionado no livro. Lavando as mãos no que diz respeito à polarização política, Gates nunca faz conexão com seus colegas bilionários Charles e David Koch, que enriqueceram com os petroquímicos e têm desempenhado papel de destaque na reprodução do negacionismo climático.
Por exemplo, Gates se admira que para a vasta maioria dos americanos aquecedores elétricos são na verdade mais baratos do que continuar a usar combustíveis fósseis. Para ele, as pessoas não adotarem estas opções mais econômicas e sustentáveis é um enigma. Mas, não é assim. Como os jornalistas Rebecca Leber e Sammy Roth reportaram em Mother Jones e no Los Angeles Times, a indústria do gás está investindo em defensores e criando campanhas de marketing para se opor à eletrificação e manter as pessoas presas aos combustíveis fósseis.
Essas forças de oposição são melhor vistas no livro do Robinson do que no de Gates. Gates teria se beneficiado se tivesse tirado partido do trabalho que Naomi Oreskes, Eric Conway, Geoffrey Supran, entre outros, têm feito para documentar os esforços persistentes das empresas de combustíveis fósseis em semear dúvida sobre a ciência climática para a população.
No entanto, uma coisa que Gates e Robinson têm em comum é a opinião de que a geoengenharia, intervenções monumentais para combater os sintomas ao invés das causas das mudanças climáticas, venha a ser inevitável. Em The Ministry for the Future, a geoengenharia solar, que vem a ser a pulverização de partículas finas na atmosfera para refletir mais do calor solar de volta para o espaço, é usada na sequência dos acontecimentos da onda de calor mortal que inicia a história. E mais tarde, alguns cientistas vão aos polos e inventam elaborados métodos para remover água derretida de debaixo de geleiras para evitar que avançasse para o mar. Apesar de alguns contratempos, eles impedem a subida do nível do mar em vários metros. É possível imaginar Gates aparecendo no romance como um dos primeiros a financiar estes esforços. Como ele próprio observa em seu livro, ele tem investido em pesquisa sobre geoengenharia solar há anos.
A pior parte
O título do novo livro de Elizabeth Kolbert, Under a White Sky (ainda sem tradução para o português), é uma referência a esta tecnologia nascente, já que implementá-la em larga escala pode alterar a cor do céu de azul para branco. Kolbert observa que o primeiro relatório sobre mudanças climáticas foi parar na mesa do presidente Lyndon Johnson em 1965. Este relatório não argumentava que deveríamos diminuir as emissões de carbono nos afastando de combustíveis fósseis. No lugar, defendia mudar o clima por meio da geoengenharia solar, apesar do termo ainda não ter sido inventado. É preocupante que alguns se precipitem imediatamente para essas soluções arriscadas em vez de tratar a raiz das causas das mudanças climáticas.
Ao ler Under a White Sky, somos lembrados das formas com que intervenções como esta podem dar errado. Por exemplo, a cientista e escritora Rachel Carson defendeu importar espécies não nativas como uma alternativa a utilizar pesticidas. No ano após o seu livro Primavera Silenciosa ser publicado, em 1962, o US Fish and Wildlife Service trouxe carpas asiáticas para a América pela primeira vez, a fim de controlar algas aquáticas. Esta abordagem solucionou um problema, mas criou outro: a disseminação dessa espécie invasora ameaçou às locais e causou dano ambiental.
Como Kolbert observa, seu livro é sobre “pessoas tentando solucionar problemas criados por pessoas tentando solucionar problemas.” Seu relato cobre exemplos incluindo esforços malfadados de parar a disseminação das carpas, as estações de bombeamento em Nova Orleans que aceleram o afundamento da cidade e as tentativas de seletivamente reproduzir corais que possam tolerar temperaturas mais altas e a acidificação do oceano. Kolbert tem senso de humor e uma percepção aguçada para consequências não intencionais. Se você gosta do seu apocalipse com um pouco de humor, ela irá te fazer rir enquanto Roma pega fogo.
Em contraste, apesar de Gates estar consciente das possíveis armadilhas das soluções tecnológicas, ele ainda enaltece invenções como plástico e fertilizante como vitais. Diga isso para as tartarugas marinhas engolindo lixo plástico ou as florações de algas impulsionadas por fertilizantes destruindo o ecossistema do Golfo do México.
Com níveis perigosos de dióxido de carbono na atmosfera, a geoengenharia pode de fato se provar necessária, mas não deveríamos ser ingênuos sobre os riscos. O livro de Gates tem muitas ideias boas e vale a pena a leitura. Mas para um panorama completo da crise que enfrentamos, certifique-se de também ler Robinson e Kolbert.
O florescer das famosas cerejeiras brancas e rosas leva milhares às ruas e parques do Japão para observar o fenômeno, que dura poucos dias e é reverenciado há mais de mil anos. Mas este ano a antecipação da florada tem preocupado cientistas, pois indica impacto nas mudanças climáticas.
Segundo registros da Universidade da Prefeitura de Osaka, em 2021, as famosas cerejeiras brancas e rosas floresceram totalmente em 26 de março em Quioto, a data mais antecipada em 12 séculos. As floradas mais cedo foram registradas em 27 de março dos anos 1612, 1409 e 1236.
A instituição conseguiu identificar a antecipação do fenômeno porque tem um banco de dados completo dos registros das floradas ao longo dos séculos. Os registros começaram no ano 812 e incluem documentos judiciais da Quioto Imperial, a antiga capital do Japão e diários medievais.
O professor de ciência ambiental da universidade da Prefeitura de Osaka, Yasuyuki Aono, responsável por compilar um banco de dados, disse à Agência Reuters que o fenômeno costuma ocorrer em abril, mas à medida que as temperaturas sobem, o início da floração é mais cedo.
Kazuhiro Nogui, 24.mar.2021/AFP
“As flores de cerejeira são muito sensíveis à temperatura. A floração e a plena floração podem ocorrer mais cedo ou mais tarde, dependendo apenas da temperatura. A temperatura era baixa na década de 1820, mas subiu cerca de 3,5 graus Celsius até hoje”, disse.
Segundo ele, as estações deste ano, em particular, influenciaram as datas de floração. O inverno foi muito frio, mas a primavera veio rápida e excepcionalmente quente, então “os botões estão completamente despertos depois de um descanso suficiente”.
Na capital Tóquio, as cerejeiras atingiram o máximo da florada em 22 de março, o segundo ano mais cedo já registrado. “À medida que as temperaturas globais aumentam, as geadas da última Primavera estão ocorrendo mais cedo e a floração está ocorrendo mais cedo”, afirmou Lewis Ziska, da Universidade de Columbia, à CNN.
A Agência Meteorológica do Japão acompanha ainda 58 cerejeiras “referência” no país. Neste ano, 40 já atingiram o pico de floração e 14 o fizeram em tempo recorde. As árvores normalmente florescem por cerca de duas semanas todos os anos. “Podemos dizer que é mais provável por causa do impacto do aquecimento global”, disse Shunji Anbe, funcionário da divisão de observações da agência.
Dados Organização Meteorológica Mundial divulgados em janeiro mostram que as temperaturas globais em 2020 estiveram entre as mais altas já registradas e rivalizaram com 2016 com o ano mais quente de todos os tempos.
As flores de cerejeira têm longas raízes históricas e culturais no Japão, anunciando a Primavera e inspirando artistas e poetas ao longo dos séculos. Sua fragilidade é vista como um símbolo de vida, morte e renascimento.
Atualmente, as pessoas se reúnem sob as flores de cerejeiras a cada primavera para festas hanami (observação das flores), passeiam em parques e fazem piqueniques embaixo dos galhos e abusar das selfies. Mas, neste ano, a florada de cerejeiras veio e se foi em um piscar de olhos.
Com o fim do estado de emergência para conter a pandemia de Covid-19 em todas as regiões do Japão, muitas pessoas se aglomeraram em locais populares de exibição no fim de semana, embora o número de pessoas tenha sido menor do que em anos normais.
This combination of satellite images provided by the National Hurricane Center shows 30 hurricanes that occurred during the 2020 Atlantic hurricane season.
We’re one step closer to officially moving up hurricane season. The National Hurricane Center announced Tuesday that it would formally start issuing its hurricane season tropical weather outlooks on May 15 this year, bumping it up from the traditional start of hurricane season on June 1. The move comes after a recent spate of early season storms have raked the Atlantic.
Atlantic hurricane season runs from June 1 to November 30. That’s when conditions are most conducive to storm formation owing to warm air and water temperatures. (The Pacific ocean has its own hurricane season, which covers the same timeframe, but since waters are colder fewer hurricanes tend to form there than in the Atlantic.)
Storms have begun forming on the Atlantic earlier as ocean and air temperatures have increased due to climate change. Last year, Hurricane Arthur roared to life off the East Coast on May 16. That storm made 2020 the sixth hurricane season in a row to have a storm that formed earlier than the June 1 official start date. While the National Oceanic and Atmospheric Administration won’t be moving up the start of the season just yet, the earlier outlooks addresses the recent history.
“In the last decade, there have been 10 storms formed in the weeks before the traditional start of the season, which is a big jump,” said Sean Sublette, a meteorologist at Climate Central, who pointed out that the 1960s through 2010s saw between one and three storms each decade before the June 1 start date on average.
It might be tempting to ascribe this earlier season entirely to climate change warming the Atlantic. But technology also has a role to play, with more observations along the coast as well as satellites that can spot storms far out to sea.
“I would caution that we can’t just go, ‘hah, the planet’s warming, we’ve had to move the entire season!’” Sublette said. “I don’t think there’s solid ground for attribution of how much of one there is over the other. Weather folks can sit around and debate that for awhile.”
Earlier storms don’t necessarily mean more harmful ones, either. In fact, hurricanes earlier in the season tend to be weaker than the monsters that form in August and September when hurricane season is at its peak. But regardless of their strength, these earlier storms have generated discussion inside the NHC on whether to move up the official start date for the season, when the agency usually puts out two reports per day on hurricane activity. Tuesday’s step is not an official announcement of this decision, but an acknowledgement of the increased attention on early hurricanes.
“I would say that [Tuesday’s announcement] is the National Hurricane Center being proactive,” Sublette said. “Like hey, we know that the last few years it’s been a little busier in May than we’ve seen in the past five decades, and we know there is an awareness now, so we’re going to start issuing these reports early.”
While the jury is still out on whether climate change is pushing the season earlier, research has shown that the strongest hurricanes are becoming more common, and that climate change is likely playing a role. A study published last year found the odds of a storm becoming a major hurricanes—those Category 3 or stronger—have increase 49% in the basin since satellite monitoring began in earnest four decades ago. And when storms make landfall, sea level rise allows them to do more damage. So regardless of if climate change is pushing Atlantic hurricane season is getting earlier or not, the risks are increasing. Now, at least, we’ll have better warnings before early storms do hit.
Alex Wong / Chet Strange/ Sarah Silbiger / Bloomberg / Getty / The Atlantic
When the polio vaccine was declared safe and effective, the news was met with jubilant celebration. Church bells rang across the nation, and factories blew their whistles. “Polio routed!” newspaper headlines exclaimed. “An historic victory,” “monumental,” “sensational,” newscasters declared. People erupted with joy across the United States. Some danced in the streets; others wept. Kids were sent home from school to celebrate.
One might have expected the initial approval of the coronavirus vaccines to spark similar jubilation—especially after a brutal pandemic year. But that didn’t happen. Instead, the steady drumbeat of good news about the vaccines has been met with a chorus of relentless pessimism.
The problem is not that the good news isn’t being reported, or that we should throw caution to the wind just yet. It’s that neither the reporting nor the public-health messaging has reflected the truly amazing reality of these vaccines. There is nothing wrong with realism and caution, but effective communication requires a sense of proportion—distinguishing between due alarm and alarmism; warranted, measured caution and doombait; worst-case scenarios and claims of impending catastrophe. We need to be able to celebrate profoundly positive news while noting the work that still lies ahead. However, instead of balanced optimism since the launch of the vaccines, the public has been offered a lot of misguided fretting over new virus variants, subjected to misleading debates about the inferiority of certain vaccines, and presented with long lists of things vaccinated people still cannot do, while media outlets wonder whether the pandemic will ever end.
This pessimism is sapping people of energy to get through the winter, and the rest of this pandemic. Anti-vaccination groups and those opposing the current public-health measures have been vigorously amplifying the pessimistic messages—especially the idea that getting vaccinated doesn’t mean being able to do more—telling their audiences that there is no point in compliance, or in eventual vaccination, because it will not lead to any positive changes. They are using the moment and the messaging to deepen mistrust of public-health authorities, accusing them of moving the goalposts and implying that we’re being conned. Either the vaccines aren’t as good as claimed, they suggest, or the real goal of pandemic-safety measures is to control the public, not the virus.
Five key fallacies and pitfalls have affected public-health messaging, as well as media coverage, and have played an outsize role in derailing an effective pandemic response. These problems were deepened by the ways that we—the public—developed to cope with a dreadful situation under great uncertainty. And now, even as vaccines offer brilliant hope, and even though, at least in the United States, we no longer have to deal with the problem of a misinformer in chief, some officials and media outlets are repeating many of the same mistakes in handling the vaccine rollout.
The pandemic has given us an unwelcome societal stress test, revealing the cracks and weaknesses in our institutions and our systems. Some of these are common to many contemporary problems, including political dysfunction and the way our public sphere operates. Others are more particular, though not exclusive, to the current challenge—including a gap between how academic research operates and how the public understands that research, and the ways in which the psychology of coping with the pandemic have distorted our response to it.
Recognizing all these dynamics is important, not only for seeing us through this pandemic—yes, it is going to end—but also to understand how our society functions, and how it fails. We need to start shoring up our defenses, not just against future pandemics but against all the myriad challenges we face—political, environmental, societal, and technological. None of these problems is impossible to remedy, but first we have to acknowledge them and start working to fix them—and we’re running out of time.
The past 12 months were incredibly challenging for almost everyone. Public-health officials were fighting a devastating pandemic and, at least in this country, an administration hell-bent on undermining them. The World Health Organization was not structured or funded for independence or agility, but still worked hard to contain the disease. Many researchers and experts noted the absence of timely and trustworthy guidelines from authorities, and tried to fill the void by communicating their findings directly to the public on social media. Reporters tried to keep the public informed under time and knowledge constraints, which were made more severe by the worsening media landscape. And the rest of us were trying to survive as best we could, looking for guidance where we could, and sharing information when we could, but always under difficult, murky conditions.
Despite all these good intentions, much of the public-health messaging has been profoundly counterproductive. In five specific ways, the assumptions made by public officials, the choices made by traditional media, the way our digital public sphere operates, and communication patterns between academic communities and the public proved flawed.
Risk Compensation
One of the most important problems undermining the pandemic response has been the mistrust and paternalism that some public-health agencies and experts have exhibited toward the public. A key reason for this stance seems to be that some experts feared that people would respond to something that increased their safety—such as masks, rapid tests, or vaccines—by behaving recklessly. They worried that a heightened sense of safety would lead members of the public to take risks that would not just undermine any gains, but reverse them.
The theory that things that improve our safety might provide a false sense of security and lead to reckless behavior is attractive—it’s contrarian and clever, and fits the “here’s something surprising we smart folks thought about” mold that appeals to, well, people who think of themselves as smart. Unsurprisingly, such fears have greeted efforts to persuade the public to adopt almost every advance in safety, including seat belts, helmets, and condoms.
But time and again, the numbers tell a different story: Even if safety improvements cause a few people to behave recklessly, the benefitsoverwhelmthe ill effects. In any case, most people are already interested in staying safe from a dangerous pathogen. Further, even at the beginning of the pandemic, sociological theory predictedthat wearing masks would be associated with increased adherence to other precautionary measures—people interested in staying safe are interested in staying safe—and empirical research quickly confirmedexactly that. Unfortunately, though, the theory of risk compensation—and its implicit assumptions—continue to haunt our approach, in part because there hasn’t been a reckoning with the initial missteps.
Rules in Place of Mechanisms and Intuitions
Much of the public messaging focused on offering a series of clear rules to ordinary people, instead of explaining in detail the mechanisms of viral transmission for this pathogen. A focus on explaining transmission mechanisms, and updating our understanding over time, would have helped empower people to make informed calculations about risk in different settings. Instead, both the CDC and the WHO chose to offer fixed guidelines that lent a false sense of precision.
In the United States, the public was initially told that “close contact” meant coming within six feet of an infected individual, for 15 minutes or more. This messaging led to ridiculous gaming of the rules; some establishments moved people around at the 14th minute to avoid passing the threshold. It also led to situations in which people working indoors with others, but just outside the cutoff of six feet, felt that they could take their mask off. None of this made any practical sense. What happened at minute 16? Was seven feet okay? Faux precision isn’t more informative; it’s misleading.
All of this was complicated by the fact that key public-health agencies like the CDC and the WHO were late to acknowledge the importance of some key infection mechanisms, such as aerosol transmission. Even when they did so, the shift happened without a proportional change in the guidelines or the messaging—it was easy for the general public to miss its significance.
Frustrated by the lack of public communication from health authorities, I wrote an article last July on what we then knew about the transmission of this pathogen—including how it could be spread via aerosols that can float and accumulate, especially in poorly ventilated indoor spaces. To this day, I’m contacted by people who describe workplaces that are following the formal guidelines, but in ways that defy reason: They’ve installed plexiglass, but barred workers from opening their windows; they’ve mandated masks, but only when workers are within six feet of one another, while permitting them to be taken off indoors during breaks.
Perhaps worst of all, our messaging and guidelines elided the difference between outdoor and indoor spaces, where, given the importance of aerosol transmission, the same precautions should not apply. This is especially important because this pathogen is overdispersed: Much of the spread is driven by a few people infecting many others at once, while most people do not transmit the virus at all.
After I wrote an article explaining how overdispersion and super-spreading were driving the pandemic, I discovered that this mechanism had also been poorly explained. I was inundated by messages from people, including elected officials around the world, saying they had no idea that this was the case. None of it was secret—numerous academic papers and articles had been written about it—but it had not been integrated into our messaging or our guidelines despite its great importance.
Crucially, super-spreading isn’t equally distributed; poorly ventilated indoor spaces can facilitate the spread of the virus over longer distances, and in shorter periods of time, than the guidelines suggested, and help fuel the pandemic.
Outdoors? It’s the opposite.
There is a solid scientific reason for the fact that there are relatively few documented cases of transmission outdoors, even after a year of epidemiological work: The open air dilutes the virus very quickly, and the sun helps deactivate it, providing further protection. And super-spreading—the biggest driver of the pandemic— appears to be an exclusively indoor phenomenon. I’ve been tracking every report I can find for the past year, and have yet to find a confirmed super-spreading event that occurred solely outdoors. Such events might well have taken place, but if the risk were great enough to justify altering our lives, I would expect at least a few to have been documented by now.
And yet our guidelines do not reflect these differences, and our messaging has not helped people understand these facts so that they can make better choices. I published my first article pleading for parks to be kept open on April 7, 2020—but outdoor activities are still banned by some authorities today, a full year after this dreaded virus began to spread globally.
We’d have been much better off if we gave people a realistic intuition about this virus’s transmission mechanisms. Our public guidelines should have been more like Japan’s, which emphasize avoiding the three C’s—closed spaces, crowded places, and close contact—that are driving the pandemic.
Scolding and Shaming
Throughout the past year, traditional and social media have been caught up in a cycle of shaming—made worse by being so unscientific and misguided. How dare you go to the beach? newspapers have scolded us for months, despite lacking evidence that this posed any significant threat to public health. It wasn’t just talk: Many cities closed parks and outdoor recreational spaces, even as they kept open indoor dining and gyms. Just this month, UC Berkeley and the University of Massachusetts at Amherst both banned students from taking even solitary walks outdoors.
Even when authorities relax the rules a bit, they do not always follow through in a sensible manner. In the United Kingdom, after some locales finally started allowing children to play on playgrounds—something that was already way overdue—they quickly ruled that parents must not socialize while their kids have a normal moment. Why not? Who knows?
On social media, meanwhile, pictures of people outdoors without masks draw reprimands, insults, and confident predictions of super-spreading—and yet few note when super-spreading fails to follow.
While visible but low-risk activities attract the scolds, other actual risks—in workplaces and crowded households, exacerbated by the lack of testing or paid sick leave—are not as easily accessible to photographers. Stefan Baral, an associate epidemiology professor at the Johns Hopkins Bloomberg School of Public Health, says that it’s almost as if we’ve “designed a public-health response most suitable for higher-income” groups and the “Twitter generation”—stay home; have your groceries delivered; focus on the behaviors you can photograph and shame online—rather than provide the support and conditionsnecessary for more people to keep themselves safe.
And the viral videos shaming people for failing to take sensible precautions, such as wearing masks indoors, do not necessarily help. For one thing, fretting over the occasional person throwing a tantrum while going unmasked in a supermarket distorts the reality: Most of the public has been complying with mask wearing. Worse, shaming is often an ineffective way of getting people to change their behavior, and it entrenches polarization and discourages disclosure, making it harder to fight the virus. Instead, we should be emphasizing safer behavior and stressing how many people are doing their part, while encouraging others to do the same.
Harm Reduction
Amidst all the mistrust and the scolding, a crucial public-health concept fell by the wayside. Harm reduction is the recognition that if there is an unmet and yet crucial human need, we cannot simply wish it away; we need to advise people on how to do what they seek to do more safely. Risk can never be completely eliminated; life requires more than futile attempts to bring risk down to zero. Pretending we can will away complexities and trade-offs with absolutism is counterproductive. Consider abstinence-only education: Not letting teenagers know about ways to have safer sex results in more of them having sex with no protections.
As Julia Marcus, an epidemiologist and associate professor at Harvard Medical School, told me, “When officials assume that risks can be easily eliminated, they might neglect the other things that matter to people: staying fed and housed, being close to loved ones, or just enjoying their lives. Public health works best when it helps people find safer ways to get what they need and want.””
Another problem with absolutism is the “abstinence violation” effect, Joshua Barocas, an assistant professor at the Boston University School of Medicine and Infectious Diseases, told me. When we set perfection as the only option, it can cause people who fall short of that standard in one small, particular way to decide that they’ve already failed, and might as well give up entirely. Most people who have attempted a diet or a new exercise regimen are familiar with this psychological state. The better approach is encouraging risk reduction and layered mitigation—emphasizing that every little bit helps—while also recognizing that a risk-free life is neither possible nor desirable.
Socializing is not a luxury—kids need to play with one another, and adults need to interact. Your kids can play together outdoors, and outdoor time is the best chance to catch up with your neighbors is not just a sensible message; it’s a way to decrease transmission risks. Some kids will play and some adults will socialize no matter what the scolds say or public-health officials decree, and they’ll do it indoors, out of sight of the scolding.
And if they don’t? Then kids will be deprived of an essential activity, and adults will be deprived of human companionship. Socializing is perhaps the most important predictor of health and longevity, after not smoking and perhaps exercise and a healthy diet. We need to help people socialize more safely, not encourage them to stop socializing entirely.
The Balance Between Knowledge And Action
Last but not least, the pandemic response has been distorted by a poor balance between knowledge, risk, certainty, and action.
Sometimes, public-health authorities insisted that we did not know enough to act, when the preponderance of evidence already justified precautionary action. Wearing masks, for example, posed few downsides, and held the prospect of mitigating the exponential threat we faced. The wait for certainty hampered our response to airborne transmission, even though there was almost no evidence for—and increasing evidence against—the importance of fomites, or objects that can carry infection. And yet, we emphasized the risk of surface transmission while refusing to properly address the risk of airborne transmission, despite increasing evidence. The difference lay not in the level of evidence and scientific support for either theory—which, if anything, quickly tilted in favor of airborne transmission, and not fomites, being crucial—but in the fact that fomite transmission had been a key part of the medical canon, and airborne transmission had not.
Sometimes, experts and the public discussion failed to emphasize that we were balancing risks, as in the recurring cycles of debate over lockdowns or school openings. We should have done more to acknowledge that there were no good options, only trade-offs between different downsides. As a result, instead of recognizing the difficulty of the situation, too many people accused those on the other side of being callous and uncaring.
And sometimes, the way that academics communicate clashed with how the public constructs knowledge. In academia, publishing is the coin of the realm, and it is often done through rejecting the null hypothesis—meaning that many papers do not seek to prove something conclusively, but instead, to reject the possibility that a variable has no relationship with the effect they are measuring (beyond chance). If that sounds convoluted, it is—there are historical reasons for this methodology and big arguments within academia about its merits, but for the moment, this remains standard practice.
At crucial points during the pandemic, though, this resulted in mistranslations and fueled misunderstandings, which were further muddled by differing stances toward prior scientific knowledge and theory. Yes, we faced a novel coronavirus, but we should have started by assuming that we could make some reasonable projections from prior knowledge, while looking out for anything that might prove different. That prior experience should have made us mindful of seasonality, the key role of overdispersion, and aerosol transmission. A keen eye for what was different from the past would have alerted us earlier to the importance of presymptomatic transmission.
Thus, on January 14, 2020, the WHO stated that there was “no clear evidence of human-to-human transmission.” It should have said, “There is increasing likelihood that human-to-human transmission is taking place, but we haven’t yet proven this, because we have no access to Wuhan, China.” (Cases were already popping up around the world at that point.) Acting as if there was human-to-human transmission during the early weeks of the pandemic would have been wise and preventive.
Later that spring, WHO officials stated that there was “currently no evidence that people who have recovered from COVID-19 and have antibodies are protected from a second infection,” producing many articles laden with panic and despair. Instead, it should have said: “We expect the immune system to function against this virus, and to provide some immunity for some period of time, but it is still hard to know specifics because it is so early.”
Similarly, since the vaccines were announced, too many statements have emphasized that we don’t yet know if vaccines prevent transmission. Instead, public-health authorities should have said that we have many reasons to expect, and increasing amounts of data to suggest, that vaccines will blunt infectiousness, but that we’re waiting for additional data to be more precise about it. That’s been unfortunate, because while many, many things have gone wrong during this pandemic, the vaccines are one thing that has gone very, very right.
As late as April 2020, Anthony Fauci was slammed for being too optimistic for suggesting we might plausibly have vaccines in a year to 18 months. We had vaccines much, much sooner than that: The first two vaccine trials concluded a mere eight months after the WHO declared a pandemic in March 2020.
Moreover, they have delivered spectacular results. In June 2020, the FDA said a vaccine that was merely 50 percent efficacious in preventing symptomatic COVID-19 would receive emergency approval—that such a benefit would be sufficient to justify shipping it out immediately. Just a few months after that, the trials of the Moderna and Pfizer vaccines concluded by reporting not just a stunning 95 percent efficacy, but also a complete elimination of hospitalization or death among the vaccinated. Even severe disease was practically gone: The lone case classified as “severe” among 30,000 vaccinated individuals in the trials was so mild that the patient needed no medical care, and her case would not have been considered severe if her oxygen saturation had been a single percent higher.
These are exhilarating developments, because global, widespread, and rapid vaccination is our way out of this pandemic. Vaccines that drastically reduce hospitalizations and deaths, and that diminish even severe disease to a rare event, are the closest things we have had in this pandemic to a miracle—though of course they are the product of scientific research, creativity, and hard work. They are going to be the panacea and the endgame.
And yet, two months into an accelerating vaccination campaign in the United States, it would be hard to blame people if they missed the news that things are getting better.
Yes, there are new variants of the virus, which may eventually require booster shots, but at least so far, the existing vaccines are standing up to them well—very, very well. Manufacturers are already working on new vaccines or variant-focused booster versions, in case they prove necessary, and the authorizing agencies are ready for a quick turnaround if and when updates are needed. Reports from places that have vaccinated large numbers of individuals, and even trials in places where variants are widespread, are exceedingly encouraging, with dramatic reductions in cases and, crucially, hospitalizations and deaths among the vaccinated. Global equity and access to vaccines remain crucial concerns, but the supply is increasing.
Here in the United States, despite the rocky rollout and the need to smooth access and ensure equity, it’s become clear that toward the end of spring 2021, supply will be more than sufficient. It may sound hard to believe today, as many who are desperate for vaccinations await their turn, but in the near future, we may have to discuss what to do with excess doses.
So why isn’t this story more widely appreciated?
Part of the problem with the vaccines was the timing—the trials concluded immediately after the U.S. election, and their results got overshadowed in the weeks of political turmoil. The first, modest headline announcing the Pfizer-BioNTech results in The New York Times was a single column, “Vaccine Is Over 90% Effective, Pfizer’s Early Data Says,” below a banner headline spanning the page: “BIDEN CALLS FOR UNITED FRONT AS VIRUS RAGES.” That was both understandable—the nation was weary—and a loss for the public.
Just a few days later, Moderna reported a similar 94.5 percent efficacy. If anything, that provided even more cause for celebration, because it confirmed that the stunning numbers coming out of Pfizer weren’t a fluke. But, still amid the political turmoil, the Moderna report got a mere two columns on The New York Times’ front page with an equally modest headline: “Another Vaccine Appears to Work Against the Virus.”
So we didn’t get our initial vaccine jubilation.
But as soon as we began vaccinating people, articles started warning the newly vaccinated about all they could not do. “COVID-19 Vaccine Doesn’t Mean You Can Party Like It’s 1999,” one headline admonished. And the buzzkill has continued right up to the present. “You’re fully vaccinated against the coronavirus—now what? Don’t expect to shed your mask and get back to normal activities right away,” began a recent Associated Press story.
People might well want to party after being vaccinated. Those shots will expand what we can do, first in our private lives and among other vaccinated people, and then, gradually, in our public lives as well. But once again, the authorities and the media seem more worried about potentially reckless behavior among the vaccinated, and about telling them what not to do, than with providing nuanced guidance reflecting trade-offs, uncertainty, and a recognition that vaccination can change behavior. No guideline can cover every situation, but careful, accurate, and updated information can empower everyone.
Take the messaging and public conversation around transmission risks from vaccinated people. It is, of course, important to be alert to such considerations: Many vaccines are “leaky” in that they prevent disease or severe disease, but not infection and transmission. In fact, completely blocking all infection—what’s often called “sterilizing immunity”—is a difficult goal, and something even many highly effective vaccines don’t attain, but that doesn’t stop them from being extremely useful.
As Paul Sax, an infectious-disease doctor at Boston’s Brigham & Women’s Hospital, put it in early December, it would be enormously surprising “if these highly effective vaccines didn’t also make people less likely to transmit.” From multiple studies, we already knew that asymptomatic individuals—those who never developed COVID-19 despite being infected—were much less likely to transmit the virus. The vaccine trials were reporting 95 percent reductions in any form of symptomatic disease. In December, we learned that Moderna had swabbed some portion of trial participants to detect asymptomatic, silent infections, and found an almost two-thirds reduction even in such cases. The good news kept pouring in. Multiple studies found that, even in those few cases where breakthrough disease occurred in vaccinated people, their viral loads were lower—which correlates with lower rates of transmission. Data from vaccinated populations further confirmed what many experts expected all along: Of course these vaccines reduce transmission.
And yet, from the beginning, a good chunk of the public-facing messaging and news articles implied or claimed that vaccines won’t protect you against infecting other people or that we didn’t know if they would, when both were false. I found myself trying to convince people in my own social network that vaccines weren’t useless against transmission, and being bombarded on social media with claims that they were.
What went wrong? The same thing that’s going wrong right now with the reporting on whether vaccines will protect recipients against the new viral variants. Some outlets emphasize the worst or misinterpret the research. Some public-health officials are wary of encouraging the relaxation of any precautions. Some prominent experts on social media—even those with seemingly solid credentials—tend to respond to everything with alarm and sirens. So the message that got heard was that vaccines will not prevent transmission, or that they won’t work against new variants, or that we don’t know if they will. What the public needs to hear, though, is that based on existing data, we expect them to work fairly well—but we’ll learn more about precisely how effective they’ll be over time, and that tweaks may make them even better.
A year into the pandemic, we’re still repeating the same mistakes.
The top-down messaging is not the only problem. The scolding, the strictness, the inability to discuss trade-offs, and the accusations of not caring about people dying not only have an enthusiastic audience, but portions of the public engage in these behaviors themselves. Maybe that’s partly because proclaiming the importance of individual actions makes us feel as if we are in the driver’s seat, despite all the uncertainty.
Psychologists talk about the “locus of control”—the strength of belief in control over your own destiny. They distinguish between people with more of an internal-control orientation—who believe that they are the primary actors—and those with an external one, who believe that society, fate, and other factors beyond their control greatly influence what happens to us. This focus on individual control goes along with something called the “fundamental attribution error”—when bad things happen to other people, we’re more likely to believe that they are personally at fault, but when they happen to us, we are more likely to blame the situation and circumstances beyond our control.
An individualistic locus of control is forged in the U.S. mythos—that we are a nation of strivers and people who pull ourselves up by our bootstraps. An internal-control orientation isn’t necessarily negative; it can facilitate resilience, rather than fatalism, by shifting the focus to what we can do as individuals even as things fall apart around us. This orientation seems to be common among children who not only survive but sometimes thrive in terrible situations—they take charge and have a go at it, and with some luck, pull through. It is probably even more attractive to educated, well-off people who feel that they have succeeded through their own actions.
You can see the attraction of an individualized, internal locus of control in a pandemic, as a pathogen without a cure spreads globally, interrupts our lives, makes us sick, and could prove fatal.
There have been very few things we could do at an individual level to reduce our risk beyond wearing masks, distancing, and disinfecting. The desire to exercise personal control against an invisible, pervasive enemy is likely why we’ve continued to emphasize scrubbing and cleaning surfaces, in what’s appropriately called “hygiene theater,” long after it became clear that fomites were not a key driver of the pandemic. Obsessive cleaning gave us something to do, and we weren’t about to give it up, even if it turned out to be useless. No wonder there was so much focus on telling others to stay home—even though it’s not a choice available to those who cannot work remotely—and so much scolding of those who dared to socialize or enjoy a moment outdoors.
And perhaps it was too much to expect a nation unwilling to release its tight grip on the bottle of bleach to greet the arrival of vaccines—however spectacular—by imagining the day we might start to let go of our masks.
The focus on individual actions has had its upsides, but it has also led to a sizable portion of pandemic victims being erased from public conversation. If our own actions drive everything, then some other individuals must be to blame when things go wrong for them. And throughout this pandemic, the mantra many of us kept repeating—“Wear a mask, stay home; wear a mask, stay home”—hid many of the real victims.
Study after study, in country after country, confirms that this disease has disproportionately hit the poor and minority groups, along with the elderly, who are particularly vulnerable to severe disease. Even among the elderly, though, those who are wealthier and enjoy greater access to health care have fared better.
The poor and minority groups are dying in disproportionately large numbers for the same reasons that they suffer from many other diseases: a lifetime of disadvantages, lack of access to health care, inferior working conditions, unsafe housing, and limited financial resources.
Many lacked the option of staying home precisely because they were working hard to enable others to do what they could not, by packing boxes, delivering groceries, producing food. And even those who could stay home faced other problems born of inequality: Crowded housing is associatedwith higher rates of COVID-19 infection and worse outcomes, likely because many of the essential workers who live in such housing bring the virus home to elderly relatives.
Individual responsibility certainly had a large role to play in fighting the pandemic, but many victims had little choice in what happened to them. By disproportionately focusing on individual choices, not only did we hide the real problem, but we failed to do more to provide safe working and living conditions for everyone.
For example, there has been a lot of consternation about indoor dining, an activity I certainly wouldn’t recommend. But even takeout and delivery can impose a terrible cost: One study of California found that line cooks are the highest-risk occupation for dying of COVID-19. Unless we provide restaurants with funds so they can stay closed, or provide restaurant workers with high-filtration masks, better ventilation, paid sick leave, frequent rapid testing, and other protections so that they can safely work, getting food to go can simply shift the risk to the most vulnerable. Unsafe workplaces may be low on our agenda, but they do pose a real danger. Bill Hanage, associate professor of epidemiology at Harvard, pointed me to a paper he co-authored: Workplace-safety complaints to OSHA—which oversees occupational-safety regulations—during the pandemic were predictive of increases in deaths 16 days later.
New data highlight the terrible toll of inequality: Life expectancy has decreased dramatically over the past year, with Black people losing the most from this disease, followed by members of the Hispanic community. Minorities are also more likely to die of COVID-19 at a younger age. But when the new CDC director, Rochelle Walensky, noted this terrible statistic, she immediately followed up by urging people to “continue to use proven prevention steps to slow the spread—wear a well-fitting mask, stay 6 ft away from those you do not live with, avoid crowds and poorly ventilated places, and wash hands often.”
Those recommendations aren’t wrong, but they are incomplete. None of these individual acts do enough to protect those to whom such choices aren’t available—and the CDC has yet to issue sufficient guidelines for workplace ventilation or to make higher-filtration masks mandatory, or even available, for essential workers. Nor are these proscriptions paired frequently enough with prescriptions: Socialize outdoors, keep parks open, and let children play with one another outdoors.
Vaccines are the tool that will end the pandemic. The story of their rollout combines some of our strengths and our weaknesses, revealing the limitations of the way we think and evaluate evidence, provide guidelines, and absorb and react to an uncertain and difficult situation.
But also, after a weary year, maybe it’s hard for everyone—including scientists, journalists, and public-health officials—to imagine the end, to have hope. We adjust to new conditions fairly quickly, even terrible new conditions. During this pandemic, we’ve adjusted to things many of us never thought were possible. Billions of people have led dramatically smaller, circumscribed lives, and dealt with closed schools, the inability to see loved ones, the loss of jobs, the absence of communal activities, and the threat and reality of illness and death.
Hope nourishes us during the worst times, but it is also dangerous. It upsets the delicate balance of survival—where we stop hoping and focus on getting by—and opens us up to crushing disappointment if things don’t pan out. After a terrible year, many things are understandably making it harder for us to dare to hope. But, especially in the United States, everything looks better by the day. Tragically, at least 28 million Americans have been confirmed to have been infected, but the real number is certainly much higher. By one estimate, as many as 80 million have already been infected with COVID-19, and many of those people now have some level of immunity. Another 46 million people have already received at least one dose of a vaccine, and we’re vaccinating millions more each day as the supply constraints ease. The vaccines are poised to reduce or nearly eliminate the things we worry most about—severe disease, hospitalization, and death.
Not all our problems are solved. We need to get through the next few months, as we race to vaccinate against more transmissible variants. We need to do more to address equity in the United States—because it is the right thing to do, and because failing to vaccinate the highest-risk people will slow the population impact. We need to make sure that vaccines don’t remain inaccessible to poorer countries. We need to keep up our epidemiological surveillance so that if we do notice something that looks like it may threaten our progress, we can respond swiftly.
And the public behavior of the vaccinated cannot change overnight—even if they are at much lower risk, it’s not reasonable to expect a grocery store to try to verify who’s vaccinated, or to have two classes of people with different rules. For now, it’s courteous and prudent for everyone to obey the same guidelines in many public places. Still, vaccinated people can feel more confident in doing things they may have avoided, just in case—getting a haircut, taking a trip to see a loved one, browsing for nonessential purchases in a store.
But it is time to imagine a better future, not just because it’s drawing nearer but because that’s how we get through what remains and keep our guard up as necessary. It’s also realistic—reflecting the genuine increased safety for the vaccinated.
Public-health agencies should immediately start providing expanded information to vaccinated people so they can make informed decisions about private behavior. This is justified by the encouraging data, and a great way to get the word out on how wonderful these vaccines really are. The delay itself has great human costs, especially for those among the elderly who have been isolated for so long.
Public-health authorities should also be louder and more explicit about the next steps, giving us guidelines for when we can expect easing in rules for public behavior as well. We need the exit strategy spelled out—but with graduated, targeted measures rather than a one-size-fits-all message. We need to let people know that getting a vaccine will almost immediately change their lives for the better, and why, and also when and how increased vaccination will change more than their individual risks and opportunities, and see us out of this pandemic.
We should encourage people to dream about the end of this pandemic by talking about it more, and more concretely: the numbers, hows, and whys. Offering clear guidance on how this will end can help strengthen people’s resolve to endure whatever is necessary for the moment—even if they are still unvaccinated—by building warranted and realistic anticipation of the pandemic’s end.
Hope will get us through this. And one day soon, you’ll be able to hop off the subway on your way to a concert, pick up a newspaper, and find the triumphant headline: “COVID Routed!”
Zeynep Tufekci is a contributing writer at The Atlantic and an associate professor at the University of North Carolina. She studies the interaction between digital technology, artificial intelligence, and society.
Lincoln Park in Chicago. Scientists are hopeful, as vaccinations continue and despite the emergence of variants, that we’re past the worst of the pandemic. Credit: Lyndon French for The New York Times
Many scientists are expecting another rise in infections. But this time the surge will be blunted by vaccines and, hopefully, widespread caution. By summer, Americans may be looking at a return to normal life.
Published Feb. 25, 2021Updated Feb. 26, 2021, 12:07 a.m. ET
Across the United States, and the world, the coronavirus seems to be loosening its stranglehold. The deadly curve of cases, hospitalizations and deaths has yo-yoed before, but never has it plunged so steeply and so fast.
Is this it, then? Is this the beginning of the end? After a year of being pummeled by grim statistics and scolded for wanting human contact, many Americans feel a long-promised deliverance is at hand.
Americans will win against the virus and regain many aspects of their pre-pandemic lives, most scientists now believe. Of the 21 interviewed for this article, all were optimistic that the worst of the pandemic is past. This summer, they said, life may begin to seem normal again.
But — of course, there’s always a but — researchers are also worried that Americans, so close to the finish line, may once again underestimate the virus.
So far, the two vaccines authorized in the United States are spectacularly effective, and after a slow start, the vaccination rollout is picking up momentum. A third vaccine is likely to be authorized shortly, adding to the nation’s supply.
But it will be many weeks before vaccinations make a dent in the pandemic. And now the virus is shape-shifting faster than expected, evolving into variants that may partly sidestep the immune system.
The latest variant was discovered in New York City only this week, and another worrisome version is spreading at a rapid pace through California. Scientists say a contagious variant first discovered in Britain will become the dominant form of the virus in the United States by the end of March.
The road back to normalcy is potholed with unknowns: how well vaccines prevent further spread of the virus; whether emerging variants remain susceptible enough to the vaccines; and how quickly the world is immunized, so as to halt further evolution of the virus.
But the greatest ambiguity is human behavior. Can Americans desperate for normalcy keep wearing masks and distancing themselves from family and friends? How much longer can communities keep businesses, offices and schools closed?
Covid-19 deaths will most likely never rise quite as precipitously as in the past, and the worst may be behind us. But if Americans let down their guard too soon — many states are already lifting restrictions — and if the variants spread in the United States as they have elsewhere, another spike in cases may well arrive in the coming weeks.
Scientists call it the fourth wave. The new variants mean “we’re essentially facing a pandemic within a pandemic,” said Adam Kucharski, an epidemiologist at the London School of Hygiene and Tropical Medicine.
The declines are real, but they disguise worrying trends.
Credit: Daniel Dreifuss for The New York Times
The United States has now recorded 500,000 deaths amid the pandemic, a terrible milestone. As of Wednesday morning, at least 28.3 million people have been infected.
But the rate of new infections has tumbled by 35 percent over the past two weeks, according to a database maintained by The New York Times. Hospitalizations are down 31 percent, and deaths have fallen by 16 percent.
Yet the numbers are still at the horrific highs of November, scientists noted. At least 3,210 people died of Covid-19 on Wednesday alone. And there is no guarantee that these rates will continue to decrease.
“Very, very high case numbers are not a good thing, even if the trend is downward,” said Marc Lipsitch, an epidemiologist at the Harvard T.H. Chan School of Public Health in Boston. “Taking the first hint of a downward trend as a reason to reopen is how you get to even higher numbers.”
In late November, for example, Gov. Gina Raimondo of Rhode Island limited social gatherings and some commercial activities in the state. Eight days later, cases began to decline. The trend reversed eight days after the state’s pause lifted on Dec. 20.
The virus’s latest retreat in Rhode Island and most other states, experts said, results from a combination of factors: growing numbers of people with immunity to the virus, either from having been infected or from vaccination; changes in behavior in response to the surges of a few weeks ago; and a dash of seasonality — the effect of temperature and humidity on the survival of the virus.
The vaccines were first rolled out to residents of nursing homes and to the elderly, who are at highest risk of severe illness and death. That may explain some of the current decline in hospitalizations and deaths.
Credit: Joao Silva/The New York Times
But young people drive the spread of the virus, and most of them have not yet been inoculated. And the bulk of the world’s vaccine supply has been bought up by wealthy nations, which have amassed one billion more doses than needed to immunize their populations.
Vaccination cannot explain why cases are dropping even in countries where not a single soul has been immunized, like Honduras, Kazakhstan or Libya. The biggest contributor to the sharp decline in infections is something more mundane, scientists say: behavioral change.
Leaders in the United States and elsewhere stepped up community restrictions after the holiday peaks. But individual choices have also been important, said Lindsay Wiley, an expert in public health law and ethics at American University in Washington.
“People voluntarily change their behavior as they see their local hospital get hit hard, as they hear about outbreaks in their area,” she said. “If that’s the reason that things are improving, then that’s something that can reverse pretty quickly, too.”
The downward curve of infections with the original coronavirus disguises an exponential rise in infections with B.1.1.7, the variant first identified in Britain, according to many researchers.
“We really are seeing two epidemic curves,” said Ashleigh Tuite, an infectious disease modeler at the University of Toronto.
The B.1.1.7 variant is thought to be more contagious and more deadly, and it is expected to become the predominant form of the virus in the United States by late March. The number of cases with the variant in the United States has risen from 76 in 12 states as of Jan. 13 to more than 1,800 in 45 states now. Actual infections may be much higher because of inadequate surveillance efforts in the United States.
Buoyed by the shrinking rates over all, however, governors are lifting restrictions across the United States and are under enormous pressure to reopen completely. Should that occur, B.1.1.7 and the other variants are likely to explode.
“Everybody is tired, and everybody wants things to open up again,” Dr. Tuite said. “Bending to political pressure right now, when things are really headed in the right direction, is going to end up costing us in the long term.”
Another wave may be coming, but it can be minimized.
Credit: Lyndon French for The New York Times
Looking ahead to late March or April, the majority of scientists interviewed by The Times predicted a fourth wave of infections. But they stressed that it is not an inevitable surge, if government officials and individuals maintain precautions for a few more weeks.
A minority of experts were more sanguine, saying they expected powerful vaccines and an expanding rollout to stop the virus. And a few took the middle road.
“We’re at that crossroads, where it could go well or it could go badly,” said Dr. Anthony Fauci, director of the National Institute of Allergy and Infectious Diseases.
The vaccines have proved to be more effective than anyone could have hoped, so far preventing serious illness and death in nearly all recipients. At present, about 1.4 million Americans are vaccinated each day. More than 45 million Americans have received at least one dose.
A team of researchers at Fred Hutchinson Cancer Research Center in Seattle tried to calculate the number of vaccinations required per day to avoid a fourth wave. In a model completed before the variants surfaced, the scientists estimated that vaccinating just one million Americans a day would limit the magnitude of the fourth wave.
“But the new variants completely changed that,” said Dr. Joshua T. Schiffer, an infectious disease specialist who led the study. “It’s just very challenging scientifically — the ground is shifting very, very quickly.”
Natalie Dean, a biostatistician at the University of Florida, described herself as “a little more optimistic” than many other researchers. “We would be silly to undersell the vaccines,” she said, noting that they are effective against the fast-spreading B.1.1.7 variant.
But Dr. Dean worried about the forms of the virus detected in South Africa and Brazil that seem less vulnerable to the vaccines made by Pfizer and Moderna. (On Wednesday, Johnson & Johnson reported that its vaccine was relatively effective against the variant found in South Africa.)
Credit: Pete Kiehart for The New York Times
About 50 infections with those two variants have been identified in the United States, but that could change. Because of the variants, scientists do not know how many people who were infected and had recovered are now vulnerable to reinfection.
South Africa and Brazil have reported reinfections with the new variants among people who had recovered from infections with the original version of the virus.
“That makes it a lot harder to say, ‘If we were to get to this level of vaccinations, we’d probably be OK,’” said Sarah Cobey, an evolutionary biologist at the University of Chicago.
Yet the biggest unknown is human behavior, experts said. The sharp drop in cases now may lead to complacency about masks and distancing, and to a wholesale lifting of restrictions on indoor dining, sporting events and more. Or … not.
“The single biggest lesson I’ve learned during the pandemic is that epidemiological modeling struggles with prediction, because so much of it depends on human behavioral factors,” said Carl Bergstrom, a biologist at the University of Washington in Seattle.
Taking into account the counterbalancing rises in both vaccinations and variants, along with the high likelihood that people will stop taking precautions, a fourth wave is highly likely this spring, the majority of experts told The Times.
Kristian Andersen, a virologist at the Scripps Research Institute in San Diego, said he was confident that the number of cases will continue to decline, then plateau in about a month. After mid-March, the curve in new cases will swing upward again.
In early to mid-April, “we’re going to start seeing hospitalizations go up,” he said. “It’s just a question of how much.”
Summer will feel like summer again, sort of.
Credit: Kendrick Brinson for The New York Times
Now the good news.
Despite the uncertainties, the experts predict that the last surge will subside in the United States sometime in the early summer. If the Biden administration can keep its promise to immunize every American adult by the end of the summer, the variants should be no match for the vaccines.
Combine vaccination with natural immunity and the human tendency to head outdoors as weather warms, and “it may not be exactly herd immunity, but maybe it’s sufficient to prevent any large outbreaks,” said Youyang Gu, an independent data scientist, who created some of the most prescient models of the pandemic.
Infections will continue to drop. More important, hospitalizations and deaths will fall to negligible levels — enough, hopefully, to reopen the country.
“Sometimes people lose vision of the fact that vaccines prevent hospitalization and death, which is really actually what most people care about,” said Stefan Baral, an epidemiologist at the Johns Hopkins Bloomberg School of Public Health.
Even as the virus begins its swoon, people may still need to wear masks in public places and maintain social distance, because a significant percent of the population — including children — will not be immunized.
“Assuming that we keep a close eye on things in the summer and don’t go crazy, I think that we could look forward to a summer that is looking more normal, but hopefully in a way that is more carefully monitored than last summer,” said Emma Hodcroft, a molecular epidemiologist at the University of Bern in Switzerland.
Imagine: Groups of vaccinated people will be able to get together for barbecues and play dates, without fear of infecting one another. Beaches, parks and playgrounds will be full of mask-free people. Indoor dining will return, along with movie theaters, bowling alleys and shopping malls — although they may still require masks.
The virus will still be circulating, but the extent will depend in part on how well vaccines prevent not just illness and death, but also transmission. The data on whether vaccines stop the spread of the disease are encouraging, but immunization is unlikely to block transmission entirely.
Credit: Pete Kiehart for The New York Times
“It’s not zero and it’s not 100 — exactly where that number is will be important,” said Shweta Bansal, an infectious disease modeler at Georgetown University. “It needs to be pretty darn high for us to be able to get away with vaccinating anything below 100 percent of the population, so that’s definitely something we’re watching.”
Over the long term — say, a year from now, when all the adults and children in the United States who want a vaccine have received them — will this virus finally be behind us?
Every expert interviewed by The Times said no. Even after the vast majority of the American population has been immunized, the virus will continue to pop up in clusters, taking advantage of pockets of vulnerability. Years from now, the coronavirus may be an annoyance, circulating at low levels, causing modest colds.
Many scientists said their greatest worry post-pandemic was that new variants may turn out to be significantly less susceptible to the vaccines. Billions of people worldwide will remain unprotected, and each infection gives the virus new opportunities to mutate.
“We won’t have useless vaccines. We might have slightly less good vaccines than we have at the moment,” said Andrew Read, an evolutionary microbiologist at Penn State University. “That’s not the end of the world, because we have really good vaccines right now.”
For now, every one of us can help by continuing to be careful for just a few more months, until the curve permanently flattens.
“Just hang in there a little bit longer,” Dr. Tuite said. “There’s a lot of optimism and hope, but I think we need to be prepared for the fact that the next several months are likely to continue to be difficult.”
Christopher Flavelle, Brad Plumer, Hiroko Tabuchi – Feb 20, 2021
Traffic at a standstill on Interstate 35 in Kileen, Texas, on Thursday. Credit: Joe Raedle/Getty Images
Continent-spanning storms triggered blackouts in Oklahoma and Mississippi, halted one-third of U.S. oil production and disrupted vaccinations in 20 states.
Even as Texas struggled to restore electricity and water over the past week, signs of the risks posed by increasingly extreme weather to America’s aging infrastructure were cropping up across the country.
The week’s continent-spanning winter storms triggered blackouts in Texas, Oklahoma, Mississippi and several other states. One-third of oil production in the nation was halted. Drinking-water systems in Ohio were knocked offline. Road networks nationwide were paralyzed and vaccination efforts in 20 states were disrupted.
The crisis carries a profound warning. As climate change brings more frequent and intense storms, floods, heat waves, wildfires and other extreme events, it is placing growing stress on the foundations of the country’s economy: Its network of roads and railways, drinking-water systems, power plants, electrical grids, industrial waste sites and even homes. Failures in just one sector can set off a domino effect of breakdowns in hard-to-predict ways.
Much of this infrastructure was built decades ago, under the expectation that the environment around it would remain stable, or at least fluctuate within predictable bounds. Now climate change is upending that assumption.
“We are colliding with a future of extremes,” said Alice Hill, who oversaw planning for climate risks on the National Security Council during the Obama administration. “We base all our choices about risk management on what’s occurred in the past, and that is no longer a safe guide.”
Sewer systems are overflowing more often as powerful rainstorms exceed their design capacity. Coastal homes and highways are collapsing as intensified runoff erodes cliffs. Coal ash, the toxic residue produced by coal-burning plants, is spilling into rivers as floods overwhelm barriers meant to hold it back. Homes once beyond the reach of wildfires are burning in blazes they were never designed to withstand.
Credit: Matt Williamson/The Enterprise-Journal, via Associated Press
Problems like these often reflect an inclination of governments to spend as little money as possible, said Shalini Vajjhala, a former Obama administration official who now advises cities on meeting climate threats. She said it’s hard to persuade taxpayers to spend extra money to guard against disasters that seem unlikely.
But climate change flips that logic, making inaction far costlier. “The argument I would make is, we can’t afford not to, because we’re absorbing the costs” later, Ms. Vajjhala said, after disasters strike. “We’re spending poorly.”
The Biden administration has talked extensively about climate change, particularly the need to reduce greenhouse gas emissions and create jobs in renewable energy. But it has spent less time discussing how to manage the growing effects of climate change, facing criticism from experts for not appointing more people who focus on climate resilience.
“I am extremely concerned by the lack of emergency-management expertise reflected in Biden’s climate team,” said Samantha Montano, an assistant professor at the Massachusetts Maritime Academy who focuses on disaster policy. “There’s an urgency here that still is not being reflected.”
A White House spokesman, Vedant Patel, said in a statement, “Building resilient and sustainable infrastructure that can withstand extreme weather and a changing climate will play an integral role in creating millions of good paying, union jobs” while cutting greenhouse gas emissions.
And while President Biden has called for a major push to refurbish and upgrade the nation’s infrastructure, getting a closely divided Congress to spend hundreds of billions, if not trillions of dollars, will be a major challenge.
Heightening the cost to society, disruptions can disproportionately affect lower-income households and other vulnerable groups, including older people or those with limited English.
“All these issues are converging,” said Robert D. Bullard, a professor at Texas Southern University who studies wealth and racial disparities related to the environment. “And there’s simply no place in this country that’s not going to have to deal with climate change.”
Many forms of water crisis
Credit: Matthew Hatcher/Getty Images
In September, when a sudden storm dumped a record of more than two inches of water on Washington in less than 75 minutes, the result wasn’t just widespread flooding, but also raw sewage rushing into hundreds of homes.
Washington, like many other cities in the Northeast and Midwest, relies on what’s called a combined sewer overflow system: If a downpour overwhelms storm drains along the street, they are built to overflow into the pipes that carry raw sewage. But if there’s too much pressure, sewage can be pushed backward, into people’s homes — where the forces can send it erupting from toilets and shower drains.
This is what happened in Washington. The city’s system was built in the late 1800s. Now, climate change is straining an already outdated design.
DC Water, the local utility, is spending billions of dollars so that the system can hold more sewage. “We’re sort of in uncharted territory,” said Vincent Morris, a utility spokesman.
The challenge of managing and taming the nation’s water supplies — whether in streets and homes, or in vast rivers and watersheds — is growing increasingly complex as storms intensify. Last May, rain-swollen flooding breached two dams in Central Michigan, forcing thousands of residents to flee their homes and threatening a chemical complex and toxic waste cleanup site. Experts warned it was unlikely to be the last such failure.
Many of the country’s 90,000 dams were built decades ago and were already in dire need of repairs. Now climate change poses an additional threat, bringing heavier downpours to parts of the country and raising the odds that some dams could be overwhelmed by more water than they were designed to handle. One recent study found that most of California’s biggest dams were at increased risk of failure as global warming advances.
In recent years, dam-safety officials have begun grappling with the dangers. Colorado, for instance, now requires dam builders to take into account the risk of increased atmospheric moisture driven by climate change as they plan for worst-case flooding scenarios.
But nationwide, there remains a backlog of thousands of older dams that still need to be rehabilitated or upgraded. The price tag could ultimately stretch to more than $70 billion.
“Whenever we study dam failures, we often find there was a lot of complacency beforehand,” said Bill McCormick, president of the Association of State Dam Safety Officials. But given that failures can have catastrophic consequences, “we really can’t afford to be complacent.”
Built for a different future
Credit: Tamir Kalifa for The New York Times
If the Texas blackouts exposed one state’s poor planning, they also provide a warning for the nation: Climate change threatens virtually every aspect of electricity grids that aren’t always designed to handle increasingly severe weather. The vulnerabilities show up in power lines, natural-gas plants, nuclear reactors and myriad other systems.
Higher storm surges can knock out coastal power infrastructure. Deeper droughts can reduce water supplies for hydroelectric dams. Severe heat waves can reduce the efficiency of fossil-fuel generators, transmission lines and even solar panels at precisely the moment that demand soars because everyone cranks up their air-conditioners.
Climate hazards can also combine in new and unforeseen ways.
In California recently, Pacific Gas & Electric has had to shut off electricity to thousands of people during exceptionally dangerous fire seasons. The reason: Downed power lines can spark huge wildfires in dry vegetation. Then, during a record-hot August last year, several of the state’s natural gas plants malfunctioned in the heat, just as demand was spiking, contributing to blackouts.
“We have to get better at understanding these compound impacts,” said Michael Craig, an expert in energy systems at the University of Michigan who recently led a study looking at how rising summer temperatures in Texas could strain the grid in unexpected ways. “It’s an incredibly complex problem to plan for.”
Some utilities are taking notice. After Superstorm Sandy in 2012 knocked out power for 8.7 million customers, utilities in New York and New Jersey invested billions in flood walls, submersible equipment and other technology to reduce the risk of failures. Last month, New York’s Con Edison said it would incorporate climate projections into its planning.
As freezing temperatures struck Texas, a glitch at one of two reactors at a South Texas nuclear plant, which serves 2 million homes, triggered a shutdown. The cause: Sensing lines connected to the plant’s water pumps had frozen, said Victor Dricks, a spokesman for the federal Nuclear Regulatory Agency.
It’s also common for extreme heat to disrupt nuclear power. The issue is that the water used to cool reactors can become too warm to use, forcing shutdowns.
Flooding is another risk.
After a tsunami led to several meltdowns at Japan’s Fukushima Daiichi power plant in 2011, the U.S. Nuclear Regulatory Commission told the 60 or so working nuclear plants in the United States, many decades old, to evaluate their flood risk to account for climate change. Ninety percent showed at least one type of flood risk that exceeded what the plant was designed to handle.
The greatest risk came from heavy rain and snowfall exceeding the design parameters at 53 plants.
Scott Burnell, an Nuclear Regulatory Commission spokesman, said in a statement, “The NRC continues to conclude, based on the staff’s review of detailed analyses, that all U.S. nuclear power plants can appropriately deal with potential flooding events, including the effects of climate change, and remain safe.”
Several climate-related risks appeared to have converged to heighten the danger. Rising seas and higher storm surges have intensified coastal erosion, while more extreme bouts of precipitation have increased the landslide risk.
Add to that the effects of devastating wildfires, which can damage the vegetation holding hillside soil in place, and “things that wouldn’t have slid without the wildfires, start sliding,” said Jennifer M. Jacobs, a professor of civil and environmental engineering at the University of New Hampshire. “I think we’re going to see more of that.”
The United States depends on highways, railroads and bridges as economic arteries for commerce, travel and simply getting to work. But many of the country’s most important links face mounting climate threats. More than 60,000 miles of roads and bridges in coastal floodplains are already vulnerable to extreme storms and hurricanes, government estimates show. And inland flooding could also threaten at least 2,500 bridges across the country by 2050, a federal climate report warned in 2018.
Sometimes even small changes can trigger catastrophic failures. Engineers modeling the collapse of bridges over Escambia Bay in Florida during Hurricane Ivan in 2004 found that the extra three inches of sea-level rise since the bridge was built in 1968 very likely contributed to the collapse, because of the added height of the storm surge and force of the waves.
“A lot of our infrastructure systems have a tipping point. And when you hit the tipping point, that’s when a failure occurs,” Dr. Jacobs said. “And the tipping point could be an inch.”
Crucial rail networks are at risk, too. In 2017, Amtrak consultants found that along parts of the Northeast corridor, which runs from Boston to Washington and carries 12 million people a year, flooding and storm surge could erode the track bed, disable the signals and eventually put the tracks underwater.
And there is no easy fix. Elevating the tracks would require also raising bridges, electrical wires and lots of other infrastructure, and moving them would mean buying new land in a densely packed part of the country. So the report recommended flood barriers, costing $24 million per mile, that must be moved into place whenever floods threaten.
The blasts at the plant came after flooding knocked out the site’s electrical supply, shutting down refrigeration systems that kept volatile chemicals stable. Almost two dozen people, many of them emergency workers, were treated for exposure to the toxic fumes, and some 200 nearby residents were evacuated from their homes.
More than 2,500 facilities that handle toxic chemicals lie in federal flood-prone areas across the country, about 1,400 of them in areas at the highest risk of flooding, a New York Times analysis showed in 2018.
Leaks from toxic cleanup sites, left behind by past industry, pose another threat.
Almost two-thirds of some 1,500 superfund cleanup sites across the country are in areas with an elevated risk of flooding, storm surge, wildfires or sea level rise, a government audit warned in 2019. Coal ash, a toxic substance produced by coal power plants that is often stored as sludge in special ponds, have been particularly exposed. After Hurricane Florence in 2018, for example, a dam breach at the site of a power plant in Wilmington, N.C., released the hazardous ash into a nearby river.
“We should be evaluating whether these facilities or sites actually have to be moved or re-secured,” said Lisa Evans, senior counsel at Earthjustice, an environmental law organization. Places that “may have been OK in 1990,” she said, “may be a disaster waiting to happen in 2021.”
Credit: Bronte Wittpenn/Austin American-Statesman, via Associated Press
Systems are designed to handle spikes in demand, but the wild and unpredictable weather linked to global warming will very likely push grids beyond their limits.
Credit: Tamir Kalifa for The New York Times
Published Feb. 16, 2021Updated Feb. 17, 2021, 6:59 a.m. ET
Huge winter storms plunged large parts of the central and southern United States into an energy crisis this week, with frigid blasts of Arctic weather crippling electric grids and leaving millions of Americans without power amid dangerously cold temperatures.
The grid failures were most severe in Texas, where more than four million people woke up Tuesday morning to rolling blackouts. Separate regional grids in the Southwest and Midwest also faced serious strain. As of Tuesday afternoon, at least 23 people nationwide had died in the storm or its aftermath.
Analysts have begun to identify key factors behind the grid failures in Texas. Record-breaking cold weather spurred residents to crank up their electric heaters and pushed power demand beyond the worst-case scenarios that grid operators had planned for. At the same time, a large fraction of the state’s gas-fired power plants were knocked offline amid icy conditions, with some plants suffering fuel shortages as natural gas demand spiked. Many of Texas’ wind turbines also froze and stopped working.
The crisis sounded an alarm for power systems throughout the country. Electric grids can be engineered to handle a wide range of severe conditions — as long as grid operators can reliably predict the dangers ahead. But as climate change accelerates, many electric grids will face extreme weather events that go far beyond the historical conditions those systems were designed for, putting them at risk of catastrophic failure.
Measures that could help make electric grids more robust — such as fortifying power plants against extreme weather, or installing more backup power sources — could prove expensive. But as Texas shows, blackouts can be extremely costly, too. And, experts said, unless grid planners start planning for increasingly wild and unpredictable climate conditions, grid failures will happen again and again.
“It’s essentially a question of how much insurance you want to buy,” said Jesse Jenkins, an energy systems engineer at Princeton University. “What makes this problem even harder is that we’re now in a world where, especially with climate change, the past is no longer a good guide to the future. We have to get much better at preparing for the unexpected.”
A System Pushed to the Limit
Texas’ main electric grid, which largely operates independently from the rest of the country, has been built with the state’s most common weather extremes in mind: soaring summer temperatures that cause millions of Texans to turn up their air-conditioners all at once.
While freezing weather is rarer, grid operators in Texas have also long known that electricity demand can spike in the winter, particularly after damaging cold snaps in 2011 and 2018. But this week’s winter storms, which buried the state in snow and ice, and led to record-cold temperatures, surpassed all expectations — and pushed the grid to its breaking point.
Credit: Juan Figueroa/The Dallas Morning News, via Associated Press
Texas’ grid operators had anticipated that, in the worst case, the state would use 67 gigawatts of electricity during the winter peak. But by Sunday evening, power demand had surged past that level. As temperatures dropped, many homes were relying on older, inefficient electric heaters that consume more power.
The problems compounded from there, with frigid weather on Monday disabling power plants with capacity totaling more than 30 gigawatts. The vast majority of those failures occurred at thermal power plants, like natural gas generators, as plummeting temperatures paralyzed plant equipment and soaring demand for natural gas left some plants struggling to obtain sufficient fuel. A number of the state’s power plants were also offline for scheduled maintenance in preparation for the summer peak.
The state’s fleet of wind farms also lost up to 4.5 gigawatts of capacity at times, as many turbines stopped working in cold and icy conditions, though this was a smaller part of the problem.
In essence, experts said, an electric grid optimized to deliver huge quantities of power on the hottest days of the year was caught unprepared when temperatures plummeted.
While analysts are still working to untangle all of the reasons behind Texas’ grid failures, some have also wondered whether the unique way the state manages its largely deregulated electricity system may have played a role. In the mid-1990s, for instance, Texas decided against paying energy producers to hold a fixed number of backup power plants in reserve, instead letting market forces dictate what happens on the grid.
On Tuesday, Gov. Greg Abbott called for an emergency reform of the Electric Reliability Council of Texas, the nonprofit corporation that oversees the flow of power in the state, saying its performance had been “anything but reliable” over the previous 48 hours.
‘A Difficult Balancing Act’
In theory, experts said, there are technical solutions that can avert such problems.
Wind turbines can be equipped with heaters and other devices so that they can operate in icy conditions — as is often done in the upper Midwest, where cold weather is more common. Gas plants can be built to store oil on-site and switch over to burning the fuel if needed, as is often done in the Northeast, where natural gas shortages are common. Grid regulators can design markets that pay extra to keep a larger fleet of backup power plants in reserve in case of emergencies, as is done in the Mid-Atlantic.
But these solutions all cost money, and grid operators are often wary of forcing consumers to pay extra for safeguards.
“Building in resilience often comes at a cost, and there’s a risk of both underpaying but also of overpaying,” said Daniel Cohan, an associate professor of civil and environmental engineering at Rice University. “It’s a difficult balancing act.”
In the months ahead, as Texas grid operators and policymakers investigate this week’s blackouts, they will likely explore how the grid might be bolstered to handle extremely cold weather. Some possible ideas include: Building more connections between Texas and other states to balance electricity supplies, a move the state has long resisted; encouraging homeowners to install battery backup systems; or keeping additional power plants in reserve.
The search for answers will be complicated by climate change. Over all, the state is getting warmer as global temperatures rise, and cold-weather extremes are, on average, becoming less common over time.
But some climate scientists have also suggested that global warming could, paradoxically, bring more unusually fierce winter storms. Some research indicates that Arctic warming is weakening the jet stream, the high-level air current that circles the northern latitudes and usually holds back the frigid polar vortex. This can allow cold air to periodically escape to the South, resulting in episodes of bitter cold in places that rarely get nipped by frost.
ImageCredit: Jacob Ford/Odessa American, via Associated Press
But this remains an active area of debate among climate scientists, with some experts less certain that polar vortex disruptions are becoming more frequent, making it even trickier for electricity planners to anticipate the dangers ahead.
All over the country, utilities and grid operators are confronting similar questions, as climate change threatens to intensify heat waves, floods, water shortages and other calamities, all of which could create novel risks for the nation’s electricity systems. Adapting to those risks could carry a hefty price tag: One recent study found that the Southeast alone may need 35 percent more electric capacity by 2050 simply to deal with the known hazards of climate change.
And the task of building resilience is becoming increasingly urgent. Many policymakers are promoting electric cars and electric heating as a way of curbing greenhouse gas emissions. But as more of the nation’s economy depends on reliable flows of electricity, the cost of blackouts will become ever more dire.
“This is going to be a significant challenge,” said Emily Grubert, an infrastructure expert at Georgia Tech. “We need to decarbonize our power systems so that climate change doesn’t keep getting worse, but we also need to adapt to changing conditions at the same time. And the latter alone is going to be very costly. We can already see that the systems we have today aren’t handling this very well.”
John Schwartz, Dave Montgomery and Ivan Penn contributed reporting.
The world’s continuously warming climate is revealed also in contemporary ice melt at glaciers, such as with this one in the Kenai mountains, Alaska (seen September 2019). Photograph: Joe Raedle/Getty Images
The planet is hotter now than it has been for at least 12,000 years, a period spanning the entire development of human civilisation, according to research.
Analysis of ocean surface temperatures shows human-driven climate change has put the world in “uncharted territory”, the scientists say. The planet may even be at its warmest for 125,000 years, although data on that far back is less certain.
The research, published in the journal Nature, reached these conclusions by solving a longstanding puzzle known as the “Holocene temperature conundrum”. Climate models have indicated continuous warming since the last ice age ended 12,000 years ago and the Holocene period began. But temperature estimates derived from fossil shells showed a peak of warming 6,000 years ago and then a cooling, until the industrial revolution sent carbon emissions soaring.
This conflict undermined confidence in the climate models and the shell data. But it was found that the shell data reflected only hotter summers and missed colder winters, and so was giving misleadingly high annual temperatures.
“We demonstrate that global average annual temperature has been rising over the last 12,000 years, contrary to previous results,” said Samantha Bova, at Rutgers University–New Brunswick in the US, who led the research. “This means that the modern, human-caused global warming period is accelerating a long-term increase in global temperatures, making today completely uncharted territory. It changes the baseline and emphasises just how critical it is to take our situation seriously.”
The world may be hotter now than any time since about 125,000 years ago, which was the last warm period between ice ages. However, scientists cannot be certain as there is less data relating to that time.
One study, published in 2017, suggested that global temperatures were last as high as today 115,000 years ago, but that was based on less data.
The new research is published in the journal Nature and examined temperature measurements derived from the chemistry of tiny shells and algal compounds found in cores of ocean sediments, and solved the conundrum by taking account of two factors.
First, the shells and organic materials had been assumed to represent the entire year but in fact were most likely to have formed during summer when the organisms bloomed. Second, there are well-known predictable natural cycles in the heating of the Earth caused by eccentricities in the orbit of the planet. Changes in these cycles can lead to summers becoming hotter and winters colder while average annual temperatures change only a little.
Combining these insights showed that the apparent cooling after the warm peak 6,000 years ago, revealed by shell data, was misleading. The shells were in fact only recording a decline in summer temperatures, but the average annual temperatures were still rising slowly, as indicated by the models.
“Now they actually match incredibly well and it gives us a lot of confidence that our climate models are doing a really good job,” said Bova.
The study looked only at ocean temperature records, but Bova said: “The temperature of the sea surface has a really controlling impact on the climate of the Earth. If we know that, it is the best indicator of what global climate is doing.”
She led a research voyage off the coast of Chile in 2020 to take more ocean sediment cores and add to the available data.
Jennifer Hertzberg, of Texas A&M University in the US, said: “By solving a conundrum that has puzzled climate scientists for years, Bova and colleagues’ study is a major step forward. Understanding past climate change is crucial for putting modern global warming in context.”
Lijing Cheng, at the International Centre for Climate and Environment Sciences in Beijing, China, recently led a study that showed that in 2020 the world’s oceans reached their hottest level yet in instrumental records dating back to the 1940s. More than 90% of global heating is taken up by the seas.
Cheng said the new research was useful and intriguing. It provided a method to correct temperature data from shells and could also enable scientists to work out how much heat the ocean absorbed before the industrial revolution, a factor little understood.
The level of carbon dioxide today is at its highest for about 4m years and is rising at the fastest rate for 66m years. Further rises in temperature and sea level are inevitable until greenhouse gas emissions are cut to net zero.
Audrey Azoulay: Director-General, Unesco How will AI shape our lives post-Covid?
Covid-19 is a test like no other. Never before have the lives of so many people around the world been affected at this scale or speed.
Over the past six months, thousands of AI innovations have sprung up in response to the challenges of life under lockdown. Governments are mobilising machine-learning in many ways, from contact-tracing apps to telemedicine and remote learning.
However, as the digital transformation accelerates exponentially, it is highlighting the challenges of AI. Ethical dilemmas are already a reality – including privacy risks and discriminatory bias.
It is up to us to decide what we want AI to look like: there is a legislative vacuum that needs to be filled now. Principles such as proportionality, inclusivity, human oversight and transparency can create a framework allowing us to anticipate these issues.
This is why Unesco is working to build consensus among 193 countries to lay the ethical foundations of AI. Building on these principles, countries will be able to develop national policies that ensure AI is designed, developed and deployed in compliance with fundamental human values.
As we face new, previously unimaginable challenges – like the pandemic – we must ensure that the tools we are developing work for us, and not against us.
Earlier this summer, the Summit supercomputer at Oak Ridge National Lab in Tennessee set about crunching data on more than 40,000 genes from 17,000 genetic samples in an effort to better understand Covid-19. Summit is the second-fastest computer in the world, but the process — which involved analyzing 2.5 billion genetic combinations — still took more than a week.
When Summit was done, researchers analyzed the results. It was, in the words of Dr. Daniel Jacobson, lead researcher and chief scientist for computational systems biology at Oak Ridge, a “eureka moment.” The computer had revealed a new theory about how Covid-19 impacts the body: the bradykinin hypothesis. The hypothesis provides a model that explains many aspects of Covid-19, including some of its most bizarre symptoms. It also suggests 10-plus potential treatments, many of which are already FDA approved. Jacobson’s group published their results in a paper in the journal eLife in early July.
According to the team’s findings, a Covid-19 infection generally begins when the virus enters the body through ACE2 receptors in the nose, (The receptors, which the virus is known to target, are abundant there.) The virus then proceeds through the body, entering cells in other places where ACE2 is also present: the intestines, kidneys, and heart. This likely accounts for at least some of the disease’s cardiac and GI symptoms.
But once Covid-19 has established itself in the body, things start to get really interesting. According to Jacobson’s group, the data Summit analyzed shows that Covid-19 isn’t content to simply infect cells that already express lots of ACE2 receptors. Instead, it actively hijacks the body’s own systems, tricking it into upregulating ACE2 receptors in places where they’re usually expressed at low or medium levels, including the lungs.
In this sense, Covid-19 is like a burglar who slips in your unlocked second-floor window and starts to ransack your house. Once inside, though, they don’t just take your stuff — they also throw open all your doors and windows so their accomplices can rush in and help pillage more efficiently.
The renin–angiotensin system (RAS) controls many aspects of the circulatory system, including the body’s levels of a chemical called bradykinin, which normally helps to regulate blood pressure. According to the team’s analysis, when the virus tweaks the RAS, it causes the body’s mechanisms for regulating bradykinin to go haywire. Bradykinin receptors are resensitized, and the body also stops effectively breaking down bradykinin. (ACE normally degrades bradykinin, but when the virus downregulates it, it can’t do this as effectively.)
The end result, the researchers say, is to release a bradykinin storm — a massive, runaway buildup of bradykinin in the body. According to the bradykinin hypothesis, it’s this storm that is ultimately responsible for many of Covid-19’s deadly effects. Jacobson’s team says in their paper that “the pathology of Covid-19 is likely the result of Bradykinin Storms rather than cytokine storms,” which had been previously identified in Covid-19 patients, but that “the two may be intricately linked.” Other papers had previously identified bradykinin storms as a possible cause of Covid-19’s pathologies.
Covid-19 is like a burglar who slips in your unlocked second-floor window and starts to ransack your house.
As bradykinin builds up in the body, it dramatically increases vascular permeability. In short, it makes your blood vessels leaky. This aligns with recent clinical data, which increasingly views Covid-19 primarily as a vascular disease, rather than a respiratory one. But Covid-19 still has a massive effect on the lungs. As blood vessels start to leak due to a bradykinin storm, the researchers say, the lungs can fill with fluid. Immune cells also leak out into the lungs, Jacobson’s team found, causing inflammation.
And Covid-19 has another especially insidious trick. Through another pathway, the team’s data shows, it increases production of hyaluronic acid (HLA) in the lungs. HLA is often used in soaps and lotions for its ability to absorb more than 1,000 times its weight in fluid. When it combines with fluid leaking into the lungs, the results are disastrous: It forms a hydrogel, which can fill the lungs in some patients. According to Jacobson, once this happens, “it’s like trying to breathe through Jell-O.”
This may explain why ventilators have proven less effective in treating advanced Covid-19 than doctors originally expected, based on experiences with other viruses. “It reaches a point where regardless of how much oxygen you pump in, it doesn’t matter, because the alveoli in the lungs are filled with this hydrogel,” Jacobson says. “The lungs become like a water balloon.” Patients can suffocate even while receiving full breathing support.
The bradykinin hypothesis also extends to many of Covid-19’s effects on the heart. About one in five hospitalized Covid-19 patients have damage to their hearts, even if they never had cardiac issues before. Some of this is likely due to the virus infecting the heart directly through its ACE2 receptors. But the RAS also controls aspects of cardiac contractions and blood pressure. According to the researchers, bradykinin storms could create arrhythmias and low blood pressure, which are often seen in Covid-19 patients.
The bradykinin hypothesis also accounts for Covid-19’s neurological effects, which are some of the most surprising and concerning elements of the disease. These symptoms (which include dizziness, seizures, delirium, and stroke) are present in as many as half of hospitalized Covid-19 patients. According to Jacobson and his team, MRI studies in France revealed that many Covid-19 patients have evidence of leaky blood vessels in their brains.
Bradykinin — especially at high doses — can also lead to a breakdown of the blood-brain barrier. Under normal circumstances, this barrier acts as a filter between your brain and the rest of your circulatory system. It lets in the nutrients and small molecules that the brain needs to function, while keeping out toxins and pathogens and keeping the brain’s internal environment tightly regulated.
If bradykinin storms cause the blood-brain barrier to break down, this could allow harmful cells and compounds into the brain, leading to inflammation, potential brain damage, and many of the neurological symptoms Covid-19 patients experience. Jacobson told me, “It is a reasonable hypothesis that many of the neurological symptoms in Covid-19 could be due to an excess of bradykinin. It has been reported that bradykinin would indeed be likely to increase the permeability of the blood-brain barrier. In addition, similar neurological symptoms have been observed in other diseases that result from an excess of bradykinin.”
Increased bradykinin levels could also account for other common Covid-19 symptoms. ACE inhibitors — a class of drugs used to treat high blood pressure — have a similar effect on the RAS system as Covid-19, increasing bradykinin levels. In fact, Jacobson and his team note in their paper that “the virus… acts pharmacologically as an ACE inhibitor” — almost directly mirroring the actions of these drugs.
By acting like a natural ACE inhibitor, Covid-19 may be causing the same effects that hypertensive patients sometimes get when they take blood pressure–lowering drugs. ACE inhibitors are known to cause a dry cough and fatigue, two textbook symptoms of Covid-19. And they can potentially increase blood potassium levels, which has also been observed in Covid-19 patients. The similarities between ACE inhibitor side effects and Covid-19 symptoms strengthen the bradykinin hypothesis, the researchers say.
ACE inhibitors are also known to cause a loss of taste and smell. Jacobson stresses, though, that this symptom is more likely due to the virus “affecting the cells surrounding olfactory nerve cells” than the direct effects of bradykinin.
Though still an emerging theory, the bradykinin hypothesis explains several other of Covid-19’s seemingly bizarre symptoms. Jacobson and his team speculate that leaky vasculature caused by bradykinin storms could be responsible for “Covid toes,” a condition involving swollen, bruised toes that some Covid-19 patients experience. Bradykinin can also mess with the thyroid gland, which could produce the thyroid symptoms recently observed in some patients.
The bradykinin hypothesis could also explain some of the broader demographic patterns of the disease’s spread. The researchers note that some aspects of the RAS system are sex-linked, with proteins for several receptors (such as one called TMSB4X) located on the X chromosome. This means that “women… would have twice the levels of this protein than men,” a result borne out by the researchers’ data. In their paper, Jacobson’s team concludes that this “could explain the lower incidence of Covid-19 induced mortality in women.” A genetic quirk of the RAS could be giving women extra protection against the disease.
The bradykinin hypothesis provides a model that “contributes to a better understanding of Covid-19” and “adds novelty to the existing literature,” according to scientists Frank van de Veerdonk, Jos WM van der Meer, and Roger Little, who peer-reviewed the team’s paper. It predicts nearly all the disease’s symptoms, even ones (like bruises on the toes) that at first appear random, and further suggests new treatments for the disease.
As Jacobson and team point out, several drugs target aspects of the RAS and are already FDA approved to treat other conditions. They could arguably be applied to treating Covid-19 as well. Several, like danazol, stanozolol, and ecallantide, reduce bradykinin production and could potentially stop a deadly bradykinin storm. Others, like icatibant, reduce bradykinin signaling and could blunt its effects once it’s already in the body.
Interestingly, Jacobson’s team also suggests vitamin D as a potentially useful Covid-19 drug. The vitamin is involved in the RAS system and could prove helpful by reducing levels of another compound, known as REN. Again, this could stop potentially deadly bradykinin storms from forming. The researchers note that vitamin D has already been shown to help those with Covid-19. The vitamin is readily available over the counter, and around 20% of the population is deficient. If indeed the vitamin proves effective at reducing the severity of bradykinin storms, it could be an easy, relatively safe way to reduce the severity of the virus.
Other compounds could treat symptoms associated with bradykinin storms. Hymecromone, for example, could reduce hyaluronic acid levels, potentially stopping deadly hydrogels from forming in the lungs. And timbetasin could mimic the mechanism that the researchers believe protects women from more severe Covid-19 infections. All of these potential treatments are speculative, of course, and would need to be studied in a rigorous, controlled environment before their effectiveness could be determined and they could be used more broadly.
Covid-19 stands out for both the scale of its global impact and the apparent randomness of its many symptoms. Physicians have struggled to understand the disease and come up with a unified theory for how it works. Though as of yet unproven, the bradykinin hypothesis provides such a theory. And like all good hypotheses, it also provides specific, testable predictions — in this case, actual drugs that could provide relief to real patients.
The researchers are quick to point out that “the testing of any of these pharmaceutical interventions should be done in well-designed clinical trials.” As to the next step in the process, Jacobson is clear: “We have to get this message out.” His team’s finding won’t cure Covid-19. But if the treatments it points to pan out in the clinic, interventions guided by the bradykinin hypothesis could greatly reduce patients’ suffering — and potentially save lives.
A simple mathematical mistake may explain why many people underestimate the dangers of coronavirus, shunning social distancing, masks and hand-washing.
Imagine you are offered a deal with your bank, where your money doubles every three days. If you invest just $1 today, roughly how long will it take for you to become a millionaire?
Would it be a year? Six months? 100 days?
The precise answer is 60 days from your initial investment, when your balance would be exactly $1,048,576. Within a further 30 days, you’d have earnt more than a billion. And by the end of the year, you’d have more than $1,000,000,000,000,000,000,000,000,000,000,000,000 – an “undecillion” dollars.
If your estimates were way out, you are not alone. Many people consistently underestimate how fast the value increases – a mistake known as the “exponential growth bias” – and while it may seem abstract, it may have had profound consequences for people’s behaviour this year.
A spate of studies has shown that people who are susceptible to the exponential growth bias are less concerned about Covid-19’s spread, and less likely to endorse measures like social distancing, hand washing or mask wearing. In other words, this simple mathematical error could be costing lives – meaning that the correction of the bias should be a priority as we attempt to flatten curves and avoid second waves of the pandemic around the world.
To understand the origins of this particular bias, we first need to consider different kinds of growth. The most familiar is “linear”. If your garden produces three apples every day, you have six after two days, nine after three days, and so on.
Exponential growth, by contrast, accelerates over time. Perhaps the simplest example is population growth; the more people you have reproducing, the faster the population grows. Or if you have a weed in your pond that triples each day, the number of plants may start out low – just three on day two, and nine on day three – but it soon escalates (see diagram, below).
Many people assume that coronavirus spreads in a linear fashion, but unchecked it’s exponential (Credit: Nigel Hawtin)
Our tendency to overlook exponential growth has been known for millennia. According to an Indian legend, the brahmin Sissa ibn Dahir was offered a prize for inventing an early version of chess. He asked for one grain of wheat to be placed on the first square on the board, two for the second square, four for the third square, doubling each time up to the 64th square. The king apparently laughed at the humility of ibn Dahir’s request – until his treasurers reported that it would outstrip all the food in the land (18,446,744,073,709,551,615 grains in total).
It was only in the late 2000s that scientists started to study the bias formally, with research showing that most people – like Sissa ibn Dahir’s king – intuitively assume that most growth is linear, leading them to vastly underestimate the speed of exponential increase.
These initial studies were primarily concerned with the consequences for our bank balance. Most savings accounts offer compound interest, for example, where you accrue additional interest on the interest you have already earned. This is a classic example of exponential growth, and it means that even low interest rates pay off handsomely over time. If you have a 5% interest rate, then £1,000 invested today will be worth £1,050 next year, and £1,102.50 the year after… which adds up to more than £7,000 in 40 years’ time. Yet most people don’t recognise how much more bang for their buck they will receive if they start investing early, so they leave themselves short for their retirement.
If the number of grains on a chess board doubled for each square, the 64th would ‘hold’ 18 quintillion (Credit: Getty Images)
Surprisingly, a higher level of education does not prevent people from making these errors. Even mathematically trained science students can be vulnerable, says Daniela Sele, who researchs economic decision making at the Swiss Federal Institute of Technology in Zurich. “It does help somewhat, but it doesn’t preclude the bias,” she says.
As I explored in my book The Intelligence Trap, intelligent and educated people often have a “bias blind spot”, believing themselves to be less susceptible to error than others – and the exponential growth bias appears to fall dead in its centre.
Most people will confidently report understanding exponential growth but then still fall for the bias
It was only this year – at the start of the Covid-19 pandemic – that researchers began to consider whether the bias might also influence our understanding of infectious diseases.
According to various epidemiological studies, without intervention the number of new Covid-19 cases doubles every three to four days, which was the reason that so many scientists advised rapid lockdowns to prevent the pandemic from spiralling out of control.
In March, Joris Lammers at the University of Bremen in Germany joined forces with Jan Crusius and Anne Gast at the University of Cologne to roll out online surveys questioning people about the potential spread of the disease. Their results showed that the exponential growth bias was prevalent in people’s understanding of the virus’s spread, with most people vastly underestimating the rate of increase. More importantly, the team found that those beliefs were directly linked to the participants’ views on the best ways to contain the spread. The worse their estimates, the less likely they were to understand the need for social distancing: the exponential growth bias had made them complacent about the official advice.
The charts that politicians show often fail to communicate exponential growth effectively (Credit: Reuters)
This chimes with other findings by Ritwik Banerjee and Priyama Majumda at the Indian Institute of Management in Bangalore, and Joydeep Bhattacharya at Iowa State University. In their study (currently under peer-review), they found susceptibility to the exponential growth bias can predict reduced compliance with the World Health Organization’s recommendations – including mask wearing, handwashing, the use of sanitisers and self-isolation.
The researchers speculate that some of the graphical representations found in the media may have been counter-productive. It’s common for the number of infections to be presented on a “logarithmic scale”, in which the figures on the y-axis increase by a power of 10 (so the gap between 1 and 10 is the same as the gap between 10 and 100, or 100 and 1000).
While this makes it easier to plot different regions with low and high growth rates, it means that exponential growth looks more linear than it really is, which could reinforce the exponential growth bias. “To expect people to use the logarithmic scale to extrapolate the growth path of a disease is to demand a very high level of cognitive ability,” the authors told me in an email. In their view, simple numerical tables may actually be more powerful.
Even a small effort to correct this bias could bring huge benefits
The good news is that people’s views are malleable. When Lammers and colleagues reminded the participants of the exponential growth bias, and asked them to calculate the growth in regular steps over a two week period, people hugely improved their estimates of the disease’s spread – and this, in turn, changed their views on social distancing. Sele, meanwhile, has recently shown that small changes in framing can matter. Emphasising the short amount of time that it will take to reach a large number of cases, for instance – and the time that would be gained by social distancing measures – improves people’s understanding of accelerating growth, rather than simply stating the percentage increase each day.
Lammers believes that the exponential nature of the virus needs to be made more salient in coverage of the pandemic. “I think this study shows how media and government should report on a pandemic in such a situation. Not only report the numbers of today and growth over the past week, but also explain what will happen in the next days, week, month, if the same accelerating growth persists,” he says.
He is confident that even a small effort to correct this bias could bring huge benefits. In the US, where the pandemic has hit hardest, it took only a few months for the virus to infect more than five million people, he says. “If we could have overcome the exponential growth bias and had convinced all Americans of this risk back in March, I am sure 99% would have embraced all possible distancing measures.”
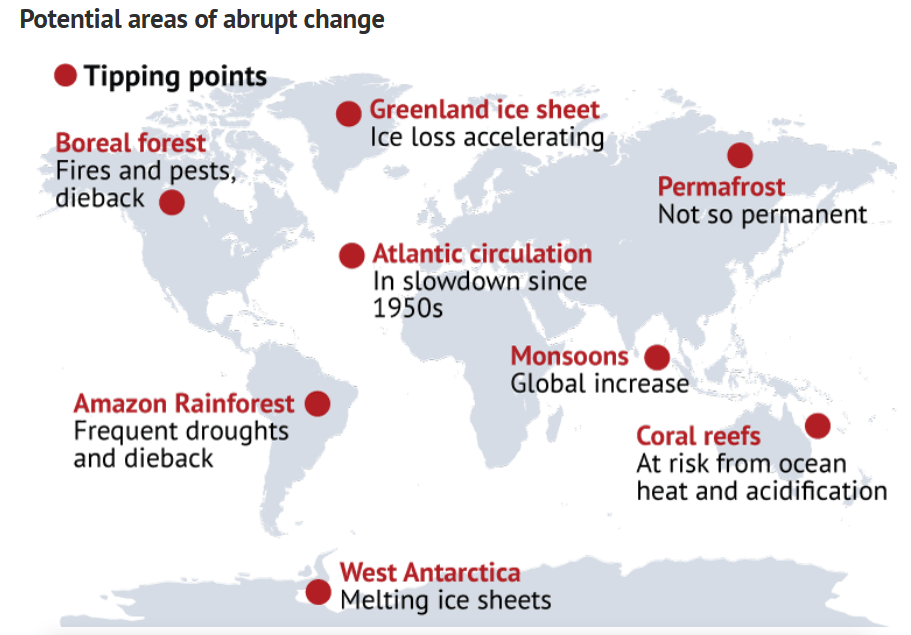
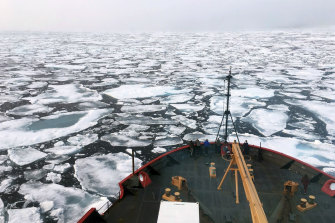
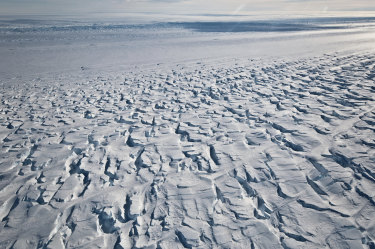

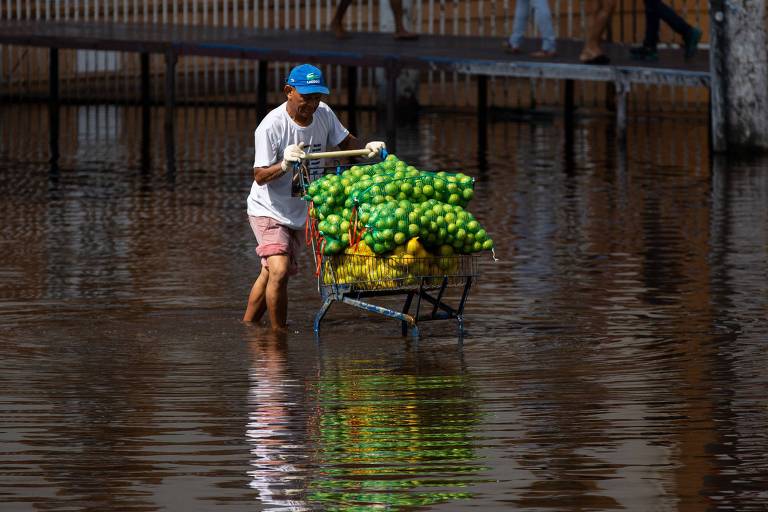


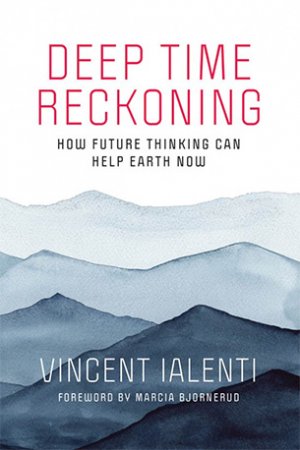

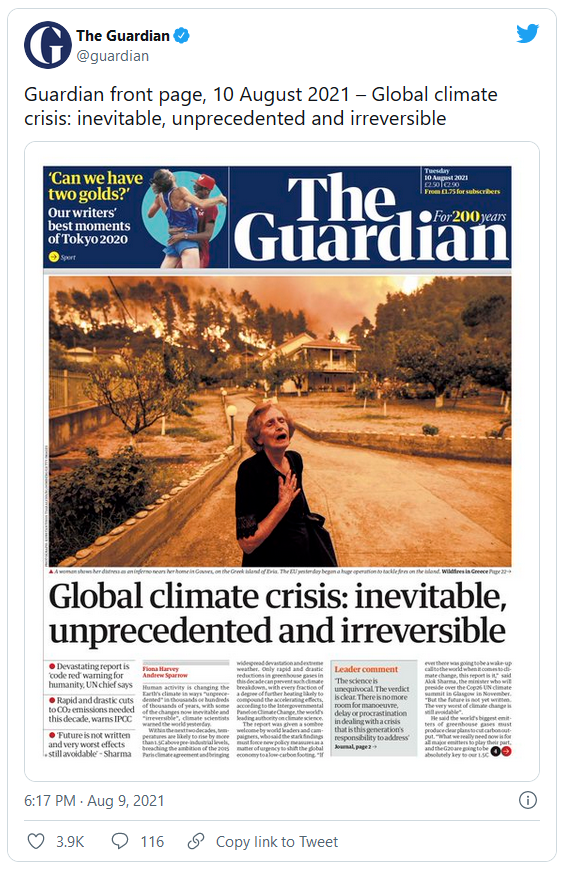









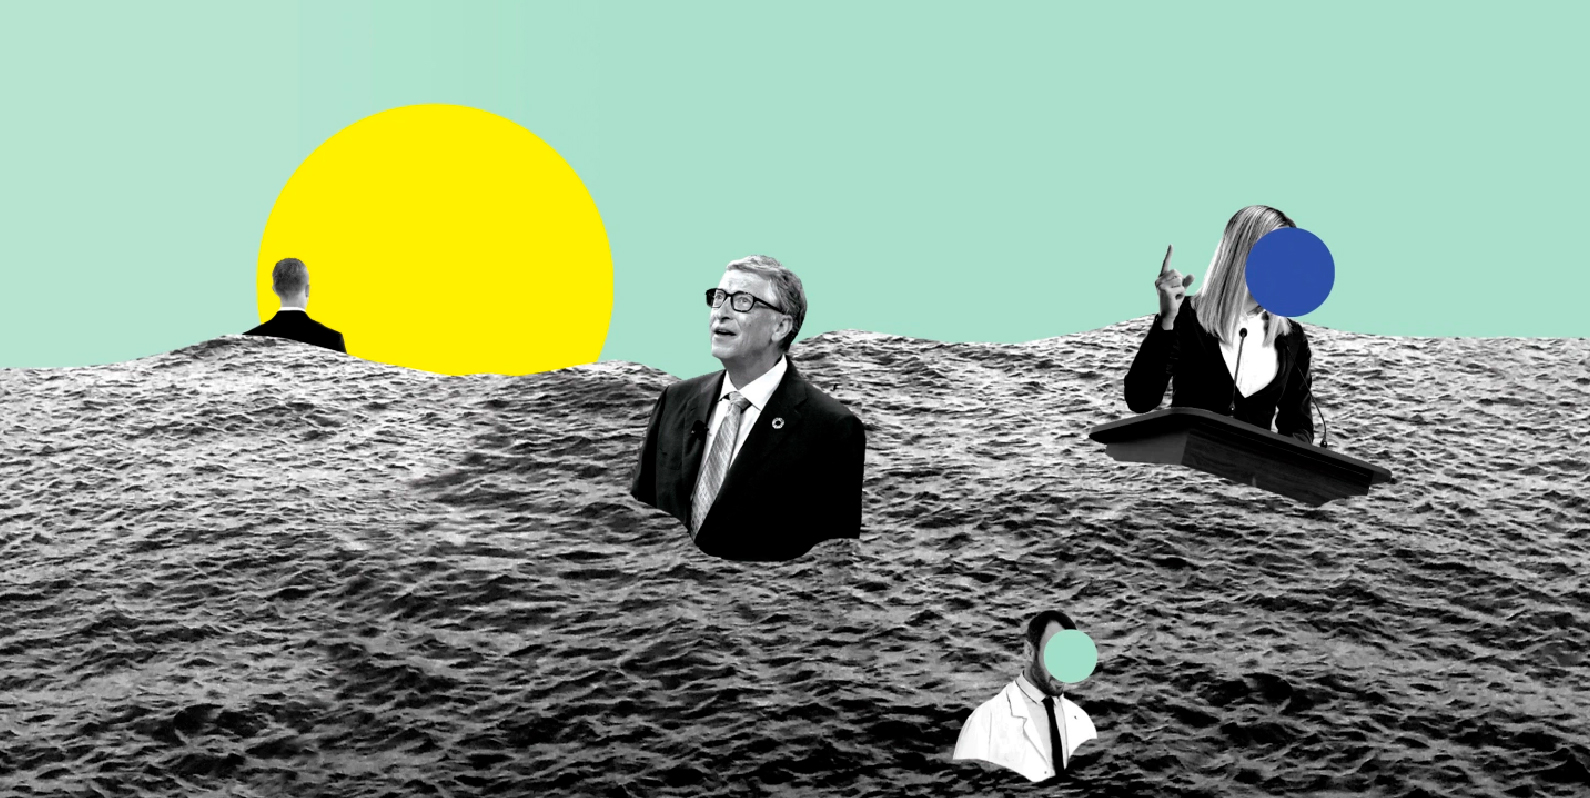

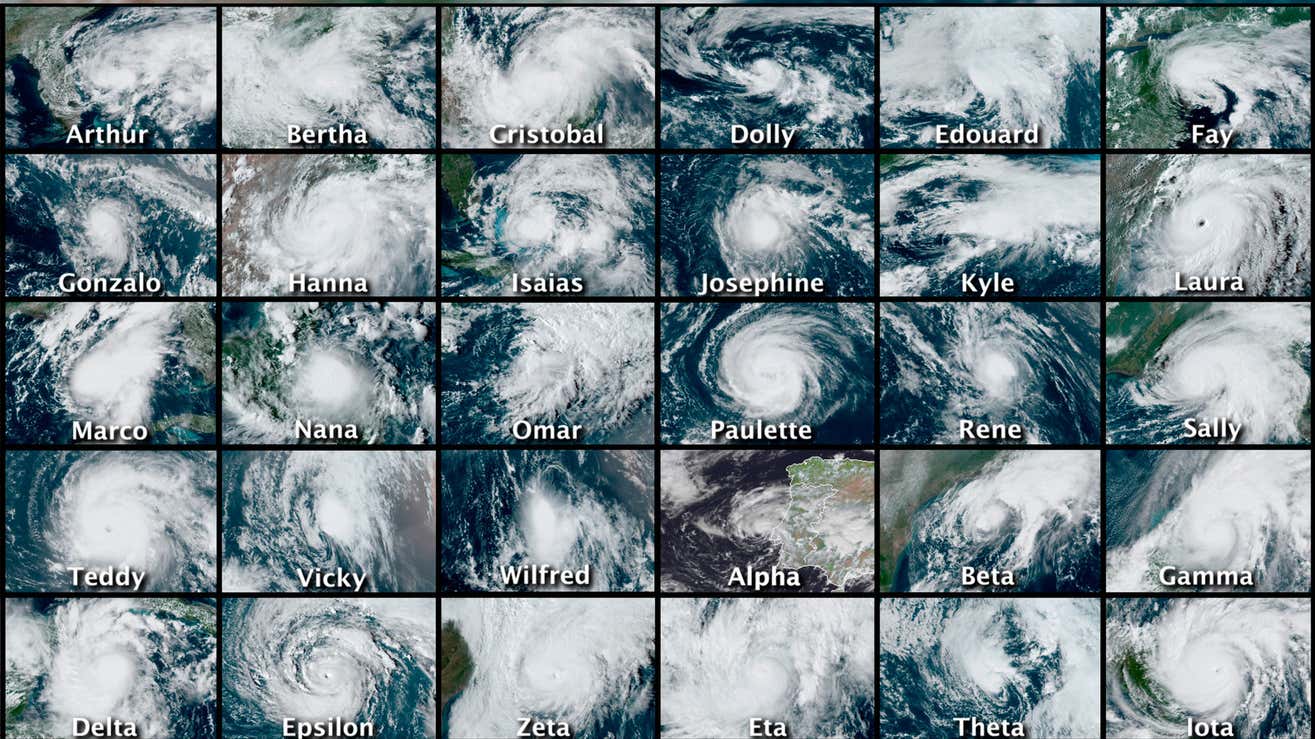


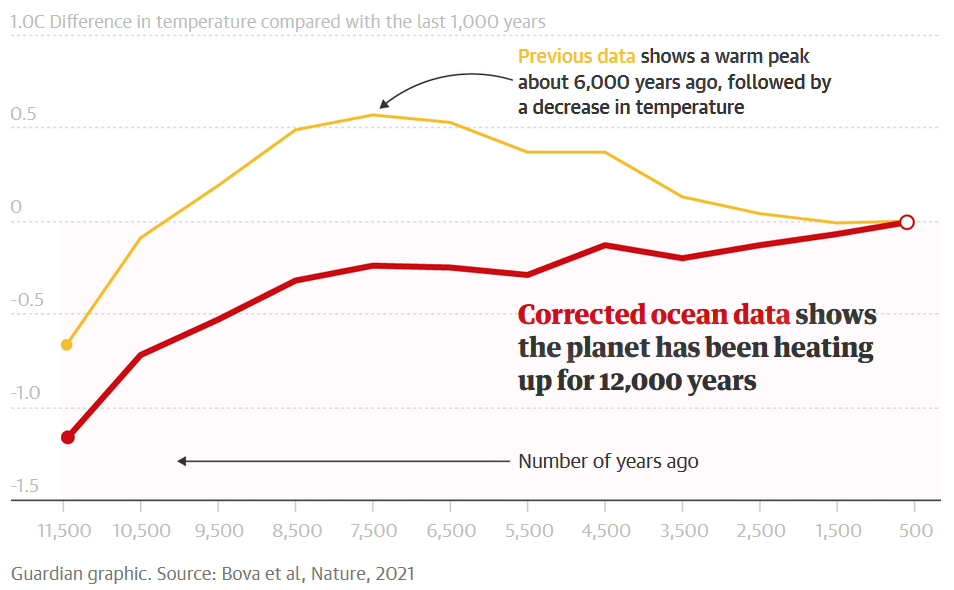
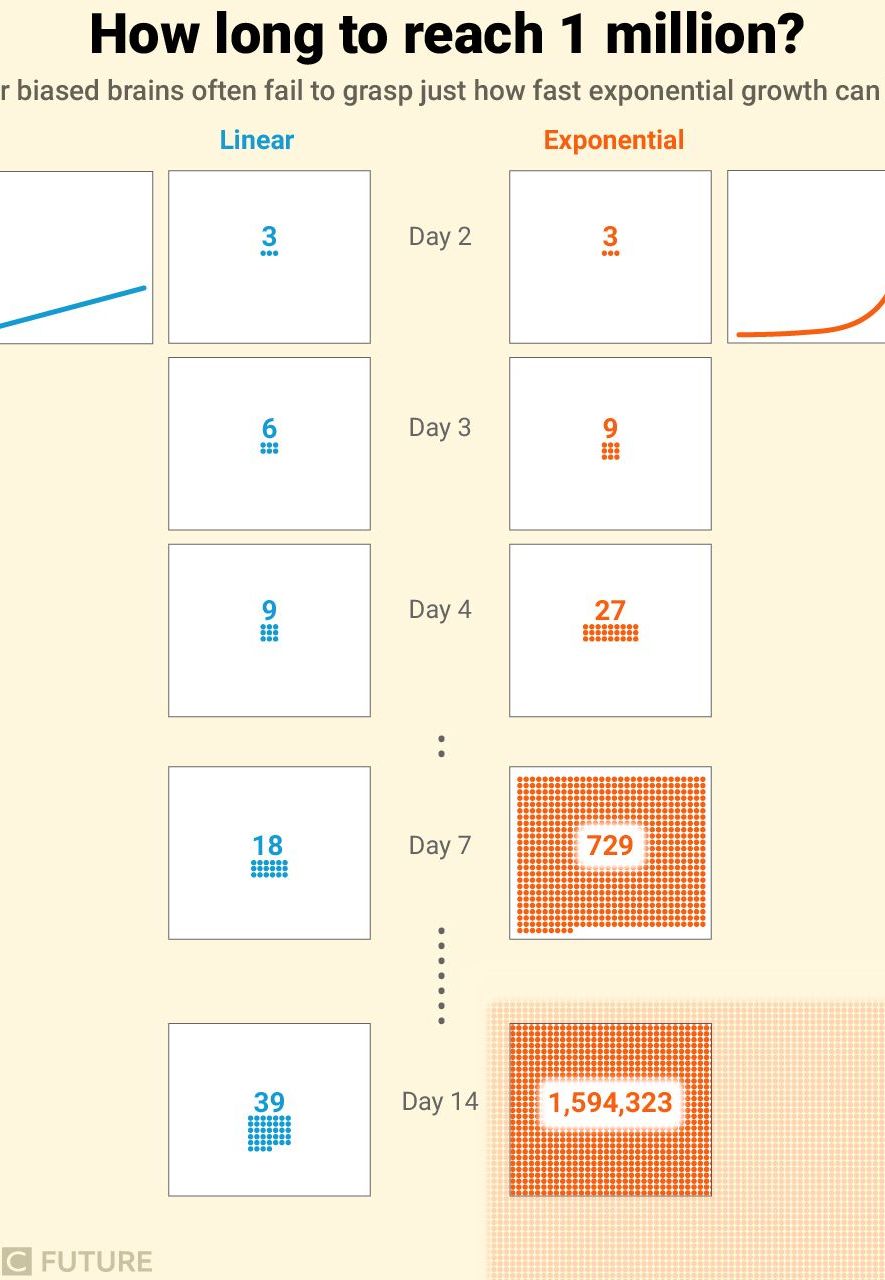

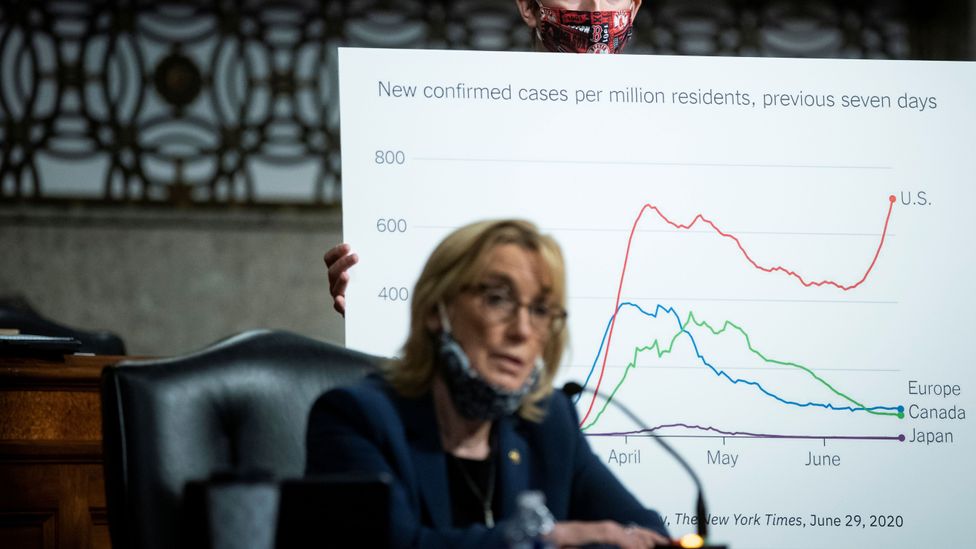


Você precisa fazer login para comentar.