Arquivo da tag: Matemática

Where mathematics and a social perspective meet data (Science Daily)

Date: February 10, 2022

Source: Wake Forest University

Summary: Community structure, including relationships between and within groups, is foundational to our understanding of the world around us.


Community structure, including relationships between and within groups, is foundational to our understanding of the world around us. New research by mathematics and statistics professor Kenneth Berenhaut, along with former postdoctoral fellow Katherine Moore and graduate student Ryan Melvin, sheds new light on some fundamental statistical questions.

“When we encounter complex data in areas such as public health, economics or elsewhere, it can be valuable to address questions regarding the presence of discernable groups, and the inherent “cohesion” or glue that holds these groups together. In considering such concepts, socially, the terms “communities,” “networks” and “relationships” may come to mind,” said Berenhaut.

The research leverages abstracted social ideas of conflict, alignment, prominence and support, to tap into the mathematical interplay between distance and cohesiveness — the sort evident when, say, comparing urban and rural settings. This enables adaptations to varied local perspectives.

“For example, we considered psychological survey-based data reflecting differences and similarities in cultural values between regions around the world — in the U.S., China, India and the EU,” Berenhaut said. “We observed distinct cultural groups, with rich internal network structure, despite the analytical challenges caused by the fact that some cohesive groups (such as India and the EU) are far more culturally diverse than others. Mark Twain once referred to India as ‘the country of a hundred nations and a hundred tongues, of a thousand religions and two million gods.’ Regions (such as the Southeast and California in the U.S.) can be perceived as locally distinct, despite their relative similarity in a global context. It is these sorts of characteristics that we are attempting to detect and understand.”

The paper, “A social perspective on perceived distances reveals deep community structure,” published by PNAS (Proceedings of the National Academy of Sciences of the United States) can be found here.

“I am excited by the manner in which a social perspective, along with a probabilistic approach, can illuminate aspects of communities inherent in data from a variety of fields,” said Berenhaut. “The concept of data communities proposed in the paper is derived from and aligns with a shared human social perspective. The work crosses areas with connections to ideas in sociology, psychology, mathematics, physics, statistics and elsewhere.”

Leveraging our experiences and perspectives can lead to valuable mathematical and statistical insights.


Story Source:

Materials provided by Wake Forest University. Original written by Kim McGrath. Note: Content may be edited for style and length.


Journal Reference:

  1. Kenneth S. Berenhaut, Katherine E. Moore, Ryan L. Melvin. A social perspective on perceived distances reveals deep community structure. Proceedings of the National Academy of Sciences, 2022; 119 (4): e2003634119 DOI: 10.1073/pnas.2003634119

Book Review: Discriminating Data: Correlation, Neighborhoods, and the New Politics of Recognition by Wendy Hui Kyong Chun (LSE)

blogs.lse.ac.uk

Professor David Beer – November 22nd, 2021


In Discriminating Data: Correlation, Neighborhoods, and the New Politics of RecognitionWendy Hui Kyong Chun explores how technological developments around data are amplifying and automating discrimination and prejudice. Through conceptual innovation and historical details, this book offers engaging and revealing insights into how data exacerbates discrimination in powerful ways, writes David Beer

Discriminating Data: Correlation, Neighborhoods, and the New Politics of Recognition. Wendy Hui Kyong Chun (mathematical illustrations by Alex Barnett). MIT Press. 2021.

Going back a couple of decades, there was a fair amount of discussion of ‘the digital divide’. Uneven access to networked computers meant that a line was drawn between those who were able to switch-on and those who were not. At the time there was a pressing concern about the disadvantages of a lack of access. With the massive escalation of connectivity since, the notion of a digital divide still has some relevance, but it has become a fairly blunt tool for understanding today’s extensively mediated social constellations. The divides now are not so much a product of access; they are instead a consequence of what happens to the data produced through that access.

With the escalation of data and the establishment of all sorts of analytic and algorithmic processes, the problem of uneven, unjust and harmful treatment is now the focal point for an animated and urgent debate. Wendy Hui Kyong Chun’s vibrant new book Discriminating Data: Correlation, Neighborhoods, and the New Politics of Recognition makes a telling intervention. At its centre is the idea that these technological developments around data ‘are amplifying and automating – rather than acknowledging and repairing – the mistakes of a discriminatory past’ (2). Essentially this is the codification and automation of prejudice. Any ideas about the liberating aspects of technology are deflated. Rooted in a longer history of statistics and biometrics, existing ruptures are being torn open by the differential targeting that big data brings.

This is not just about bits of data. Chun suggests that ‘we need […] to understand how machine learning and other algorithms have been embedded with human prejudice and discrimination, not simply at the level of data, but also at the levels of procedure, prediction, and logic’ (16). It is not, then, just about prejudice being in the data itself; it is also how segregation and discrimination are embedded in the way this data is used. Given the scale of these issues, Chun narrows things down further by focusing on four ‘foundational concepts’, with correlation, homophily, authenticity and recognition providing the focal points for interrogating the discriminations of data.

Image Credit: Pixabay 

It is the concept of correlation that does much of the gluing work within the study. The centrality of correlation is a subtext in Chun’s own overview of the book, which suggests that ‘Discriminating Data reveals how correlation and eugenic understandings of nature seek to close off the future by operationalizing probabilities; how homophily naturalizes segregation; and how authenticity and recognition foster deviation in order to create agitated clusters of comforting rage’ (27). As well as developing these lines of argument, the use of the concept of correlation also allows Chun to think in deeply historical terms about the trajectory and politics of association and patterning.

For Chun the role of correlation is both complex and performative. It is argued, for instance, that correlations ‘do not simply predict certain actions; they also form them’. This is an established position in the field of critical data studies, with data prescribing and producing the outcomes they are used to anticipate. However, Chun manages to reanimate this position through an exploration of how correlation fits into a wider set of discriminatory data practices. The other performative issue here is the way that people are made-up and grouped through the use of data. Correlations, Chun writes, ‘that lump people into categories based on their being “like” one another amplify the effects of historical inequalities’ (58). Inequalities are reinforced as categories become more obdurate, with data lending them a sense of apparent stability and a veneer of objectivity. Hence the pointed claim that ‘correlation contains within it the seeds of manipulation, segregation and misrepresentation’ (59).

Given this use of data to categorise, it is easy to see why Discriminating Data makes a conceptual link between correlation and homophily – with homophily, as Chun puts it, being the ‘principle that similarity breeds connection’ and can therefore lead to swarming and clustering. The acts of grouping within these data structures mean, for Chun, that ‘homophily not only eases conflict; it also naturalizes discrimination’ (103). Using data correlations to group informs a type of homophily that not only misrepresents and segregates; it also makes these divides seem natural and therefore fixed.

Chun anticipates that there may be some remaining remnants of faith in the seeming democratic properties of these platforms, arguing that ‘homophily reveals and creates boundaries within theoretically flat and diffuse social networks; it distinguishes and discriminates between supposedly equal nodes; it is a tool for discovering bias and inequality and for perpetuating them in the name of “comfort,” predictability, and common sense’ (85). As individuals are moved into categories or groups assumed to be like them, based upon the correlations within their data, so discrimination can readily occur. One of the key observations made by Chun is that data homophily can feel comfortable, especially when encased in predictions, yet this can distract from the actual damages of the underpinning discriminations they contain. Instead, these data ‘proxies can serve to buttress – and justify – discrimination’ (121). For Chun there is a ‘proxy politics’ unfolding in which data not only exacerbates but can also be used to lend legitimacy to discriminatory acts.

As with correlation and homophily, Chun, in a particularly novel twist, also explores how authenticity is itself becoming automated within these data structures. In stark terms, it is argued that ‘authenticity has become so central to our times because it has become algorithmic’ (144). Chun is able to show how a wider cultural push towards notions of the authentic, embodied in things like reality TV, becomes a part of data systems. A broader cultural trend is translated into something renderable in data. Chun explains that the ‘term “algorithmic authenticity” reveals the ways in which users are validated and authenticated by network algorithms’ (144). A system of validation occurs in these spaces, where actions and practices are algorithmically judged and authenticated. Algorithmic authenticity ‘trains them to be transparent’ (241). It pushes a form of openness upon us in which an ‘operationalized authenticity’ develops, especially within social media.

This emphasis upon the authentic draws people into certain types of interaction with these systems. It shows, Chun compellingly puts it, ‘how users have become characters in a drama called “big data”’ (145). The notion of a drama is, of course, not to diminish what is happening but to try to get at its vibrant and role-based nature. It also adds a strong sense of how performance plays out in relation to the broader ideas of data judgment that the book is exploring.

These roles are not something that Chun wants us to accept, arguing instead that ‘if we think through our roles as performers and characters in the drama called “big data,” we do not have to accept the current terms of our deployment’ (170). Examining the artifice of the drama is a means of transformation and challenge. Exposing the drama is to expose the roles and scripts that are in place, enabling them to be questioned and possibly undone. This is not fatalistic or absent of agency; rather, Chun’s point is that ‘we are characters, rather than marionettes’ (248).

There are some powerful cross-currents working through the discussions of the book’s four foundational concepts. The suggestion that big data brings a reversal of hegemony is a particularly telling argument. Chun explains that: ‘Power can now operate through reverse hegemony: if hegemony once meant the creation of a majority by various minorities accepting a dominant worldview […], now hegemonic majorities can emerge when angry minorities, clustered around a shared stigma, are strung together through their mutual opposition to so-called mainstream culture’ (34). This line of argument is echoed in similar terms in the book’s conclusion, clarifying further that ‘this is hegemony in reverse: if hegemony once entailed creating a majority by various minorities accepting – and identifying with – a dominant worldview, majorities now emerge by consolidating angry minorities – each attached to a particular stigma – through their opposition to “mainstream” culture’ (243). In this formulation it would seem that big data may not only be disciplinary but may also somehow gain power by upending any semblance of a dominant ideology. Data doesn’t lead to shared ideas but to the splitting of the sharing of ideas into group-based networks. It does seem plausible that the practices of targeting and patterning through data are unlikely to facilitate hegemony. Yet, it is not just that data affords power beyond hegemony but that it actually seeks to reverse it.

The reader may be caught slightly off-guard by this position. Chun generally seems to picture power as emerging and solidifying through a genealogy of the technologies that have formed into contemporary data infrastructures. In this account power seems to be associated with established structures and operates through correlations, calls for authenticity and the means of recognition. These positions on power – with infrastructures on one side and reverse hegemony on the other – are not necessarily incompatible, yet the discussion of reverse hegemony perhaps stands a little outside of that other vision of power. I was left wondering if this reverse hegemony is a consequence of these more processional operations of power or, maybe, it is a kind of facilitator of them.

Chun’s book looks to bring out the deep divisions that data-informed discrimination has already created and will continue to create. The conceptual innovation and the historical details, particularly on statistics and eugenics, lend the book a deep sense of context that feeds into a range of genuinely engaging and revealing insights and ideas. Through its careful examination of the way that data exacerbates discrimination in very powerful ways, this is perhaps the most telling book yet on the topic. The digital divide may no longer be a particularly useful term but, as Chun’s book makes clear, the role data performs in animating discrimination means that the technological facilitation of divisions has never been more pertinent.

Pythagoras’ revenge: humans didn’t invent mathematics, it’s what the world is made of (The Conversation)

theconversation.com

Sam Baron – November 21, 2021 11.47pm EST


Many people think that mathematics is a human invention. To this way of thinking, mathematics is like a language: it may describe real things in the world, but it doesn’t “exist” outside the minds of the people who use it.

But the Pythagorean school of thought in ancient Greece held a different view. Its proponents believed reality is fundamentally mathematical.

More than 2,000 years later, philosophers and physicists are starting to take this idea seriously.

As I argue in a new paper, mathematics is an essential component of nature that gives structure to the physical world.

Honeybees and hexagons

Bees in hives produce hexagonal honeycomb. Why?

According to the “honeycomb conjecture” in mathematics, hexagons are the most efficient shape for tiling the plane. If you want to fully cover a surface using tiles of a uniform shape and size, while keeping the total length of the perimeter to a minimum, hexagons are the shape to use.

The hexagonal pattern of honeycomb is the most efficient way to cover a space in identical tiles. Sam Baron, Author provided

Charles Darwin reasoned that bees have evolved to use this shape because it produces the largest cells to store honey for the smallest input of energy to produce wax.

The honeycomb conjecture was first proposed in ancient times, but was only proved in 1999 by mathematician Thomas Hales.

Cicadas and prime numbers

Here’s another example. There are two subspecies of North American periodical cicadas that live most of their lives in the ground. Then, every 13 or 17 years (depending on the subspecies), the cicadas emerge in great swarms for a period of around two weeks.

Why is it 13 and 17 years? Why not 12 and 14? Or 16 and 18?

One explanation appeals to the fact that 13 and 17 are prime numbers.

Some cicadas have evolved to emerge from the ground at intervals of a prime number of years, possibly to avoid predators with life cycles of different lengths. Michael Kropiewnicki / Pixels

Imagine the cicadas have a range of predators that also spend most of their lives in the ground. The cicadas need to come out of the ground when their predators are lying dormant.

Suppose there are predators with life cycles of 2, 3, 4, 5, 6, 7, 8 and 9 years. What is the best way to avoid them all?

Well, compare a 13-year life cycle and a 12-year life cycle. When a cicada with a 12-year life cycle comes out of the ground, the 2-year, 3-year and 4-year predators will also be out of the ground, because 2, 3 and 4 all divide evenly into 12.

When a cicada with a 13-year life cycle comes out of the ground, none of its predators will be out of the ground, because none of 2, 3, 4, 5, 6, 7, 8 or 9 divides evenly into 13. The same is true for 17.

P1–P9 represent cycling predators. The number-line represents years. The highlighted gaps show how 13 and 17-year cicadas manage to avoid their predators. Sam Baron, Author provided

It seems these cicadas have evolved to exploit basic facts about numbers.

Creation or discovery?

Once we start looking, it is easy to find other examples. From the shape of soap films, to gear design in engines, to the location and size of the gaps in the rings of Saturn, mathematics is everywhere.

If mathematics explains so many things we see around us, then it is unlikely that mathematics is something we’ve created. The alternative is that mathematical facts are discovered: not just by humans, but by insects, soap bubbles, combustion engines and planets.

What did Plato think?

But if we are discovering something, what is it?

The ancient Greek philosopher Plato had an answer. He thought mathematics describes objects that really exist.

For Plato, these objects included numbers and geometric shapes. Today, we might add more complicated mathematical objects such as groups, categories, functions, fields and rings to the list.

For Plato, numbers existed in a realm separate from the physical world. Geralt / Pixabay

Plato also maintained that mathematical objects exist outside of space and time. But such a view only deepens the mystery of how mathematics explains anything.

Explanation involves showing how one thing in the world depends on another. If mathematical objects exist in a realm apart from the world we live in, they don’t seem capable of relating to anything physical.

Enter Pythagoreanism

The ancient Pythagoreans agreed with Plato that mathematics describes a world of objects. But, unlike Plato, they didn’t think mathematical objects exist beyond space and time.

Instead, they believed physical reality is made of mathematical objects in the same way matter is made of atoms.

If reality is made of mathematical objects, it’s easy to see how mathematics might play a role in explaining the world around us.

Pythagorean pie: the world is made of mathematics plus matter. Sam Baron, Author provided

In the past decade, two physicists have mounted significant defences of the Pythagorean position: Swedish-US cosmologist Max Tegmark and Australian physicist-philosopher Jane McDonnell.

Tegmark argues reality just is one big mathematical object. If that seems weird, think about the idea that reality is a simulation. A simulation is a computer program, which is a kind of mathematical object.

McDonnell’s view is more radical. She thinks reality is made of mathematical objects and minds. Mathematics is how the Universe, which is conscious, comes to know itself.

I defend a different view: the world has two parts, mathematics and matter. Mathematics gives matter its form, and matter gives mathematics its substance.

Mathematical objects provide a structural framework for the physical world.

The future of mathematics

It makes sense that Pythagoreanism is being rediscovered in physics.

In the past century physics has become more and more mathematical, turning to seemingly abstract fields of inquiry such as group theory and differential geometry in an effort to explain the physical world.

As the boundary between physics and mathematics blurs, it becomes harder to say which parts of the world are physical and which are mathematical.

But it is strange that Pythagoreanism has been neglected by philosophers for so long.

I believe that is about to change. The time has arrived for a Pythagorean revolution, one that promises to radically alter our understanding of reality.

theconversation.com

Is mathematics real? A viral TikTok video raises a legitimate question with exciting answers (The Conversation)

Daniel Mansfield – August 31, 2020 1.41am EDT


While filming herself getting ready for work recently, TikTok user @gracie.ham reached deep into the ancient foundations of mathematics and found an absolute gem of a question:

How could someone come up with a concept like algebra?

She also asked what the ancient Greek philosopher Pythagoras might have used mathematics for, and other questions that revolve around the age-old conundrum of whether mathematics is “real” or something humans just made up.

Many responded negatively to the post, but others — including mathematicians like me — found the questions quite insightful.

Is mathematics real?

Philosophers and mathematicians have been arguing over this for centuries. Some believe mathematics is universal; others consider it only as real as anything else humans have invented.

Thanks to @gracie.ham, Twitter users have now vigorously joined the debate.

For me, part of the answer lies in history.

From one perspective, mathematics is a universal language used to describe the world around us. For instance, two apples plus three apples is always five apples, regardless of your point of view.

But mathematics is also a language used by humans, so it is not independent of culture. History shows us that different cultures had their own understanding of mathematics.

Unfortunately, most of this ancient understanding is now lost. In just about every ancient culture, a few scattered texts are all that remain of their scientific knowledge.

However, there is one ancient culture that left behind an absolute abundance of texts.

Babylonian algebra

Buried in the deserts of modern Iraq, clay tablets from ancient Babylon have survived intact for about 4,000 years.

These tablets are slowly being translated and what we have learned so far is that the Babylonians were practical people who were highly numerate and knew how to solve sophisticated problems with numbers.

Their arithmetic was different from ours, though. They didn’t use zero or negative numbers. They even mapped out the motion of the planets without using calculus as we do.

Of particular importance for @gracie.ham’s question about the origins of algebra is that they knew that the numbers 3, 4 and 5 correspond to the lengths of the sides and diagonal of a rectangle. They also knew these numbers satisfied the fundamental relation 3² + 4² = 5² that ensures the sides are perpendicular.

No theorems were harmed (or used) in the construction of this rectangle.

The Babylonians did all this without modern algebraic concepts. We would express a more general version of the same idea using Pythagoras’ theorem: any right-angled triangle with sides of length a and b and hypotenuse c satisfies a² + b² = c².

The Babylonian perspective omits algebraic variables, theorems, axioms and proofs not because they were ignorant but because these ideas had not yet developed. In short, these social constructs began more than 1,000 years later, in ancient Greece. The Babylonians happily and productively did mathematics and solved problems without any of these relatively modern notions.

What was it all for?

@gracie.ham also asks how Pythagoras came up with his theorem. The short answer is: he didn’t.

Pythagoras of Samos (c. 570-495 BC) probably heard about the idea we now associate with his name while he was in Egypt. He may have been the person to introduce it to Greece, but we don’t really know.

Pythagoras didn’t use his theorem for anything practical. He was primarily interested in numerology and the mysticism of numbers, rather than the applications of mathematics.


Without modern tools, how do you make right angles just right? Ancient Hindu religious texts give instructions for making a rectangular fire altar using the 3-4-5 configuration with sides of length 3 and 4, and diagonal length 5. These measurements ensure that the altar has right angles in each corner.

A man sits at a fire altar
A rectangular fire altar. Madhu K / Wikipedia, CC BY-SA

Big questions

In the 19th century, the German mathematician Leopold Kronecker said “God made the integers, all else is the work of man”. I agree with that sentiment, at least for the positive integers — the whole numbers we count with — because the Babylonians didn’t believe in zero or negative numbers.

Mathematics has been happening for a very, very long time. Long before ancient Greece and Pythagoras.

Is it real? Most cultures agree about some basics, like the positive integers and the 3-4-5 right triangle. Just about everything else in mathematics is determined by the society in which you live.

Words Have Lost Their Common Meaning (The Atlantic)

theatlantic.com

John McWhorter, contributing writer at The Atlantic and professor at Columbia University

March 31, 2021


The word racism, among others, has become maddeningly confusing in current usage.

An illustration of quotation marks and the United States split in two.
Adam Maida / The Atlantic

Has American society ever been in less basic agreement on what so many important words actually mean? Terms we use daily mean such different things to different people that communication is often blunted considerably, and sometimes even thwarted entirely. The gap between how the initiated express their ideological beliefs and how everyone else does seems larger than ever.

The word racism has become almost maddeningly confusing in current usage. It tempts a linguist such as me to contravene the dictum that trying to influence the course of language change is futile.

Racism began as a reference to personal prejudice, but in the 1960s was extended via metaphor to society, the idea being that a society riven with disparities according to race was itself a racist one. This convention, implying that something as abstract as a society can be racist, has always felt tricky, best communicated in sociology classes or careful discussions.

To be sure, the idea that disparities between white and Black people are due to injustices against Black people—either racist sentiment or large-scale results of racist neglect—seems as plain as day to some, especially in academia. However, after 50 years, this usage of racism has yet to stop occasioning controversy; witness the outcry when Merriam-Webster recently altered its definition of the word to acknowledge the “systemic” aspect. This controversy endures for two reasons.

First, the idea that all racial disparities are due to injustice may imply that mere cultural differences do not exist. The rarity of the Black oboist may be due simply to Black Americans not having much interest in the oboe—hardly a character flaw or evidence of some inadequacy—as opposed to subtly racist attitudes among music teachers or even the thinness of musical education in public schools. Second, the concept of systemic racism elides or downplays that disparities can also persist because of racism in the past, no longer in operation and thus difficult to “address.”

Two real-world examples of strained usage come to mind. Opponents of the modern filibuster have taken to calling it “racist” because it has been used for racist ends. This implies a kind of contamination, a rather unsophisticated perspective given that this “racist” practice has been readily supported by noted non-racists such as Barack Obama (before he changed his mind on the matter). Similar is the idea that standardized tests are “racist” because Black kids often don’t do as well on them as white kids. If the tests’ content is biased toward knowledge that white kids are more likely to have, that complaint may be justified. Otherwise, factors beyond the tests themselves, such as literacy in the home, whether children are tested throughout childhood, how plugged in their parents are to test-prep opportunities, and subtle attitudes toward school and the printed page, likely explain why some groups might be less prepared to excel at them.

Dictionaries are correct to incorporate the societal usage of racism, because it is now common coin. The lexicographer describes rather than prescribes. However, its enshrinement in dictionaries leaves its unwieldiness intact, just as a pretty map can include a road full of potholes that suddenly becomes one-way at a dangerous curve. Nearly every designation of someone or something as “racist” in modern America raises legitimate questions, and leaves so many legions of people confused or irritated that no one can responsibly dismiss all of this confusion and irritation as mere, well, racism.

To speak English is to know the difference between pairs of words that might as well be the same one: entrance and entry. Awesome and awful are similar. However, one might easily feel less confident about the difference between equality and equity, in the way that today’s crusaders use the word in diversity, equity, and inclusion.

In this usage, equity is not a mere alternate word for equality, but harbors an assumption: that where the races are not represented roughly according to their presence in the population, the reason must be a manifestation of (societal) racism. A teachers’ conference in Washington State last year included a presentation underlining: “If you conclude that outcomes differences by demographic subgroup are a result of anything other than a broken system, that is, by definition, bigotry.” A DEI facilitator specifies that “equity is not an outcome”—in the way equality is—but “a process that begins by acknowledging [people’s] unequal starting place and makes a commitment to correct and address the imbalance.”

Equality is a state, an outcome—but equity, a word that sounds just like it and has a closely related meaning, is a commitment and effort, designed to create equality. That is a nuance of a kind usually encountered in graduate seminars about the precise definitions of concepts such as freedom. It will throw or even turn off those disinclined to attend that closely: Fondness for exegesis will forever be thinly distributed among humans.

Many will thus feel that the society around them has enough “equalness”—i.e., what equity sounds like—such that what they may see as attempts to force more of it via set-aside policies will seem draconian rather than just. The subtle difference between equality and equity will always require flagging, which will only ever be so effective.

The nature of how words change, compounded by the effects of our social-media bubbles, means that many vocal people on the left now use social justice as a stand-in for justice—in the same way we say advance planning instead of planning or 12 midnight instead of midnight—as if the social part were a mere redundant, rhetorical decoration upon the keystone notion of justice. An advocacy group for wellness and nutrition titled one of its messages “In the name of social justice, food security and human dignity,” but within the text refers simply to “justice” and “injustice,” without the social prefix, as if social justice is simply justice incarnate. The World Social Justice Day project includes more tersely named efforts such as “Task Force on Justice” and “Justice for All.” Baked into this is a tacit conflation of social justice with justice conceived more broadly.

However, this usage of the term social justice is typically based on a very particular set of commitments especially influential in this moment: that all white people must view society as founded upon racist discrimination, such that all white people are complicit in white supremacy, requiring the forcing through of equity in suspension of usual standards of qualification or sometimes even logic (math is racist). A view of justice this peculiar, specific, and even revolutionary is an implausible substitute for millennia of discussion about the nature of the good, much less its apotheosis.

What to do? I suggest—albeit with little hope—that the terms social justice and equity be used, or at least heard, as the proposals that they are. Otherwise, Americans are in for decades of non-conversations based on greatly different visions of what justice and equ(al)ity are.

I suspect that the way the term racism is used is too entrenched to yield to anyone’s preferences. However, if I could wave a magic wand, Americans would go back to using racism to refer to personal sentiment, while we would phase out so hopelessly confusing a term as societal racism.

I would replace it with societal disparities, with a slot open afterward for according to race, or according to immigration status, or what have you. Inevitably, the sole term societal disparities would conventionalize as referring to race-related disparities. However, even this would avoid the endless distractions caused by using the same term—racism—for both prejudice and faceless, albeit pernicious, inequities.

My proposals qualify, indeed, as modest. I suspect that certain people will continue to use social justice as if they have figured out a concept that proved elusive from Plato through Kant through Rawls. Equity will continue to be refracted through that impression. Legions will still either struggle to process racism both harbored by persons and instantiated by a society, or just quietly accept the conflation to avoid making waves.

What all of this will mean is a debate about race in which our problem-solving is hindered by the fact that we too often lack a common language for discussing the topic.

John McWhorter is a contributing writer at The Atlantic. He teaches linguistics at Columbia University, hosts the podcast Lexicon Valley, and is the author of the upcoming Nine Nasty Words: English in the Gutter Then, Now and Always.

The remarkable ways animals understand numbers (BBC Future)

bbc.com

Andreas Nieder, September 7, 2020

(Credit: Press Association)

For some species there is strength and safety in numbers (Credit: Press Association)

Humans as a species are adept at using numbers, but our mathematical ability is something we share with a surprising array of other creatures.

One of the key findings over the past decades is that our number faculty is deeply rooted in our biological ancestry, and not based on our ability to use language. Considering the multitude of situations in which we humans use numerical information, life without numbers is inconceivable.

But what was the benefit of numerical competence for our ancestors, before they became Homo sapiens? Why would animals crunch numbers in the first place?

It turns out that processing numbers offers a significant benefit for survival, which is why this behavioural trait is present in many animal populations. Several studies examining animals in their ecological environments suggest that representing numbers enhances an animal’s ability to exploit food sources, hunt prey, avoid predation, navigate its habitat, and persist in social interactions.

Before numerically competent animals evolved on the planet, single-celled microscopic bacteria – the oldest living organisms on Earth – already exploited quantitative information. The way bacteria make a living is through their consumption of nutrients from their environment. Mostly, they grow and divide themselves to multiply. However, in recent years, microbiologists have discovered they also have a social life and are able to sense the presence or absence of other bacteria. In other words, they can sense the number of bacteria.

Take, for example, the marine bacterium Vibrio fischeri. It has a special property that allows it to produce light through a process called bioluminescence, similar to how fireflies give off light. If these bacteria are in dilute water solutions (where they are essentially alone), they make no light. But when they grow to a certain cell number of bacteria, all of them produce light simultaneously. Therefore, Vibrio fischeri can distinguish when they are alone and when they are together.

Sometimes the numbers don't add up when predators are trying to work out which prey to target (Credit: Alamy)

Sometimes the numbers don’t add up when predators are trying to work out which prey to target (Credit: Alamy)

It turns out they do this using a chemical language. They secrete communication molecules, and the concentration of these molecules in the water increases in proportion to the cell number. And when this molecule hits a certain amount, called a “quorum”, it tells the other bacteria how many neighbours there are, and all the bacteria glow.

This behaviour is called “quorum sensing” – the bacteria vote with signalling molecules, the vote gets counted, and if a certain threshold (the quorum) is reached, every bacterium responds. This behaviour is not just an anomaly of Vibrio fischeri – all bacteria use this sort of quorum sensing to communicate their cell number in an indirect way via signalling molecules.

Remarkably, quorum sensing is not confined to bacteria – animals use it to get around, too. Japanese ants (Myrmecina nipponica), for example, decide to move their colony to a new location if they sense a quorum. In this form of consensus decision making, ants start to transport their brood together with the entire colony to a new site only if a defined number of ants are present at the destination site. Only then, they decide, is it safe to move the colony.

Numerical cognition also plays a vital role when it comes to both navigation and developing efficient foraging strategies. In 2008, biologists Marie Dacke and Mandyam Srinivasan performed an elegant and thoroughly controlled experiment in which they found that bees are able to estimate the number of landmarks in a flight tunnel to reach a food source – even when the spatial layout is changed. Honeybees rely on landmarks to measure the distance of a food source to the hive. Assessing numbers is vital to their survival.

When it comes to optimal foraging, “going for more” is a good rule of thumb in most cases, and seems obvious when you think about it, but sometimes the opposite strategy is favourable. The field mouse loves live ants, but ants are dangerous prey because they bite when threatened. When a field mouse is placed into an arena together with two ant groups of different quantities, then, it surprisingly “goes for less”. In one study, mice that could choose between five versus 15, five versus 30, and 10 versus 30 ants always preferred the smaller quantity of ants. The field mice seem to pick the smaller ant group in order to ensure comfortable hunting and to avoid getting bitten frequently.

Numerical cues play a significant role when it comes to hunting prey in groups, as well. The probability, for example, that wolves capture elk or bison varies with the group size of a hunting party. Wolves often hunt large prey, such as elk and bison, but large prey can kick, gore, and stomp wolves to death. Therefore, there is incentive to “hold back” and let others go in for the kill, particularly in larger hunting parties. As a consequence, wolves have an optimal group size for hunting different prey. For elks, capture success levels off at two to six wolves. However, for bison, the most formidable prey, nine to 13 wolves are the best guarantor of success. Therefore, for wolves, there is “strength in numbers” during hunting, but only up to a certain number that is dependent on the toughness of their prey.

Animals that are more or less defenceless often seek shelter among large groups of social companions – the strength-in-numbers survival strategy hardly needs explaining. But hiding out in large groups is not the only anti-predation strategy involving numerical competence.

In 2005, a team of biologists at the University of Washington found that black-capped chickadees in Europe developed a surprising way to announce the presence and dangerousness of a predator. Like many other animals, chickadees produce alarm calls when they detect a potential predator, such as a hawk, to warn their fellow chickadees. For stationary predators, these little songbirds use their namesake “chick-a-dee” alarm call. It has been shown that the number of “dee” notes at the end of this alarm call indicates the danger level of a predator.

Chickadees produce different numbers of "dee" notes at the end of their call depending on danger they have spotted (Credit: Getty Images)

Chickadees produce different numbers of “dee” notes at the end of their call depending on danger they have spotted (Credit: Getty Images)

A call such as “chick-a-dee-dee” with only two “dee” notes may indicate a rather harmless great grey owl. Great grey owls are too big to manoeuvre and follow the agile chickadees in woodland, so they aren’t a serious threat. In contrast, manoeuvring between trees is no problem for the small pygmy owl, which is why it is one of the most dangerous predators for these small birds. When chickadees see a pygmy owl, they increase the number of “dee” notes and call “chick-a-dee-dee-dee-dee.” Here, the number of sounds serves as an active anti-predation strategy.

Groups and group size also matter if resources cannot be defended by individuals alone – and the ability to assess the number of individuals in one’s own group relative to the opponent party is of clear adaptive value.

Several mammalian species have been investigated in the wild, and the common finding is that numerical advantage determines the outcome of such fights. In a pioneering study, zoologist Karen McComb and co-workers at the University of Sussex investigated the spontaneous behaviour of female lions at the Serengeti National Park when facing intruders. The authors exploited the fact that wild animals respond to vocalisations played through a speaker as though real individuals were present. If the playback sounds like a foreign lion that poses a threat, the lionesses would aggressively approach the speaker as the source of the enemy. In this acoustic playback study, the authors mimicked hostile intrusion by playing the roaring of unfamiliar lionesses to residents.

Two conditions were presented to subjects: either the recordings of single female lions roaring, or of groups of three females roaring together. The researchers were curious to see if the number of attackers and the number of defenders would have an impact on the defender’s strategy. Interestingly, a single defending female was very hesitant to approach the playbacks of a single or three intruders. However, three defenders readily approached the roaring of a single intruder, but not the roaring of three intruders together.

Obviously, the risk of getting hurt when entering a fight with three opponents was foreboding. Only if the number of the residents was five or more did the lionesses approach the roars of three intruders. In other words, lionesses decide to approach intruders aggressively only if they outnumber the latter – another clear example of an animal’s ability to take quantitative information into account.

Our closest cousins in the animal kingdom, the chimpanzees, show a very similar pattern of behaviour. Using a similar playback approach, Michael Wilson and colleagues from Harvard University found that the chimpanzees behaved like military strategists. They intuitively follow equations used by military forces to calculate the relative strengths of opponent parties. In particular, chimpanzees follow predictions made in Lanchester’s “square law” model of combat. This model predicts that, in contests with multiple individuals on each side, chimpanzees in this population should be willing to enter a contest only if they outnumber the opposing side by a factor of at least 1.5. And that is precisely what wild chimps do.

Lionesses judge how many intruders they may be facing before approaching them (Credit: Alamy)

Lionesses judge how many intruders they may be facing before approaching them (Credit: Alamy)

Staying alive – from a biological stance – is a means to an end, and the aim is the transmission of genes. In mealworm beetles (Tenebrio molitor), many males mate with many females, and competition is intense. Therefore, a male beetle will always go for more females in order to maximise his mating opportunities. After mating, males even guard females for some time to prevent further mating acts from other males. The more rivals a male has encountered before mating, the longer he will guard the female after mating.

It is obvious that such behaviour plays an important role in reproduction and therefore has a high adaptive value. Being able to estimate quantity has improved males’ sexual competitiveness. This may in turn be a driving force for more sophisticated cognitive quantity estimation throughout evolution.

One may think that everything is won by successful copulation. But that is far from the truth for some animals, for whom the real prize is fertilising an egg. Once the individual male mating partners have accomplished their part in the play, the sperm continues to compete for the fertilisation of the egg. Since reproduction is of paramount importance in biology, sperm competition causes a variety of adaptations at the behavioural level.

In both insects and vertebrates, the males’ ability to estimate the magnitude of competition determines the size and composition of the ejaculate. In the pseudoscorpion, Cordylochernes scorpioides, for example, it is common that several males copulate with a single female. Obviously, the first male has the best chances of fertilising this female’s egg, whereas the following males face slimmer and slimmer chances of fathering offspring. However, the production of sperm is costly, so the allocation of sperm is weighed considering the chances of fertilising an egg.

Males smell the number of competitor males that have copulated with a female and adjust by progressively decreasing sperm allocation as the number of different male olfactory cues increases from zero to three.

Some bird species, meanwhile, have invented a whole arsenal of trickery to get rid of the burden of parenthood and let others do the job. Breeding a clutch and raising young are costly endeavours, after all. They become brood parasites by laying their eggs in other birds’ nests and letting the host do all the hard work of incubating eggs and feeding hatchlings. Naturally, the potential hosts are not pleased and do everything to avoid being exploited. And one of the defence strategies the potential host has at its disposal is the usage of numerical cues.

American coots, for example, sneak eggs into their neighbours’ nests and hope to trick them into raising the chicks. Of course, their neighbours try to avoid being exploited. A study in the coots’ natural habitat suggests that potential coot hosts can count their own eggs, which helps them to reject parasitic eggs. They typically lay an average-sized clutch of their own eggs, and later reject any surplus parasitic egg. Coots therefore seem to assess the number of their own eggs and ignore any others.

An even more sophisticated type of brood parasitism is found in cowbirds, a songbird species that lives in North America. In this species, females also deposit their eggs in the nests of a variety of host species, from birds as small as kinglets to those as large as meadowlarks, and they have to be smart in order to guarantee that their future young have a bright future.

Cowbird eggs hatch after exactly 12 days of incubation; if incubation is only 11 days, the chicks do not hatch and are lost. It is therefore not an accident that the incubation times for the eggs of the most common hosts range from 11 to 16 days, with an average of 12 days. Host birds usually lay one egg per day – once one day elapses with no egg added by the host to the nest, the host has begun incubation. This means the chicks start to develop in the eggs, and the clock begins ticking. For a cowbird female, it is therefore not only important to find a suitable host, but also to precisely time their egg laying appropriately. If the cowbird lays her egg too early in the host nest, she risks her egg being discovered and destroyed. But if she lays her egg too late, incubation time will have expired before her cowbird chick can hatch.

Female cowbirds perform some incredible mental arithmetic to know when she should lay her eggs in the next of a host bird (Credit: Alamy)

Female cowbirds perform some incredible mental arithmetic to know when she should lay her eggs in the next of a host bird (Credit: Alamy)

Clever experiments by David J White and Grace Freed-Brown from the University of Pennsylvania suggest that cowbird females carefully monitor the host’s clutch to synchronise their parasitism with a potential host’s incubation. The cowbird females watch out for host nests in which the number of eggs has increased since her first visit. This guarantees that the host is still in the laying process and incubation has not yet started. In addition, the cowbird is looking out for nests that contain exactly one additional egg per number of days that have elapsed since her initial visit.

For instance, if the cowbird female visited a nest on the first day and found one host egg in the nest, she will only deposit her own egg if the host nest contains three eggs on the third day. If the nest contains fewer additional eggs than the number of days that have passed since the last visit, she knows that incubation has already started and it is useless for her to lay her own egg. It is incredibly cognitively demanding, since the female cowbird needs to visit a nest over multiple days, remember the clutch size from one day to the next, evaluate the change in the number of eggs in the nest from a past visit to the present, assess the number of days that have passed, and then compare these values to make a decision to lay her egg or not.

But this is not all. Cowbird mothers also have sinister reinforcement strategies. They keep watch on the nests where they’ve laid their eggs. In an attempt to protect their egg, the cowbirds act like mafia gangsters. If the cowbird finds that her egg has been destroyed or removed from the host’s nest, she retaliates by destroying the host bird’s eggs, pecking holes in them or carrying them out of the nest and dropping them on the ground. The host birds better raise the cowbird nestling, or else they have to pay dearly. For the host parents, it may therefore be worth to go through all the trouble of raising a foster chick from an adaptive point of view.

The cowbird is an astounding example of how far evolution has driven some species to stay in the business of passing on their genes. The existing selection pressures, whether imposed by the inanimate environment or by other animals, force populations of species to maintain or increase adaptive traits caused by specific genes. If assessing numbers helps in this struggle to survive and reproduce, it surely is appreciated and relied on.

This explains why numerical competence is so widespread in the animal kingdom: it evolved either because it was discovered by a previous common ancestor and passed on to all descendants, or because it was invented across different branches of the animal tree of life.

Irrespective of its evolutionary origin, one thing is certain – numerical competence is most certainly an adaptive trait.

* This article originally appeared in The MIT Press Reader, and is republished under a Creative Commons licence. Andreas Nieder is Professor of Animal Physiology and Director of the Institute of Neurobiology at the University of Tübingen and the author of A Brain for Numbers, from which this article is adapted.

Exponential growth bias: The numerical error behind Covid-19 (BBC/Future)

A basic mathematical calculation error has fuelled the spread of coronavirus (Credit: Reuters)

Original article

By David Robson – 12th August 2020

A simple mathematical mistake may explain why many people underestimate the dangers of coronavirus, shunning social distancing, masks and hand-washing.

Imagine you are offered a deal with your bank, where your money doubles every three days. If you invest just $1 today, roughly how long will it take for you to become a millionaire?

Would it be a year? Six months? 100 days?

The precise answer is 60 days from your initial investment, when your balance would be exactly $1,048,576. Within a further 30 days, you’d have earnt more than a billion. And by the end of the year, you’d have more than $1,000,000,000,000,000,000,000,000,000,000,000,000 – an “undecillion” dollars.

If your estimates were way out, you are not alone. Many people consistently underestimate how fast the value increases – a mistake known as the “exponential growth bias” – and while it may seem abstract, it may have had profound consequences for people’s behaviour this year.

A spate of studies has shown that people who are susceptible to the exponential growth bias are less concerned about Covid-19’s spread, and less likely to endorse measures like social distancing, hand washing or mask wearing. In other words, this simple mathematical error could be costing lives – meaning that the correction of the bias should be a priority as we attempt to flatten curves and avoid second waves of the pandemic around the world.

To understand the origins of this particular bias, we first need to consider different kinds of growth. The most familiar is “linear”. If your garden produces three apples every day, you have six after two days, nine after three days, and so on.

Exponential growth, by contrast, accelerates over time. Perhaps the simplest example is population growth; the more people you have reproducing, the faster the population grows. Or if you have a weed in your pond that triples each day, the number of plants may start out low – just three on day two, and nine on day three – but it soon escalates (see diagram, below).

Many people assume that coronavirus spreads in a linear fashion, but unchecked it's exponential (Credit: Nigel Hawtin)

Many people assume that coronavirus spreads in a linear fashion, but unchecked it’s exponential (Credit: Nigel Hawtin)

Our tendency to overlook exponential growth has been known for millennia. According to an Indian legend, the brahmin Sissa ibn Dahir was offered a prize for inventing an early version of chess. He asked for one grain of wheat to be placed on the first square on the board, two for the second square, four for the third square, doubling each time up to the 64th square. The king apparently laughed at the humility of ibn Dahir’s request – until his treasurers reported that it would outstrip all the food in the land (18,446,744,073,709,551,615 grains in total).

It was only in the late 2000s that scientists started to study the bias formally, with research showing that most people – like Sissa ibn Dahir’s king – intuitively assume that most growth is linear, leading them to vastly underestimate the speed of exponential increase.

These initial studies were primarily concerned with the consequences for our bank balance. Most savings accounts offer compound interest, for example, where you accrue additional interest on the interest you have already earned. This is a classic example of exponential growth, and it means that even low interest rates pay off handsomely over time. If you have a 5% interest rate, then £1,000 invested today will be worth £1,050 next year, and £1,102.50 the year after… which adds up to more than £7,000 in 40 years’ time. Yet most people don’t recognise how much more bang for their buck they will receive if they start investing early, so they leave themselves short for their retirement.

If the number of grains on a chess board doubled for each square, the 64th would 'hold' 18 quintillion (Credit: Getty Images)

If the number of grains on a chess board doubled for each square, the 64th would ‘hold’ 18 quintillion (Credit: Getty Images)

Besides reducing their savings, the bias also renders people more vulnerable to unfavourable loans, where debt escalates over time. According to one study from 2008, the bias increases someone’s debt-to-income ratio from an average of 23% to an average of 54%.

Surprisingly, a higher level of education does not prevent people from making these errors. Even mathematically trained science students can be vulnerable, says Daniela Sele, who researchs economic decision making at the Swiss Federal Institute of Technology in Zurich. “It does help somewhat, but it doesn’t preclude the bias,” she says.

This may be because they are relying on their intuition rather than deliberative thinking, so that even if they have learned about things like compound interest, they forget to apply them. To make matters worse, most people will confidently report understanding exponential growth but then still fall for the bias when asked to estimate things like compound interest.

As I explored in my book The Intelligence Trap, intelligent and educated people often have a “bias blind spot”, believing themselves to be less susceptible to error than others – and the exponential growth bias appears to fall dead in its centre.

Most people will confidently report understanding exponential growth but then still fall for the bias

It was only this year – at the start of the Covid-19 pandemic – that researchers began to consider whether the bias might also influence our understanding of infectious diseases.

According to various epidemiological studies, without intervention the number of new Covid-19 cases doubles every three to four days, which was the reason that so many scientists advised rapid lockdowns to prevent the pandemic from spiralling out of control.

In March, Joris Lammers at the University of Bremen in Germany joined forces with Jan Crusius and Anne Gast at the University of Cologne to roll out online surveys questioning people about the potential spread of the disease. Their results showed that the exponential growth bias was prevalent in people’s understanding of the virus’s spread, with most people vastly underestimating the rate of increase. More importantly, the team found that those beliefs were directly linked to the participants’ views on the best ways to contain the spread. The worse their estimates, the less likely they were to understand the need for social distancing: the exponential growth bias had made them complacent about the official advice.

The charts that politicians show often fail to communicate exponential growth effectively (Credit: Reuters)

The charts that politicians show often fail to communicate exponential growth effectively (Credit: Reuters)

This chimes with other findings by Ritwik Banerjee and Priyama Majumda at the Indian Institute of Management in Bangalore, and Joydeep Bhattacharya at Iowa State University. In their study (currently under peer-review), they found susceptibility to the exponential growth bias can predict reduced compliance with the World Health Organization’s recommendations – including mask wearing, handwashing, the use of sanitisers and self-isolation.

The researchers speculate that some of the graphical representations found in the media may have been counter-productive. It’s common for the number of infections to be presented on a “logarithmic scale”, in which the figures on the y-axis increase by a power of 10 (so the gap between 1 and 10 is the same as the gap between 10 and 100, or 100 and 1000).

While this makes it easier to plot different regions with low and high growth rates, it means that exponential growth looks more linear than it really is, which could reinforce the exponential growth bias. “To expect people to use the logarithmic scale to extrapolate the growth path of a disease is to demand a very high level of cognitive ability,” the authors told me in an email. In their view, simple numerical tables may actually be more powerful.

Even a small effort to correct this bias could bring huge benefits

The good news is that people’s views are malleable. When Lammers and colleagues reminded the participants of the exponential growth bias, and asked them to calculate the growth in regular steps over a two week period, people hugely improved their estimates of the disease’s spread – and this, in turn, changed their views on social distancing. Sele, meanwhile, has recently shown that small changes in framing can matter. Emphasising the short amount of time that it will take to reach a large number of cases, for instance – and the time that would be gained by social distancing measures – improves people’s understanding of accelerating growth, rather than simply stating the percentage increase each day.

Lammers believes that the exponential nature of the virus needs to be made more salient in coverage of the pandemic. “I think this study shows how media and government should report on a pandemic in such a situation. Not only report the numbers of today and growth over the past week, but also explain what will happen in the next days, week, month, if the same accelerating growth persists,” he says.

He is confident that even a small effort to correct this bias could bring huge benefits. In the US, where the pandemic has hit hardest, it took only a few months for the virus to infect more than five million people, he says. “If we could have overcome the exponential growth bias and had convinced all Americans of this risk back in March, I am sure 99% would have embraced all possible distancing measures.”

David Robson is the author of The Intelligence Trap: Why Smart People Do Dumb Things (WW Norton/Hodder & Stoughton), which examines the psychology of irrational thinking and the best ways to make wiser decisions.

An ant-inspired approach to mathematical sampling (Science Daily)

Date: June 19, 2020

Source: University of Bristol

Summary: Researchers have observed the exploratory behavior of ants to inform the development of a more efficient mathematical sampling technique.

In a paper published by the Royal Society, a team of Bristol researchers observed the exploratory behaviour of ants to inform the development of a more efficient mathematical sampling technique.

Animals like ants have the challenge of exploring their environment to look for food and potential places to live. With a large group of individuals, like an ant colony, a large amount of time would be wasted if the ants repeatedly explored the same empty areas.

The interdisciplinary team from the University of Bristol’s Faculties of Engineering and Life Sciences, predicted that the study species — the ‘rock ant’ — uses some form of chemical communication to avoid exploring the same space multiple times.

Lead author, Dr Edmund Hunt, said:

“This would be a reversal of the Hansel and Gretel story — instead of following each other’s trails, they would avoid them in order to explore collectively.

“To test this theory, we conducted an experiment where we let ants explore an empty arena one by one. In the first condition, we cleaned the arena between each ant so they could not leave behind any trace of their path. In the second condition, we did not clean between ants. The ants in the second condition (no cleaning) made a better exploration of the arena — they covered more space.”

In mathematics, a probability distribution describes how likely are each of a set of different possible outcomes: for example, the chance that an ant will find food at a certain place. In many science and engineering problems, these distributions are highly complex, and they do not have a neat mathematical description. Instead, one must sample from it to obtain a good approximation: with a desire to avoid sampling too much from unimportant (low probability) parts of the distribution.

The team wanted to find out if adopting an ant-inspired approach would hasten this sampling process.

“We predicted that we could simulate the approach adopted by the ants in the mathematical sampling problem, by leaving behind a ‘negative trail’ of where has already been sampled. We found that our ant-inspired sampling method was more efficient (faster) than a standard method which does not leave a memory of where has already been sampled,” said Dr Hunt.

These findings contribute toward an interesting parallel between the exploration problem confronted by the ants, and the mathematical sampling problem of acquiring information. This parallel can inform our fundamental understanding of what the ants have evolved to do: acquire information more efficiently.

“Our ant-inspired sampling method may be useful in many domains, such as computational biology, for speeding up the analysis of complex problems. By describing the ants’ collective behaviour in informational terms, it also allows us to quantify how helpful are different aspects of their behaviour to their success. For example, how much better do they perform when their pheromones are not cleaned away. This could allow us to make predictions about which behavioural mechanisms are most likely to be favoured by natural selection.”


Story Source:

Materials provided by University of Bristol. Note: Content may be edited for style and length.


Journal Reference:

  1. Edmund R. Hunt, Nigel R. Franks, Roland J. Baddeley. The Bayesian superorganism: externalized memories facilitate distributed sampling. Journal of The Royal Society Interface, 2020; 17 (167): 20190848 DOI: 10.1098/rsif.2019.0848

Claudio Maierovitch Pessanha Henriques: O mito do pico (Folha de S.Paulo)

www1.folha.uol.com.br

Claudio Maierovitch Pessanha Henriques – 6 de maio de 2020

Desde o início da epidemia de doença causada pelo novo coronavírus (Covid-19), a grande pergunta tem sido “quando acaba?” Frequentemente, são divulgadas na mídia e nas redes sociais projeções as mais variadas sobre a famosa curva da doença em vários países e no mundo, algumas recentes, mostrando a tendência de que os casos deixem de surgir no início do segundo semestre deste ano.

Tais modelos partem do pressuposto de que há uma história, uma curva natural da doença, que começa, sobe, atinge um pico e começa a cair. Vamos analisar o sentido de tal raciocínio. Muitas doenças transmissíveis agudas, quando atingem uma população nova, expandem-se rapidamente, numa velocidade que depende de seu chamado número reprodutivo básico, ou R0 (“R zero”, que estima para quantas pessoas o portador de um agente infeccioso o transmite).

Quando uma quantidade grande de pessoas tiver adoecido ou se infectado mesmo sem sintomas, os contatos entre portadores e pessoas que não tiveram a doença começam a se tornar raros. Num cenário em que pessoas sobreviventes da infecção fiquem imunes àquele agente, sua proporção cresce e a transmissão se torna cada vez mais rara. Assim, a curva, que vinha subindo, fica horizontal e começa a cair, podendo até mesmo chegar a zero, situação em que o agente deixa de circular.

Em populações grandes, é muito raro que uma doença seja completamente eliminada desta forma, por isso a incidência cresce novamente de tempos em tempos. Quando a quantidade de pessoas que não se infectaram, somada à dos bebês que nascem e pessoas sem imunidade que vieram de outros lugares é suficientemente grande, então a curva sobe novamente.

É assim, de forma simplificada, que a ciência entende a ocorrência periódica de epidemias de doenças infecciosas agudas. A história nos ilustra com numerosos exemplos, como varíola, sarampo, gripe, rubéola, poliomielite, caxumba, entre muitos outros. Dependendo das características da doença e da sociedade, são ciclos ilustrados por sofrimento, sequelas e mortes. Realmente, nesses casos, é possível estimar a duração das epidemias e, em alguns casos, até mesmo prever as próximas.

A saúde pública tem diversas ferramentas para interferir em muitos desses casos, indicados para diferentes mecanismos de transmissão, como saneamento, medidas de higiene, isolamento, combate a vetores, uso de preservativos, extinção de fontes de contaminação, vacinas e tratamentos capazes de eliminar os microrganismos. A vacinação, ação específica de saúde considerada mais efetiva, simula o que acontece naturalmente, ao aumentar a quantidade de pessoas imunes na população até que a doença deixe de circular, sem que para isso pessoas precisem adoecer.

No caso da Covid-19, há estimativas de que para a doença deixar de circular intensamente será preciso que cerca de 70% da população seja infectada. Isso se chama imunidade coletiva (também se adota a desagradável denominação “imunidade de rebanho”). Quanto à situação atual de disseminação do coronavírus Sars-CoV-2, a Organização Mundial da Saúde (OMS) calcula que até a metade de abril apenas de 2% a 3% da população mundial terá sido infectada. Estimativas para o Brasil são um pouco inferiores a essa média.

Trocando em miúdos, para que a doença atinja naturalmente seu pico no país e comece a cair, será preciso esperar que 140 milhões de pessoas se infectem. A mais conservadora (menor) taxa de letalidade encontrada nas publicações sobre a Covid-19 é de 0,36%, mais ou menos um vigésimo daquela que os números oficiais de casos e mortes revelam. Isso significa que até o Brasil atingir o pico, contaremos 500 mil mortes se o sistema de saúde não ultrapassar seus limites —e, caso isso aconteça, um número muito maior.

Atingir o pico é sinônimo de catástrofe, não é uma aposta admissível, sobretudo quando constatamos que já está esgotada a capacidade de atendimento hospitalar em várias cidades, como Manaus, Rio de Janeiro e Fortaleza —outras seguem o mesmo caminho.

A única perspectiva aceitável é evitar o pico, e a única forma de fazê-lo é com medidas rigorosas de afastamento físico. A cota de contatos entre as pessoas deve ficar reservada às atividades essenciais, entre elas saúde, segurança, cadeias de suprimento de combustíveis, alimentos, produtos de limpeza, materiais e equipamentos de uso em saúde, limpeza, manutenção e mais um ou outro setor. Alguma dose de criatividade pode permitir ampliar um pouco esse leque, desde que os meios de transporte e vias públicas permaneçam vazios o suficiente para que seja mantida a distância mínima entre as pessoas.

O monitoramento do número de casos e mortes, que revela a transmissão com duas a três semanas de defasagem, deverá ser aprimorado e utilizado em conjunto com estudos baseados em testes laboratoriais para indicar o rigor das medidas de isolamento.

Se conseguirmos evitar a tragédia maior, vamos conviver com um longo período de restrição de atividades, mais de um ano, e teremos que aprender a organizar a vida e a economia de outras formas, além de passar por alguns períodos de “lockdown” —cerca de duas semanas cada, se a curva apontar novamente para o pico.

Hoje, a situação é grave e tende a se tornar crítica. O Brasil é o país com a maior taxa de transmissão da doença; é hora de ficar em casa e, se for imprescindível sair, fazer da máscara uma parte inseparável da vestimenta e manter rigorosamente todos os cuidados indicados.​

Steven Pinker talks Donald Trump, the media, and how the world is better off today than ever before (ABC Australia)

Updated

“By many measures of human flourishing the state of humanity has been improving,” renowned cognitive scientist Steven Pinker says, a view often in contrast to the highlights of the 24-hour news cycle and the recent “counter-enlightenment” movement of Donald Trump.

“Fewer of us are dying of disease, fewer of us are dying of hunger, more of us are living in democracies, were more affluent, better educated … these are trends that you can’t easily appreciate from the news because they never happen all at once,” he says.

Canadian-American thinker Steven Pinker is the author of Bill Gates’s new favourite book — Enlightenment Now — in which he maintains that historically speaking the world is significantly better than ever before.

But he says the media’s narrow focus on negative anomalies can result in “systematically distorted” views of the world.

Speaking to the ABC’s The World program, Mr Pinker gave his views on Donald Trump, distorted perceptions and the simple arithmetic that proves the world is better than ever before.

Donald Trump’s ‘counter-enlightenment’

“Trumpism is of course part of a larger phenomenon of authoritarian populism. This is a backlash against the values responsible for the progress that we’ve enjoyed. It’s a kind of counter-enlightenment ideology that Trumpism promotes. Namely, instead of universal human wellbeing, it focusses on the glory of the nation, it assumes that nations are in zero-sum competition against each other as opposed to cooperating globally. It ignores the institutions of democracy which were specifically implemented to avoid a charismatic authoritarian leader from wielding power, but subjects him or her to the restraints of a governed system with checks and balances, which Donald Trump seems to think is rather a nuisance to his own ability to voice the greatness of the people directly. So in many ways all of the enlightenment forces we have enjoyed, are being pushed back by Trump. But this is a tension that has been in play for a couple of hundred years. No sooner did the enlightenment happen that a counter-enlightenment grew up to oppose it, and every once in a while it does make reappearances.”

News media can ‘systematically distort’ perceptions

“If your impression of the world is driven by journalism, then as long as various evils haven’t gone to zero there’ll always be enough of them to fill the news. And if journalism isn’t accompanied by a bit of historical context, that is not just what’s bad now but how bad it was in the past, and statistical context, namely how many wars? How many terrorist attacks? What is the rate of homicide? Then our intuitions, since they’re driven by images and narratives and anecdotes, can be systematically distorted by the news unless it’s presented in historical and statistical context.

‘Simple arithmetic’: The world is getting better

“It’s just a simple matter of arithmetic. You can’t look at how much there is right now and say that it is increasing or decreasing until you compare it with how much took place in the past. When you look at how much took place in the past you realise how much worse things were in the 50s, 60s, 70s and 80s. We don’t appreciate it now when we concentrate on the remaining horrors, but there were horrific wars such as the Iran-Iraq war, the Soviets in Afghanistan, the war in Vietnam, the partition of India, the Bangladesh war of independence, the Korean War, which killed far more people than even the brutal wars of today. And if we only focus on the present, we ought to be aware of the suffering that continues to exist, but we can’t take that as evidence that things have gotten worse unless we remember what happened in the past.”

Don’t equate inequality with poverty

“Globally, inequality is decreasing. That is, if you don’t look within a wealthy country like Britain or the United States, but look across the globe either comparing countries or comparing people worldwide. As best as we can tell, inequality is decreasing because so many poor countries are getting richer faster than rich countries are getting richer. Now within the wealthy countries of the anglosphere, inequality is increasing. And although inequality brings with it a number of serious problems such as disproportionate political power to the wealthy. But inequality itself is not a problem. What we have to focus on is the wellbeing of those at the bottom end of the scale, the poor and the lower middle class. And those have not actually been decreasing once you take into account government transfers and benefits. Now this is a reason we shouldn’t take for granted, the important role of government transfers and benefits. It’s one of the reasons why the non-English speaking wealthy democracies tend to have greater equality than the English speaking ones. But we shouldn’t confuse inequality with poverty.”

Algoritmos das rede sociais promovem preconceito e desigualdade, diz matemática de Harvard (BBC Brasil)

AlgoritmosPara Cathy O’Neil, por trás da aparente imparcialidade ddos algoritmos escondem-se critérios nebulosos que agravam injustiças. GETTY IMAGES

Eles estão por toda parte. Nos formulários que preenchemos para vagas de emprego. Nas análises de risco a que somos submetidos em contratos com bancos e seguradoras. Nos serviços que solicitamos pelos nossos smartphones. Nas propagandas e nas notícias personalizadas que abarrotam nossas redes sociais. E estão aprofundando o fosso da desigualdade social e colocando em risco as democracias.

Definitivamente, não é com entusiasmo que a americana Cathy O’Neil enxerga a revolução dos algoritmos, sistemas capazes de organizar uma quantidade cada vez mais impressionante de informações disponíveis na internet, o chamado Big Data.

Matemática com formação em Harvard e Massachussetts Institute of Technology (MIT), duas das mais prestigiadas universidades do mundo, ela abandonou em 2012 uma bem-sucedida carreira no mercado financeiro e na cena das startups de tecnologia para estudar o assunto a fundo.

Quatro anos depois, publicou o livro Weapons of Math Destruction (Armas de Destruição em Cálculos, em tradução livre, um trocadilho com a expressão “armas de destruição em massa” em inglês) e tornou-se uma das vozes mais respeitadas no país sobre os efeitos colaterais da economia do Big Data.

A obra é recheada de exemplos de modelos matemáticos atuais que ranqueiam o potencial de seres humanos como estudantes, trabalhadores, criminosos, eleitores e consumidores. Segundo a autora, por trás da aparente imparcialidade desses sistemas, escondem-se critérios nebulosos que agravam injustiças.

É o caso dos seguros de automóveis nos Estados Unidos. Motoristas que nunca tomaram uma multa sequer, mas que tinham restrições de crédito por morarem em bairros pobres, pagavam valores consideravelmente mais altos do que aqueles com facilidade de crédito, mas já condenados por dirigirem embriagados. “Para a seguradora, é um ganha-ganha. Um bom motorista com restrição de crédito representa um risco baixo e um retorno altíssimo”, exemplifica.

Confira abaixo os principais trechos da entrevista:

BBC Brasil – Há séculos pesquisadores analisam dados para entender padrões de comportamento e prever acontecimentos. Qual é novidade trazida pelo Big Data?

Cathy O’Neil – O diferencial do Big Data é a quantidade de dados disponíveis. Há uma montanha gigantesca de dados que se correlacionam e que podem ser garimpados para produzir a chamada “informação incidental”. É incidental no sentido de que uma determinada informação não é fornecida diretamente – é uma informação indireta. É por isso que as pessoas que analisam os dados do Twitter podem descobrir em qual político eu votaria. Ou descobrir se eu sou gay apenas pela análise dos posts que curto no Facebook, mesmo que eu não diga que sou gay.

Ambiente de trabalho automatizado‘Essa ideia de que os robôs vão substituir o trabalho humano é muito fatalista. É preciso reagir e mostrar que essa é uma batalha política’, diz autora. GETTY IMAGES

A questão é que esse processo é cumulativo. Agora que é possível descobrir a orientação sexual de uma pessoa a partir de seu comportamento nas redes sociais, isso não vai ser “desaprendido”. Então, uma das coisas que mais me preocupam é que essas tecnologias só vão ficar melhores com o passar do tempo. Mesmo que as informações venham a ser limitadas – o que eu acho que não vai acontecer – esse acúmulo de conhecimento não vai se perder.

BBC Brasil – O principal alerta do seu livro é de que os algoritmos não são ferramentas neutras e objetivas. Pelo contrário: eles são enviesados pelas visões de mundo de seus programadores e, de forma geral, reforçam preconceitos e prejudicam os mais pobres. O sonho de que a internet pudesse tornar o mundo um lugar melhor acabou?

O’Neil – É verdade que a internet fez do mundo um lugar melhor em alguns contextos. Mas, se colocarmos numa balança os prós e os contras, o saldo é positivo? É difícil dizer. Depende de quem é a pessoa que vai responder. É evidente que há vários problemas. Só que muitos exemplos citados no meu livro, é importante ressaltar, não têm nada a ver com a internet. As prisões feitas pela polícia ou as avaliações de personalidade aplicadas em professores não têm a ver estritamente com a internet. Não há como evitar que isso seja feito, mesmo que as pessoas evitem usar a internet. Mas isso foi alimentado pela tecnologia de Big Data.

Por exemplo: os testes de personalidade em entrevistas de emprego. Antes, as pessoas se candidatavam a uma vaga indo até uma determinada loja que precisava de um funcionário. Mas hoje todo mundo se candidata pela internet. É isso que gera os testes de personalidade. Existe uma quantidade tão grande de pessoas se candidatando a vagas que é necessário haver algum filtro.

BBC Brasil – Qual é o futuro do trabalho sob os algoritmos?

O’Neil – Testes de personalidade e programas que filtram currículos são alguns exemplos de como os algoritmos estão afetando o mundo do trabalho. Isso sem mencionar os algoritmos que ficam vigiando as pessoas enquanto elas trabalham, como é o caso de professores e caminhoneiros. Há um avanço da vigilância. Se as coisas continuarem indo do jeito como estão, isso vai nos transformar em robôs.

Reprodução de propaganda no Facebook usada para influenciar as eleições nos EUAReprodução de propaganda no Facebook usada para influenciar as eleições nos EUA: ‘não deveriam ser permitidos anúncios personalizados, customizados’, opina autora

Mas eu não quero pensar nisso como um fato inevitável – que os algoritmos vão transformar as pessoas em robôs ou que os robôs vão substituir o trabalho dos seres humanos. Eu não quero admitir isso. Isso é algo que podemos decidir que não vai acontecer. É uma decisão política. Essa ideia de que os robôs vão substituir o trabalho humano é muito fatalista. É preciso reagir e mostrar que essa é uma batalha política. O problema é que estamos tão intimidados pelo avanço dessas tecnologias que sentimos que não há como lutar contra.

BBC Brasil – E no caso das companhias de tecnologia como a Uber? Alguns estudiosos usam o termo “gig economy” (economia de “bicos”) para se referir à organização do trabalho feita por empresas que utilizam algoritmos.

O’Neil – Esse é um ótimo exemplo de como entregamos o poder a essas empresas da gig economy, como se fosse um processo inevitável. Certamente, elas estão se saindo muito bem na tarefa de burlar legislações trabalhistas, mas isso não quer dizer que elas deveriam ter permissão para agir dessa maneira. Essas companhias deveriam pagar melhores remunerações e garantir melhores condições de trabalho.

No entanto, os movimentos que representam os trabalhadores ainda não conseguiram assimilar as mudanças que estão ocorrendo. Mas essa não é uma questão essencialmente algorítmica. O que deveríamos estar perguntando é: como essas pessoas estão sendo tratadas? E, se elas não estão sendo bem tratadas, deveríamos criar leis para garantir isso.

Eu não estou dizendo que os algoritmos não têm nada a ver com isso – eles têm, sim. É uma forma que essas companhias usam para dizer que elas não podem ser consideradas “chefes” desses trabalhadores. A Uber, por exemplo, diz que os motoristas são autônomos e que o algoritmo é o chefe. Esse é um ótimo exemplo de como nós ainda não entendemos o que se entende por “responsabilidade” no mundo dos algoritmos. Essa é uma questão em que venho trabalhando há algum tempo: que pessoas vão ser responsabilizadas pelos erros dos algoritmos?

BBC Brasil – No livro você argumenta que é possível criar algoritmos para o bem – o principal desafio é garantir transparência. Porém, o segredo do sucesso de muitas empresas é justamente manter em segredo o funcionamento dos algoritmos. Como resolver a contradição?

O’Neil – Eu não acho que seja necessária transparência para que um algoritmo seja bom. O que eu preciso saber é se ele funciona bem. Eu preciso de indicadores de que ele funciona bem, mas isso não quer dizer que eu necessite conhecer os códigos de programação desse algoritmo. Os indicadores podem ser de outro tipo – é mais uma questão de auditoria do que de abertura dos códigos.

A melhor maneira de resolver isso é fazer com que os algoritmos sejam auditados por terceiros. Não é recomendável confiar nas próprias empresas que criaram os algoritmos. Precisaria ser um terceiro, com legitimidade, para determinar se elas estão operando de maneira justa – a partir da definição de alguns critérios de justiça – e procedendo dentro da lei.

Cathy O'NeilPara Cathy O’Neil, polarização política e fake news só vão parar se “fecharmos o Facebook”. DIVULGAÇÃO

BBC Brasil – Recentemente, você escreveu um artigo para o jornal New York Times defendendo que a comunidade acadêmica participe mais dessa discussão. As universidades poderiam ser esse terceiro de que você está falando?

O’Neil – Sim, com certeza. Eu defendo que as universidades sejam o espaço para refletir sobre como construir confiabilidade, sobre como requerer informações para determinar se os algoritmos estão funcionando.

BBC Brasil – Quando vieram a público as revelações de Edward Snowden de que o governo americano espionava a vida das pessoas através da internet, muita gente não se surpreendeu. As pessoas parecem dispostas a abrir mão da sua privacidade em nome da eficiência da vida virtual?

O’Neil – Eu acho que só agora estamos percebendo quais são os verdadeiros custos dessa troca. Com dez anos de atraso, estamos percebendo que os serviços gratuitos na internet não são gratuitos de maneira alguma, porque nós fornecemos nossos dados pessoais. Há quem argumente que existe uma troca consentida de dados por serviços, mas ninguém faz essa troca de forma realmente consciente – nós fazemos isso sem prestar muita atenção. Além disso, nunca fica claro para nós o que realmente estamos perdendo.

Mas não é pelo fato de a NSA (sigla em inglês para a Agência de Segurança Nacional) nos espionar que estamos entendendo os custos dessa troca. Isso tem mais a ver com os empregos que nós arrumamos ou deixamos de arrumar. Ou com os benefícios de seguros e de cartões de crédito que nós conseguimos ou deixamos de conseguir. Mas eu gostaria que isso estivesse muito mais claro.

No nível individual ainda hoje, dez anos depois, as pessoas não se dão conta do que está acontecendo. Mas, como sociedade, estamos começando a entender que fomos enganados por essa troca. E vai ser necessário um tempo para saber como alterar os termos desse acordo.

Aplicativo do Uber‘A Uber, por exemplo, diz que os motoristas são autônomos e que o algoritmo é o chefe. Esse é um ótimo exemplo de como nós ainda não entendemos o que se entende por “responsabilidade” no mundo dos algoritmos’, diz O’Neil. EPA

BBC Brasil – O último capítulo do seu livro fala sobre a vitória eleitoral de Donald Trump e avalia como as pesquisas de opinião e as redes sociais influenciaram na corrida à Casa Branca. No ano que vem, as eleições no Brasil devem ser as mais agitadas das últimas três décadas. Que conselho você daria aos brasileiros?

O’Neil – Meu Deus, isso é muito difícil! Está acontecendo em todas as partes do mundo. E eu não sei se isso vai parar, a não ser que fechem o Facebook – o que, a propósito, eu sugiro que façamos. Agora, falando sério: as campanhas políticas na internet devem ser permitidas, mas não deveriam ser permitidos anúncios personalizados, customizados – ou seja, todo mundo deveria receber os mesmos anúncios. Eu sei que essa ainda não é uma proposta realista, mas acho que deveríamos pensar grande porque esse problema é grande. E eu não consigo pensar em outra maneira de resolver essa questão.

É claro que isso seria um elemento de um conjunto maior de medidas porque nada vai impedir pessoas idiotas de acreditar no que elas querem acreditar – e de postar sobre isso. Ou seja, nem sempre é um problema do algoritmo. Às vezes, é um problema das pessoas mesmo. O fenômeno das fake news é um exemplo. Os algoritmos pioram a situação, personalizando as propagandas e amplificando o alcance, porém, mesmo que não existisse o algoritmo do Facebook e que as propagandas políticas fossem proibidas na internet, ainda haveria idiotas disseminando fake news que acabariam viralizando nas redes sociais. E eu não sei o que fazer a respeito disso, a não ser fechar as redes sociais.

Eu tenho três filhos, eles têm 17, 15 e 9 anos. Eles não usam redes sociais porque acham que são bobas e eles não acreditam em nada do que veem nas redes sociais. Na verdade, eles não acreditam em mais nada – o que também não é bom. Mas o lado positivo é que eles estão aprendendo a checar informações por conta própria. Então, eles são consumidores muito mais conscientes do que os da minha geração. Eu tenho 45 anos, a minha geração é a pior. As coisas que eu vi as pessoas da minha idade compartilhando após a eleição de Trump eram ridículas. Pessoas postando ideias sobre como colocar Hilary Clinton na presidência mesmo sabendo que Trump tinha vencido. Foi ridículo. A esperança é ter uma geração de pessoas mais espertas.

The new astrology (Aeon)

By fetishising mathematical models, economists turned economics into a highly paid pseudoscience

04 April, 2016

Alan Jay Levinovitz is an assistant professor of philosophy and religion at James Madison University in Virginia. His most recent book is The Gluten Lie: And Other Myths About What You Eat (2015).Edited by Sam Haselby


What would make economics a better discipline?

Since the 2008 financial crisis, colleges and universities have faced increased pressure to identify essential disciplines, and cut the rest. In 2009, Washington State University announced it would eliminate the department of theatre and dance, the department of community and rural sociology, and the German major – the same year that the University of Louisiana at Lafayette ended its philosophy major. In 2012, Emory University in Atlanta did away with the visual arts department and its journalism programme. The cutbacks aren’t restricted to the humanities: in 2011, the state of Texas announced it would eliminate nearly half of its public undergraduate physics programmes. Even when there’s no downsizing, faculty salaries have been frozen and departmental budgets have shrunk.

But despite the funding crunch, it’s a bull market for academic economists. According to a 2015 sociological study in the Journal of Economic Perspectives, the median salary of economics teachers in 2012 increased to $103,000 – nearly $30,000 more than sociologists. For the top 10 per cent of economists, that figure jumps to $160,000, higher than the next most lucrative academic discipline – engineering. These figures, stress the study’s authors, do not include other sources of income such as consulting fees for banks and hedge funds, which, as many learned from the documentary Inside Job (2010), are often substantial. (Ben Bernanke, a former academic economist and ex-chairman of the Federal Reserve, earns $200,000-$400,000 for a single appearance.)

Unlike engineers and chemists, economists cannot point to concrete objects – cell phones, plastic – to justify the high valuation of their discipline. Nor, in the case of financial economics and macroeconomics, can they point to the predictive power of their theories. Hedge funds employ cutting-edge economists who command princely fees, but routinely underperform index funds. Eight years ago, Warren Buffet made a 10-year, $1 million bet that a portfolio of hedge funds would lose to the S&P 500, and it looks like he’s going to collect. In 1998, a fund that boasted two Nobel Laureates as advisors collapsed, nearly causing a global financial crisis.

The failure of the field to predict the 2008 crisis has also been well-documented. In 2003, for example, only five years before the Great Recession, the Nobel Laureate Robert E Lucas Jr told the American Economic Association that ‘macroeconomics […] has succeeded: its central problem of depression prevention has been solved’. Short-term predictions fair little better – in April 2014, for instance, a survey of 67 economists yielded 100 per cent consensus: interest rates would rise over the next six months. Instead, they fell. A lot.

Nonetheless, surveys indicate that economists see their discipline as ‘the most scientific of the social sciences’. What is the basis of this collective faith, shared by universities, presidents and billionaires? Shouldn’t successful and powerful people be the first to spot the exaggerated worth of a discipline, and the least likely to pay for it?

In the hypothetical worlds of rational markets, where much of economic theory is set, perhaps. But real-world history tells a different story, of mathematical models masquerading as science and a public eager to buy them, mistaking elegant equations for empirical accuracy.

As an extreme example, take the extraordinary success of Evangeline Adams, a turn-of-the-20th-century astrologer whose clients included the president of Prudential Insurance, two presidents of the New York Stock Exchange, the steel magnate Charles M Schwab, and the banker J P Morgan. To understand why titans of finance would consult Adams about the market, it is essential to recall that astrology used to be a technical discipline, requiring reams of astronomical data and mastery of specialised mathematical formulas. ‘An astrologer’ is, in fact, the Oxford English Dictionary’s second definition of ‘mathematician’. For centuries, mapping stars was the job of mathematicians, a job motivated and funded by the widespread belief that star-maps were good guides to earthly affairs. The best astrology required the best astronomy, and the best astronomy was done by mathematicians – exactly the kind of person whose authority might appeal to bankers and financiers.

In fact, when Adams was arrested in 1914 for violating a New York law against astrology, it was mathematics that eventually exonerated her. During the trial, her lawyer Clark L Jordan emphasised mathematics in order to distinguish his client’s practice from superstition, calling astrology ‘a mathematical or exact science’. Adams herself demonstrated this ‘scientific’ method by reading the astrological chart of the judge’s son. The judge was impressed: the plaintiff, he observed, went through a ‘mathematical process to get at her conclusions… I am satisfied that the element of fraud… is absent here.’

Romer compares debates among economists to those between 16th-century advocates of heliocentrism and geocentrism

The enchanting force of mathematics blinded the judge – and Adams’s prestigious clients – to the fact that astrology relies upon a highly unscientific premise, that the position of stars predicts personality traits and human affairs such as the economy. It is this enchanting force that explains the enduring popularity of financial astrology, even today. The historian Caley Horan at the Massachusetts Institute of Technology described to me how computing technology made financial astrology explode in the 1970s and ’80s. ‘Within the world of finance, there’s always a superstitious, quasi-spiritual trend to find meaning in markets,’ said Horan. ‘Technical analysts at big banks, they’re trying to find patterns in past market behaviour, so it’s not a leap for them to go to astrology.’ In 2000, USA Today quoted Robin Griffiths, the chief technical analyst at HSBC, the world’s third largest bank, saying that ‘most astrology stuff doesn’t check out, but some of it does’.

Ultimately, the problem isn’t with worshipping models of the stars, but rather with uncritical worship of the language used to model them, and nowhere is this more prevalent than in economics. The economist Paul Romer at New York University has recently begun calling attention to an issue he dubs ‘mathiness’ – first in the paper ‘Mathiness in the Theory of Economic Growth’ (2015) and then in a series of blog posts. Romer believes that macroeconomics, plagued by mathiness, is failing to progress as a true science should, and compares debates among economists to those between 16th-century advocates of heliocentrism and geocentrism. Mathematics, he acknowledges, can help economists to clarify their thinking and reasoning. But the ubiquity of mathematical theory in economics also has serious downsides: it creates a high barrier to entry for those who want to participate in the professional dialogue, and makes checking someone’s work excessively laborious. Worst of all, it imbues economic theory with unearned empirical authority.

‘I’ve come to the position that there should be a stronger bias against the use of math,’ Romer explained to me. ‘If somebody came and said: “Look, I have this Earth-changing insight about economics, but the only way I can express it is by making use of the quirks of the Latin language”, we’d say go to hell, unless they could convince us it was really essential. The burden of proof is on them.’

Right now, however, there is widespread bias in favour of using mathematics. The success of math-heavy disciplines such as physics and chemistry has granted mathematical formulas with decisive authoritative force. Lord Kelvin, the 19th-century mathematical physicist, expressed this quantitative obsession:

When you can measure what you are speaking about and express it in numbers you know something about it; but when you cannot measure it… in numbers, your knowledge is of a meagre and unsatisfactory kind.

The trouble with Kelvin’s statement is that measurement and mathematics do not guarantee the status of science – they guarantee only the semblance of science. When the presumptions or conclusions of a scientific theory are absurd or simply false, the theory ought to be questioned and, eventually, rejected. The discipline of economics, however, is presently so blinkered by the talismanic authority of mathematics that theories go overvalued and unchecked.

Romer is not the first to elaborate the mathiness critique. In 1886, an article in Science accused economics of misusing the language of the physical sciences to conceal ‘emptiness behind a breastwork of mathematical formulas’. More recently, Deirdre N McCloskey’s The Rhetoric of Economics(1998) and Robert H Nelson’s Economics as Religion (2001) both argued that mathematics in economic theory serves, in McCloskey’s words, primarily to deliver the message ‘Look at how very scientific I am.’

After the Great Recession, the failure of economic science to protect our economy was once again impossible to ignore. In 2009, the Nobel Laureate Paul Krugman tried to explain it in The New York Times with a version of the mathiness diagnosis. ‘As I see it,’ he wrote, ‘the economics profession went astray because economists, as a group, mistook beauty, clad in impressive-looking mathematics, for truth.’ Krugman named economists’ ‘desire… to show off their mathematical prowess’ as the ‘central cause of the profession’s failure’.

The mathiness critique isn’t limited to macroeconomics. In 2014, the Stanford financial economist Paul Pfleiderer published the paper‘Chameleons: The Misuse of Theoretical Models in Finance and Economics’, which helped to inspire Romer’s understanding of mathiness. Pfleiderer called attention to the prevalence of ‘chameleons’ – economic models ‘with dubious connections to the real world’ that substitute ‘mathematical elegance’ for empirical accuracy. Like Romer, Pfleiderer wants economists to be transparent about this sleight of hand. ‘Modelling,’ he told me, ‘is now elevated to the point where things have validity just because you can come up with a model.’

The notion that an entire culture – not just a few eccentric financiers – could be bewitched by empty, extravagant theories might seem absurd. How could all those people, all that math, be mistaken? This was my own feeling as I began investigating mathiness and the shaky foundations of modern economic science. Yet, as a scholar of Chinese religion, it struck me that I’d seen this kind of mistake before, in ancient Chinese attitudes towards the astral sciences. Back then, governments invested incredible amounts of money in mathematical models of the stars. To evaluate those models, government officials had to rely on a small cadre of experts who actually understood the mathematics – experts riven by ideological differences, who couldn’t even agree on how to test their models. And, of course, despite collective faith that these models would improve the fate of the Chinese people, they did not.

Astral Science in Early Imperial China, a forthcoming book by the historian Daniel P Morgan, shows that in ancient China, as in the Western world, the most valuable type of mathematics was devoted to the realm of divinity – to the sky, in their case (and to the market, in ours). Just as astrology and mathematics were once synonymous in the West, the Chinese spoke of li, the science of calendrics, which early dictionaries also glossed as ‘calculation’, ‘numbers’ and ‘order’. Li models, like macroeconomic theories, were considered essential to good governance. In the classic Book of Documents, the legendary sage king Yao transfers the throne to his successor with mention of a single duty: ‘Yao said: “Oh thou, Shun! The li numbers of heaven rest in thy person.”’

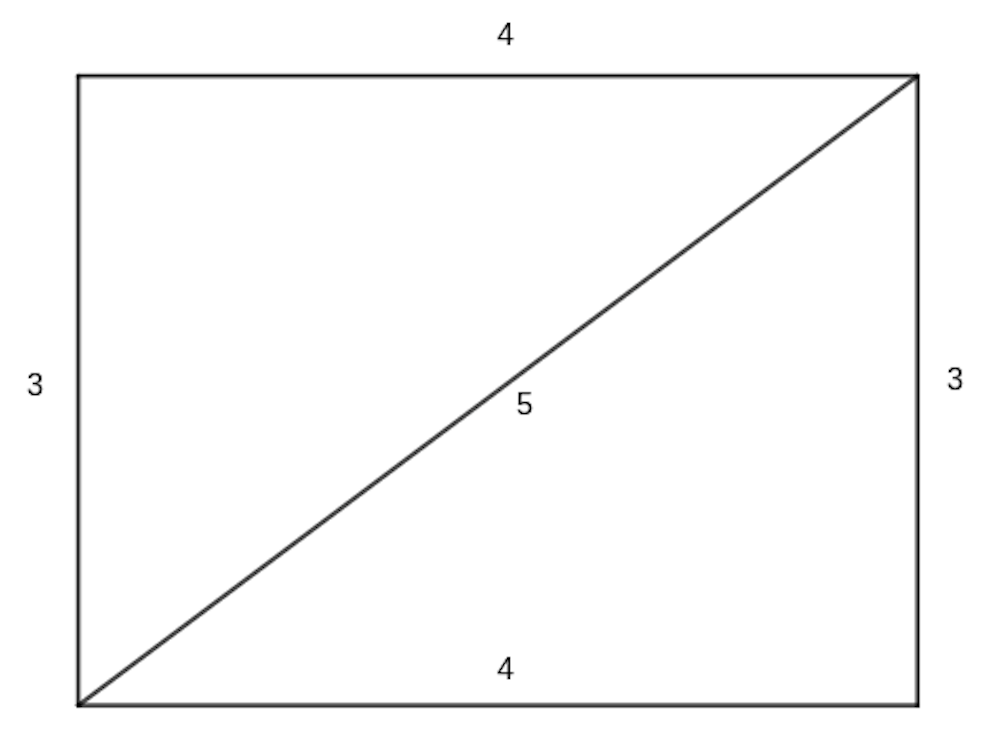
China’s oldest mathematical text invokes astronomy and divine kingship in its very title – The Arithmetical Classic of the Gnomon of the Zhou. The title’s inclusion of ‘Zhou’ recalls the mythic Eden of the Western Zhou dynasty (1045–771 BCE), implying that paradise on Earth can be realised through proper calculation. The book’s introduction to the Pythagorean theorem asserts that ‘the methods used by Yu the Great in governing the world were derived from these numbers’. It was an unquestioned article of faith: the mathematical patterns that govern the stars also govern the world. Faith in a divine, invisible hand, made visible by mathematics. No wonder that a newly discovered text fragment from 200 BCE extolls the virtues of mathematics over the humanities. In it, a student asks his teacher whether he should spend more time learning speech or numbers. His teacher replies: ‘If my good sir cannot fathom both at once, then abandon speech and fathom numbers, [for] numbers can speak, [but] speech cannot number.’

Modern governments, universities and businesses underwrite the production of economic theory with huge amounts of capital. The same was true for li production in ancient China. The emperor – the ‘Son of Heaven’ – spent astronomical sums refining mathematical models of the stars. Take the armillary sphere, such as the two-metre cage of graduated bronze rings in Nanjing, made to represent the celestial sphere and used to visualise data in three-dimensions. As Morgan emphasises, the sphere was literally made of money. Bronze being the basis of the currency, governments were smelting cash by the metric ton to pour it into li. A divine, mathematical world-engine, built of cash, sanctifying the powers that be.

The enormous investment in li depended on a huge assumption: that good government, successful rituals and agricultural productivity all depended upon the accuracy of li. But there were, in fact, no practical advantages to the continued refinement of li models. The calendar rounded off decimal points such that the difference between two models, hotly contested in theory, didn’t matter to the final product. The work of selecting auspicious days for imperial ceremonies thus benefited only in appearance from mathematical rigour. And of course the comets, plagues and earthquakes that these ceremonies promised to avert kept on coming. Farmers, for their part, went about business as usual. Occasional governmental efforts to scientifically micromanage farm life in different climes using li ended in famine and mass migration.

Like many economic models today, li models were less important to practical affairs than their creators (and consumers) thought them to be. And, like today, only a few people could understand them. In 101 BCE, Emperor Wudi tasked high-level bureaucrats – including the Great Director of the Stars – with creating a new li that would glorify the beginning of his path to immortality. The bureaucrats refused the task because ‘they couldn’t do the math’, and recommended the emperor outsource it to experts.

The equivalent in economic theory might be to grant a model high points for success in predicting short-term markets, while failing to deduct for missing the Great Recession

The debates of these ancient li experts bear a striking resemblance to those of present-day economists. In 223 CE, a petition was submitted to the emperor asking him to approve tests of a new li model developed by the assistant director of the astronomical office, a man named Han Yi.

At the time of the petition, Han Yi’s model, and its competitor, the so-called Supernal Icon, had already been subjected to three years of ‘reference’, ‘comparison’ and ‘exchange’. Still, no one could agree which one was better. Nor, for that matter, was there any agreement on how they should be tested.

In the end, a live trial involving the prediction of eclipses and heliacal risings was used to settle the debate. With the benefit of hindsight, we can see this trial was seriously flawed. The helical rising (first visibility) of planets depends on non-mathematical factors such as eyesight and atmospheric conditions. That’s not to mention the scoring of the trial, which was modelled on archery competitions. Archers scored points for proximity to the bullseye, with no consideration for overall accuracy. The equivalent in economic theory might be to grant a model high points for success in predicting short-term markets, while failing to deduct for missing the Great Recession.

None of this is to say that li models were useless or inherently unscientific. For the most part, li experts were genuine mathematical virtuosos who valued the integrity of their discipline. Despite being based on inaccurate assumptions – that the Earth was at the centre of the cosmos – their models really did work to predict celestial motions. Imperfect though the live trial might have been, it indicates that superior predictive power was a theory’s most important virtue. All of this is consistent with real science, and Chinese astronomy progressed as a science, until it reached the limits imposed by its assumptions.

However, there was no science to the belief that accurate li would improve the outcome of rituals, agriculture or government policy. No science to the Hall of Light, a temple for the emperor built on the model of a magic square. There, by numeric ritual gesture, the Son of Heaven was thought to channel the invisible order of heaven for the prosperity of man. This was quasi-theology, the belief that heavenly patterns – mathematical patterns – could be used to model every event in the natural world, in politics, even the body. Macro- and microcosm were scaled reflections of one another, yin and yang in a unifying, salvific mathematical vision. The expensive gadgets, the personnel, the bureaucracy, the debates, the competition – all of this testified to the divinely authoritative power of mathematics. The result, then as now, was overvaluation of mathematical models based on unscientific exaggerations of their utility.

In ancient China it would have been unfair to blame li experts for the pseudoscientific exploitation of their theories. These men had no way to evaluate the scientific merits of assumptions and theories – ‘science’, in a formalised, post-Enlightenment sense, didn’t really exist. But today it is possible to distinguish, albeit roughly, science from pseudoscience, astronomy from astrology. Hypothetical theories, whether those of economists or conspiracists, aren’t inherently pseudoscientific. Conspiracy theories can be diverting – even instructive – flights of fancy. They become pseudoscience only when promoted from fiction to fact without sufficient evidence.

Romer believes that fellow economists know the truth about their discipline, but don’t want to admit it. ‘If you get people to lower their shield, they’ll tell you it’s a big game they’re playing,’ he told me. ‘They’ll say: “Paul, you may be right, but this makes us look really bad, and it’s going to make it hard for us to recruit young people.”’

Demanding more honesty seems reasonable, but it presumes that economists understand the tenuous relationship between mathematical models and scientific legitimacy. In fact, many assume the connection is obvious – just as in ancient China, the connection between li and the world was taken for granted. When reflecting in 1999 on what makes economics more scientific than the other social sciences, the Harvard economist Richard B Freeman explained that economics ‘attracts stronger students than [political science or sociology], and our courses are more mathematically demanding’. In Lives of the Laureates (2004), Robert E Lucas Jr writes rhapsodically about the importance of mathematics: ‘Economic theory is mathematical analysis. Everything else is just pictures and talk.’ Lucas’s veneration of mathematics leads him to adopt a method that can only be described as a subversion of empirical science:

The construction of theoretical models is our way to bring order to the way we think about the world, but the process necessarily involves ignoring some evidence or alternative theories – setting them aside. That can be hard to do – facts are facts – and sometimes my unconscious mind carries out the abstraction for me: I simply fail to see some of the data or some alternative theory.

Even for those who agree with Romer, conflict of interest still poses a problem. Why would skeptical astronomers question the emperor’s faith in their models? In a phone conversation, Daniel Hausman, a philosopher of economics at the University of Wisconsin, put it bluntly: ‘If you reject the power of theory, you demote economists from their thrones. They don’t want to become like sociologists.’

George F DeMartino, an economist and an ethicist at the University of Denver, frames the issue in economic terms. ‘The interest of the profession is in pursuing its analysis in a language that’s inaccessible to laypeople and even some economists,’ he explained to me. ‘What we’ve done is monopolise this kind of expertise, and we of all people know how that gives us power.’

Every economist I interviewed agreed that conflicts of interest were highly problematic for the scientific integrity of their field – but only tenured ones were willing to go on the record. ‘In economics and finance, if I’m trying to decide whether I’m going to write something favourable or unfavourable to bankers, well, if it’s favourable that might get me a dinner in Manhattan with movers and shakers,’ Pfleiderer said to me. ‘I’ve written articles that wouldn’t curry favour with bankers but I did that when I had tenure.’

When mathematical theory is the ultimate arbiter of truth, it becomes difficult to see the difference between science and pseudoscience

Then there’s the additional problem of sunk-cost bias. If you’ve invested in an armillary sphere, it’s painful to admit that it doesn’t perform as advertised. When confronted with their profession’s lack of predictive accuracy, some economists find it difficult to admit the truth. Easier, instead, to double down, like the economist John H Cochrane at the University of Chicago. The problem isn’t too much mathematics, he writes in response to Krugman’s 2009 post-Great-Recession mea culpa for the field, but rather ‘that we don’t have enough math’. Astrology doesn’t work, sure, but only because the armillary sphere isn’t big enough and the equations aren’t good enough.

If overhauling economics depended solely on economists, then mathiness, conflict of interest and sunk-cost bias could easily prove insurmountable. Fortunately, non-experts also participate in the market for economic theory. If people remain enchanted by PhDs and Nobel Prizes awarded for the production of complicated mathematical theories, those theories will remain valuable. If they become disenchanted, the value will drop.

Economists who rationalise their discipline’s value can be convincing, especially with prestige and mathiness on their side. But there’s no reason to keep believing them. The pejorative verb ‘rationalise’ itself warns of mathiness, reminding us that we often deceive each other by making prior convictions, biases and ideological positions look ‘rational’, a word that confuses truth with mathematical reasoning. To be rational is, simply, to think in ratios, like the ratios that govern the geometry of the stars. Yet when mathematical theory is the ultimate arbiter of truth, it becomes difficult to see the difference between science and pseudoscience. The result is people like the judge in Evangeline Adams’s trial, or the Son of Heaven in ancient China, who trust the mathematical exactitude of theories without considering their performance – that is, who confuse math with science, rationality with reality.

There is no longer any excuse for making the same mistake with economic theory. For more than a century, the public has been warned, and the way forward is clear. It’s time to stop wasting our money and recognise the high priests for what they really are: gifted social scientists who excel at producing mathematical explanations of economies, but who fail, like astrologers before them, at prophecy.

What Did Neanderthals Leave to Modern Humans? Some Surprises (New York Times)

Geneticists tell us that somewhere between 1 and 5 percent of the genome of modern Europeans and Asians consists of DNA inherited from Neanderthals, our prehistoric cousins.

At Vanderbilt University, John Anthony Capra, an evolutionary genomics professor, has been combining high-powered computation and a medical records databank to learn what a Neanderthal heritage — even a fractional one — might mean for people today.

We spoke for two hours when Dr. Capra, 35, recently passed through New York City. An edited and condensed version of the conversation follows.

Q. Let’s begin with an indiscreet question. How did contemporary people come to have Neanderthal DNA on their genomes?

A. We hypothesize that roughly 50,000 years ago, when the ancestors of modern humans migrated out of Africa and into Eurasia, they encountered Neanderthals. Matings must have occurred then. And later.

One reason we deduce this is because the descendants of those who remained in Africa — present day Africans — don’t have Neanderthal DNA.

What does that mean for people who have it? 

At my lab, we’ve been doing genetic testing on the blood samples of 28,000 patients at Vanderbilt and eight other medical centers across the country. Computers help us pinpoint where on the human genome this Neanderthal DNA is, and we run that against information from the patients’ anonymized medical records. We’re looking for associations.

What we’ve been finding is that Neanderthal DNA has a subtle influence on risk for disease. It affects our immune system and how we respond to different immune challenges. It affects our skin. You’re slightly more prone to a condition where you can get scaly lesions after extreme sun exposure. There’s an increased risk for blood clots and tobacco addiction.

To our surprise, it appears that some Neanderthal DNA can increase the risk for depression; however, there are other Neanderthal bits that decrease the risk. Roughly 1 to 2 percent of one’s risk for depression is determined by Neanderthal DNA. It all depends on where on the genome it’s located.

Was there ever an upside to having Neanderthal DNA?

It probably helped our ancestors survive in prehistoric Europe. When humans migrated into Eurasia, they encountered unfamiliar hazards and pathogens. By mating with Neanderthals, they gave their offspring needed defenses and immunities.

That trait for blood clotting helped wounds close up quickly. In the modern world, however, this trait means greater risk for stroke and pregnancy complications. What helped us then doesn’t necessarily now.

Did you say earlier that Neanderthal DNA increases susceptibility to nicotine addiction?

Yes. Neanderthal DNA can mean you’re more likely to get hooked on nicotine, even though there were no tobacco plants in archaic Europe.

We think this might be because there’s a bit of Neanderthal DNA right next to a human gene that’s a neurotransmitter implicated in a generalized risk for addiction. In this case and probably others, we think the Neanderthal bits on the genome may serve as switches that turn human genes on or off.

Aside from the Neanderthals, do we know if our ancestors mated with other hominids?

We think they did. Sometimes when we’re examining genomes, we can see the genetic afterimages of hominids who haven’t even been identified yet.

A few years ago, the Swedish geneticist Svante Paabo received an unusual fossilized bone fragment from Siberia. He extracted the DNA, sequenced it and realized it was neither human nor Neanderthal. What Paabo found was a previously unknown hominid he named Denisovan, after the cave where it had been discovered. It turned out that Denisovan DNA can be found on the genomes of modern Southeast Asians and New Guineans.

Have you long been interested in genetics?

Growing up, I was very interested in history, but I also loved computers. I ended up majoring in computer science at college and going to graduate school in it; however, during my first year in graduate school, I realized I wasn’t very motivated by the problems that computer scientists worked on.

Fortunately, around that time — the early 2000s — it was becoming clear that people with computational skills could have a big impact in biology and genetics. The human genome had just been mapped. What an accomplishment! We now had the code to what makes you, you, and me, me. I wanted to be part of that kind of work.

So I switched over to biology. And it was there that I heard about a new field where you used computation and genetics research to look back in time — evolutionary genomics.

There may be no written records from prehistory, but genomes are a living record. If we can find ways to read them, we can discover things we couldn’t know any other way.

Not long ago, the two top editors of The New England Journal of Medicine published an editorial questioning “data sharing,” a common practice where scientists recycle raw data other researchers have collected for their own studies. They labeled some of the recycling researchers, “data parasites.” How did you feel when you read that?

I was upset. The data sets we used were not originally collected to specifically study Neanderthal DNA in modern humans. Thousands of patients at Vanderbilt consented to have their blood and their medical records deposited in a “biobank” to find genetic diseases.

Three years ago, when I set up my lab at Vanderbilt, I saw the potential of the biobank for studying both genetic diseases and human evolution. I wrote special computer programs so that we could mine existing data for these purposes.

That’s not being a “parasite.” That’s moving knowledge forward. I suspect that most of the patients who contributed their information are pleased to see it used in a wider way.

What has been the response to your Neanderthal research since you published it last year in the journal Science?

Some of it’s very touching. People are interested in learning about where they came from. Some of it is a little silly. “I have a lot of hair on my legs — is that from Neanderthals?”

But I received racist inquiries, too. I got calls from all over the world from people who thought that since Africans didn’t interbreed with Neanderthals, this somehow justified their ideas of white superiority.

It was illogical. Actually, Neanderthal DNA is mostly bad for us — though that didn’t bother them.

As you do your studies, do you ever wonder about what the lives of the Neanderthals were like?

It’s hard not to. Genetics has taught us a tremendous amount about that, and there’s a lot of evidence that they were much more human than apelike.

They’ve gotten a bad rap. We tend to think of them as dumb and brutish. There’s no reason to believe that. Maybe those of us of European heritage should be thinking, “Let’s improve their standing in the popular imagination. They’re our ancestors, too.’”

Researchers model how ‘publication bias’ does, and doesn’t, affect the ‘canonization’ of facts in science (Science Daily)

Date:
December 20, 2016
Source:
University of Washington
Summary:
Researchers present a mathematical model that explores whether “publication bias” — the tendency of journals to publish mostly positive experimental results — influences how scientists canonize facts.

Arguing in a Boston courtroom in 1770, John Adams famously pronounced, “Facts are stubborn things,” which cannot be altered by “our wishes, our inclinations or the dictates of our passion.”

But facts, however stubborn, must pass through the trials of human perception before being acknowledged — or “canonized” — as facts. Given this, some may be forgiven for looking at passionate debates over the color of a dress and wondering if facts are up to the challenge.

Carl Bergstrom believes facts stand a fighting chance, especially if science has their back. A professor of biology at the University of Washington, he has used mathematical modeling to investigate the practice of science, and how science could be shaped by the biases and incentives inherent to human institutions.

“Science is a process of revealing facts through experimentation,” said Bergstrom. “But science is also a human endeavor, built on human institutions. Scientists seek status and respond to incentives just like anyone else does. So it is worth asking — with precise, answerable questions — if, when and how these incentives affect the practice of science.”

In an article published Dec. 20 in the journal eLife, Bergstrom and co-authors present a mathematical model that explores whether “publication bias” — the tendency of journals to publish mostly positive experimental results — influences how scientists canonize facts. Their results offer a warning that sharing positive results comes with the risk that a false claim could be canonized as fact. But their findings also offer hope by suggesting that simple changes to publication practices can minimize the risk of false canonization.

These issues have become particularly relevant over the past decade, as prominent articles have questioned the reproducibility of scientific experiments — a hallmark of validity for discoveries made using the scientific method. But neither Bergstrom nor most of the scientists engaged in these debates are questioning the validity of heavily studied and thoroughly demonstrated scientific truths, such as evolution, anthropogenic climate change or the general safety of vaccination.

“We’re modeling the chances of ‘false canonization’ of facts on lower levels of the scientific method,” said Bergstrom. “Evolution happens, and explains the diversity of life. Climate change is real. But we wanted to model if publication bias increases the risk of false canonization at the lowest levels of fact acquisition.”

Bergstrom cites a historical example of false canonization in science that lies close to our hearts — or specifically, below them. Biologists once postulated that bacteria caused stomach ulcers. But in the 1950s, gastroenterologist E.D. Palmer reported evidence that bacteria could not survive in the human gut.

“These findings, supported by the efficacy of antacids, supported the alternative ‘chemical theory of ulcer development,’ which was subsequently canonized,” said Bergstrom. “The problem was that Palmer was using experimental protocols that would not have detected Helicobacter pylori, the bacteria that we know today causes ulcers. It took about a half century to correct this falsehood.”

While the idea of false canonization itself may cause dyspepsia, Bergstrom and his team — lead author Silas Nissen of the Niels Bohr Institute in Denmark and co-authors Kevin Gross of North Carolina State University and UW undergraduate student Tali Magidson — set out to model the risks of false canonization given the fact that scientists have incentives to publish only their best, positive results. The so-called “negative results,” which show no clear, definitive conclusions or simply do not affirm a hypothesis, are much less likely to be published in peer-reviewed journals.

“The net effect of publication bias is that negative results are less likely to be seen, read and processed by scientific peers,” said Bergstrom. “Is this misleading the canonization process?”

For their model, Bergstrom’s team incorporated variables such as the rates of error in experiments, how much evidence is needed to canonize a claim as fact and the frequency with which negative results are published. Their mathematical model showed that the lower the publication rate is for negative results, the higher the risk for false canonization. And according to their model, one possible solution — raising the bar for canonization — didn’t help alleviate this risk.

“It turns out that requiring more evidence before canonizing a claim as fact did not help,” said Bergstrom. “Instead, our model showed that you need to publish more negative results — at least more than we probably are now.”

Since most negative results live out their obscurity in the pages of laboratory notebooks, it is difficult to quantify the ratio that are published. But clinical trials, which must be registered with the U.S. Food and Drug Administration before they begin, offer a window into how often negative results make it into the peer-reviewed literature. A 2008 analysis of 74 clinical trials for antidepressant drugs showed that scarcely more than 10 percent of negative results were published, compared to over 90 percent for positive results.

“Negative results are probably published at different rates in other fields of science,” said Bergstrom. “And new options today, such as self-publishing papers online and the rise of journals that accept some negative results, may affect this. But in general, we need to share negative results more than we are doing today.”

Their model also indicated that negative results had the biggest impact as a claim approached the point of canonization. That finding may offer scientists an easy way to prevent false canonization.

“By more closely scrutinizing claims as they achieve broader acceptance, we could identify false claims and keep them from being canonized,” said Bergstrom.

To Bergstrom, the model raises valid questions about how scientists choose to publish and share their findings — both positive and negative. He hopes that their findings pave the way for more detailed exploration of bias in scientific institutions, including the effects of funding sources and the different effects of incentives on different fields of science. But he believes a cultural shift is needed to avoid the risks of publication bias.

“As a community, we tend to say, ‘Damn it, this didn’t work, and I’m not going to write it up,'” said Bergstrom. “But I’d like scientists to reconsider that tendency, because science is only efficient if we publish a reasonable fraction of our negative findings.”


Journal Reference:

  1. Silas Boye Nissen, Tali Magidson, Kevin Gross, Carl T Bergstrom. Publication bias and the canonization of false factseLife, 2016; 5 DOI: 10.7554/eLife.21451

Global climate models do not easily downscale for regional predictions (Science Daily)

Date:
August 24, 2016
Source:
Penn State
Summary:
One size does not always fit all, especially when it comes to global climate models, according to climate researchers who caution users of climate model projections to take into account the increased uncertainties in assessing local climate scenarios.

One size does not always fit all, especially when it comes to global climate models, according to Penn State climate researchers.

“The impacts of climate change rightfully concern policy makers and stakeholders who need to make decisions about how to cope with a changing climate,” said Fuqing Zhang, professor of meteorology and director, Center for Advanced Data Assimilation and Predictability Techniques, Penn State. “They often rely upon climate model projections at regional and local scales in their decision making.”

Zhang and Michael Mann, Distinguished professor of atmospheric science and director, Earth System Science Center, were concerned that the direct use of climate model output at local or even regional scales could produce inaccurate information. They focused on two key climate variables, temperature and precipitation.

They found that projections of temperature changes with global climate models became increasingly uncertain at scales below roughly 600 horizontal miles, a distance equivalent to the combined widths of Pennsylvania, Ohio and Indiana. While climate models might provide useful information about the overall warming expected for, say, the Midwest, predicting the difference between the warming of Indianapolis and Pittsburgh might prove futile.

Regional changes in precipitation were even more challenging to predict, with estimates becoming highly uncertain at scales below roughly 1200 miles, equivalent to the combined width of all the states from the Atlantic Ocean through New Jersey across Nebraska. The difference between changing rainfall totals in Philadelphia and Omaha due to global warming, for example, would be difficult to assess. The researchers report the results of their study in the August issue of Advances in Atmospheric Sciences.

“Policy makers and stakeholders use information from these models to inform their decisions,” said Mann. “It is crucial they understand the limitation in the information the model projections can provide at local scales.”

Climate models provide useful predictions of the overall warming of the globe and the largest-scale shifts in patterns of rainfall and drought, but are considerably more hard pressed to predict, for example, whether New York City will become wetter or drier, or to deal with the effects of mountain ranges like the Rocky Mountains on regional weather patterns.

“Climate models can meaningfully project the overall global increase in warmth, rises in sea level and very large-scale changes in rainfall patterns,” said Zhang. “But they are uncertain about the potential significant ramifications on society in any specific location.”

The researchers believe that further research may lead to a reduction in the uncertainties. They caution users of climate model projections to take into account the increased uncertainties in assessing local climate scenarios.

“Uncertainty is hardly a reason for inaction,” said Mann. “Moreover, uncertainty can cut both ways, and we must be cognizant of the possibility that impacts in many regions could be considerably greater and more costly than climate model projections suggest.”

An Ancient Mayan Copernicus (The Current/UC Santa Barbara)

In a new paper, UCSB scholar says ancient hieroglyphic texts reveal Mayans made a major discovery in math, astronomy

By Jim Logan

Tuesday, August 16, 2016 – 09:00 – Santa Barbara, CA

The Observatory, Chich'en Itza

“The Observatory” at Chich’en Itza, the building where a Mayan astronomer would have worked. Photo Credit: GERARDO ALDANA

Venus Table

The Preface of the Venus Table of the Dresden Codex, first panel on left, and the first three pages of the Table.

Gerardo Aldana

Gerardo Aldana. Photo Credit: LEROY LAVERMAN

For more than 120 years the Venus Table of the Dresden Codex — an ancient Mayan book containing astronomical data — has been of great interest to scholars around the world. The accuracy of its observations, especially the calculation of a kind of ‘leap year’ in the Mayan Calendar, was deemed an impressive curiosity used primarily for astrology.

But UC Santa Barbara’s Gerardo Aldana, a professor of anthropology and of Chicana and Chicano studies, believes the Venus Table has been misunderstood and vastly underappreciated. In a new journal article, Aldana makes the case that the Venus Table represents a remarkable innovation in mathematics and astronomy — and a distinctly Mayan accomplishment. “That’s why I’m calling it ‘discovering discovery,’ ” he explained, “because it’s not just their discovery, it’s all the blinders that we have, that we’ve constructed and put in place that prevent us from seeing that this was their own actual scientific discovery made by Mayan people at a Mayan city.”

Multitasking science

Aldana’s paper, “Discovering Discovery: Chich’en Itza, the Dresden Codex Venus Table and 10th Century Mayan Astronomical Innovation,” in the Journal of Astronomy in Culture, blends the study of Mayan hieroglyphics (epigraphy), archaeology and astronomy to present a new interpretation of the Venus Table, which tracks the observable phases of the second planet from the Sun. Using this multidisciplinary approach, he said, a new reading of the table demonstrates that the mathematical correction of their “Venus calendar” — a sophisticated innovation — was likely developed at the city of Chich’en Itza during the Terminal Classic period (AD 800-1000). What’s more, the calculations may have been done under the patronage of K’ak’ U Pakal K’awiil, one of the city’s most prominent historical figures.

“This is the part that I find to be most rewarding, that when we get in here, we’re looking at the work of an individual Mayan, and we could call him or her a scientist, an astronomer,” Aldana said. “This person, who’s witnessing events at this one city during this very specific period of time, created, through their own creativity, this mathematical innovation.”

The Venus Table

Scholars have long known that the Preface to the Venus Table, Page 24 of the Dresden Codex, contained what Aldana called a “mathematical subtlety” in its hieroglyphic text. They even knew what it was for: to serve as a correction for Venus’s irregular cycle, which is 583.92 days. “So that means if you do anything on a calendar that’s based on days as a basic unit, there is going to be an error that accrues,” Aldana explained. It’s the same principle used for Leap Years in the Gregorian calendar. Scholars figured out the math for the Venus Table’s leap in the 1930s, Aldana said, “but the question is, what does it mean? Did they discover it way back in the 1st century BC? Did they discover it in the 16th? When did they discover it and what did it mean to them? And that’s where I come in.”

Unraveling the mystery demanded Aldana employ a unique set of skills. The first involved epigraphy, and it led to an important development: In poring over the Table’s hieroglyphics, he came to realize that a key verb, k’al, had a different meaning than traditionally interpreted. Used throughout the Table, k’al means “to enclose” and, in Aldana’s reading, had a historical and cosmological purpose.

Rethinking assumptions

That breakthrough led him to question the assumptions of what the Mayan scribe who authored the text was doing in the Table. Archaeologists and other scholars could see its observations of Venus were accurate, but insisted it was based in numerology. “They [the Maya] knew it was wrong, but the numerology was more important. And that’s what scholars have been saying for the last 70 years,” Aldana said.

“So what I’m saying is, let’s step back and make a different assumption,” he continued. “Let’s assume that they had historical records and they were keeping historical records of astronomical events and they were consulting them in the future — exactly what the Greeks did and the Egyptians and everybody else. That’s what they did. They kept these over a long period of time and then they found patterns within them. The history of Western astronomy is based entirely on this premise.”

To test his new assumption, Aldana turned to another Mayan archaeological site, Copán in Honduras. The former city-state has its own record of Venus, which matched as a historical record the observations in the Dresden Codex. “Now we’re just saying, let’s take these as historical records rather than numerology,” he said. “And when you do that, when you see it as historical record, it changes the interpretation.”

Putting the pieces together

The final piece of the puzzle was what Aldana, whose undergraduate degree was in mechanical engineering, calls “the machinery,” or how the pieces fit together. Scholars know the Mayans had accurate observations of Venus, and Aldana could see that they were historical, not numerological. The question was, Why? One hint lay more than 500 years in the future: Nicolaus Copernicus.

The great Polish astronomer stumbled into the heliocentric universe while trying to figure out the predictions for future dates of Easter, a challenging feat that requires good mathematical models. That’s what Aldana saw in the Venus Table. “They’re using Venus not just to strictly chart when it was going to appear, but they were using it for their ritual cycles,” he explained. “They had ritual activities when the whole city would come together and they would do certain events based on the observation of Venus. And that has to have a degree of accuracy, but it doesn’t have to have overwhelming accuracy. When you change that perspective of, ‘What are you putting these cycles together for?’ that’s the third component.”

Putting those pieces together, Aldana found there was a unique period of time during the occupation of Chichen’Itza when an ancient astronomer in the temple that was used to observe Venus would have seen the progressions of the planet and discovered it was a viable way to correct the calendar and to set their ritual events.

“If you say it’s just numerology that this date corresponds to; it’s not based on anything you can see. And if you say, ‘We’re just going to manipulate them [the corrections written] until they give us the most accurate trajectory,’ you’re not confining that whole thing in any historical time,” he said. “If, on the other hand, you say, ‘This is based on a historical record,’ that’s going to nail down the range of possibilities. And if you say that they were correcting it for a certain kind of purpose, then all of a sudden you have a very small window of when this discovery could have occurred.”

A Mayan achievement

By reinterpreting the work, Aldana said it puts the Venus Table into cultural context. It was an achievement of Mayan science, and not a numerological oddity. We might never know exactly who made that discovery, he noted, but recasting it as a historical work of science returns it to the Mayans.

“I don’t have a name for this person, but I have a name for the person who is probably one of the authority figures at the time,” Aldana said. “It’s the kind of thing where you know who the pope was, but you don’t know Copernicus’s name. You know the pope was giving him this charge, but the person who did it? You don’t know his or her name.”

Theoretical tiger chases statistical sheep to probe immune system behavior (Science Daily)

Physicists update predator-prey model for more clues on how bacteria evade attack from killer cells

Date:
April 29, 2016
Source:
IOP Publishing
Summary:
Studying the way that solitary hunters such as tigers, bears or sea turtles chase down their prey turns out to be very useful in understanding the interaction between individual white blood cells and colonies of bacteria. Researchers have created a numerical model that explores this behavior in more detail.

Studying the way that solitary hunters such as tigers, bears or sea turtles chase down their prey turns out to be very useful in understanding the interaction between individual white blood cells and colonies of bacteria. Reporting their results in the Journal of Physics A: Mathematical and Theoretical, researchers in Europe have created a numerical model that explores this behaviour in more detail.

Using mathematical expressions, the group can examine the dynamics of a single predator hunting a herd of prey. The routine splits the hunter’s motion into a diffusive part and a ballistic part, which represent the search for prey and then the direct chase that follows.

“We would expect this to be a fairly good approximation for many animals,” explained Ralf Metzler, who led the work and is based at the University of Potsdam in Germany.

Obstructions included

To further improve its analysis, the group, which includes scientists from the National Institute of Chemistry in Slovenia, and Sorbonne University in France, has incorporated volume effects into the latest version of its model. The addition means that prey can now inadvertently get in each other’s way and endanger their survival by blocking potential escape routes.

Thanks to this update, the team can study not just animal behaviour, but also gain greater insight into the way that killer cells such as macrophages (large white blood cells patrolling the body) attack colonies of bacteria.

One of the key parameters determining the life expectancy of the prey is the so-called ‘sighting range’ — the distance at which the prey is able to spot the predator. Examining this in more detail, the researchers found that the hunter profits more from the poor eyesight of the prey than from the strength of its own vision.

Long tradition with a new dimension

The analysis of predator-prey systems has a long tradition in statistical physics and today offers many opportunities for cooperative research, particularly in fields such as biology, biochemistry and movement ecology.

“With the ever more detailed experimental study of systems ranging from molecular processes in living biological cells to the motion patterns of animal herds and humans, the need for cross-fertilisation between the life sciences and the quantitative mathematical approaches of the physical sciences has reached a new dimension,” Metzler comments.

To help support this cross-fertilisation, he heads up a new section of the Journal of Physics A: Mathematical and Theoretical that is dedicated to biological modelling and examines the use of numerical techniques to study problems in the interdisciplinary field connecting biology, biochemistry and physics.


Journal Reference:

  1. Maria Schwarzl, Aljaz Godec, Gleb Oshanin, Ralf Metzler. A single predator charging a herd of prey: effects of self volume and predator–prey decision-makingJournal of Physics A: Mathematical and Theoretical, 2016; 49 (22): 225601 DOI: 10.1088/1751-8113/49/22/225601

Modelo matemático auxilia a planejar operação de reservatórios de água (Fapesp)

Sistema computacional desenvolvido por pesquisadores da USP e da Unicamp estabelece regras de racionamento de suprimento hídrico em períodos de seca

Pesquisadores da Escola Politécnica da Universidade de São Paulo (Poli-USP) e da Faculdade de Engenharia Civil, Arquitetura e Urbanismo da Universidade Estadual de Campinas (FEC-Unicamp) desenvolveram novos modelos matemáticos e computacionais voltados a otimizar a gestão e a operação de sistemas complexos de suprimento hídrico e de energia elétrica, como os existentes no Brasil.

Os modelos, que começaram a ser desenvolvidos no início dos anos 2000, foram aprimorados por meio do Projeto Temático “HidroRisco: Tecnologias de gestão de riscos aplicadas a sistemas de suprimento hídrico e de energia elétrica”, realizado com apoio da Fapesp.

“A ideia é que os modelos matemáticos e computacionais que desenvolvemos possam auxiliar os gestores dos sistemas de distribuição e abastecimento de água e energia elétrica na tomada de decisões que têm enormes impactos sociais e econômicos, como a de decretar racionamento”, disse Paulo Sérgio Franco Barbosa, professor da FEC-Unicamp e coordenador do projeto, à Agência Fapesp.

De acordo com Barbosa, muitas das tecnologias utilizadas hoje nos setores hídrico e energético no Brasil para gerir a oferta e a demanda e os riscos de desabastecimento de água e energia em situações de eventos climáticos extremos, como estiagem severa, foram desenvolvidas na década de 1970, quando as cidades brasileiras eram menores e o País não dispunha de um sistema hídrico e hidroenergético tão complexo como o atual.

Por essas razões, segundo ele, esses sistemas de gestão apresentam falhas como não levar em conta a conexão entre as diferentes bacias e não estimar a ocorrência de eventos climáticos mais extremos do que os que já aconteceram no passado ao planejar a operação de um sistema de reservatórios e distribuição de água.

“Houve falha no dimensionamento da capacidade de abastecimento de água do reservatório Cantareira, por exemplo, porque não se imaginou que aconteceria uma seca pior do que a que atingiu a bacia em 1953, considerado o ano mais seco da história do reservatório antes de 2014”, afirmou Barbosa.

A fim de aprimorar esses sistemas de gestão de risco existentes hoje, os pesquisadores desenvolveram novos modelos matemáticos e computacionais que simulam a operação de um sistema de suprimento hídrico ou de energia de forma integrada e em diferentes cenários de aumento de oferta e demanda de água.

“Por meio de algumas técnicas estatísticas e computacionais, os modelos que desenvolvemos são capazes de fazer simulações melhores e proteger mais um sistema de suprimento hídrico ou de energia elétrica contra riscos climáticos”, disse Barbosa.

Sisagua

Um dos modelos desenvolvidos pelos pesquisadores em colaboração com colegas da University of California em Los Angeles, nos Estados Unidos, é a plataforma de modelagem de otimização e simulação de sistemas de suprimento hídrico Sisagua.

A plataforma computacional integra e representa todas as fontes de abastecimento de um sistema de reservatórios e distribuição de água de cidades de grande porte, como São Paulo, incluindo os reservatórios, canais, dutos, estações de tratamento e de bombeamento.

“O Sisagua possibilita planejar a operação, estudar a capacidade de suprimento e avaliar alternativas de expansão ou de diminuição do fornecimento de um sistema de abastecimento de água de forma integrada”, apontou Barbosa.

Um dos diferenciais do modelo computacional, segundo o pesquisador, é estabelecer regras de racionamento de um sistema de reservatórios e distribuição de água de grande porte em períodos de seca, como o que São Paulo passou em 2014, de modo a minimizar os danos à população e à economia causados por um eventual racionamento.

Quando um dos reservatórios do sistema atinge um volume abaixo dos níveis normais e próximo do volume mínimo de operação, o modelo computacional indica um primeiro estágio de racionamento, reduzindo a oferta da água armazenada em 10%, por exemplo.

Se a crise de abastecimento do reservatório prolongar, o modelo matemático indica alternativas para minimizar a intensidade do racionamento distribuindo o corte de água de forma mais uniforme ao longo do período de escassez de água e entre os outros reservatórios do sistema.

“O Sisagua possui uma inteligência computacional que indica onde e quando cortar o fornecimento de água de um sistema de abastecimento hídrico, de modo a minimizar os danos no sistema e para a população e a economia de uma cidade”, afirmou Barbosa.

Sistema Cantareira

Os pesquisadores aplicaram o Sisagua para simular a operação e a gestão do sistema de distribuição de água da região metropolitana de São Paulo, que abastece cerca de 18 milhões de pessoas e é considerado um dos maiores do mundo, com vazão média de 67 metros cúbicos por segundo (m³/s).

O sistema de distribuição de água paulista é composto por oito subsistemas de abastecimento, sendo o maior deles o Cantareira, que fornece água para 5,3 milhões de pessoas, com vazão média de 33 m³/s.

A fim de avaliar a capacidade de suprimento do Cantareira em um cenário de escassez de água e, ao mesmo tempo, de aumento da demanda pelo recurso natural, os pesquisadores realizaram uma simulação de planejamento do uso do subsistema em um período de dez anos utilizando o Sisagua.

Para isso, eles usaram dados de vazões afluentes (de entrada de água) do Cantareira entre 1950 e 1960, fornecidos pela Companhia de Saneamento Básico do Estado de São Paulo (Sabesp).

“Essa período de tempo foi escolhido como base para as projeções do Sisagua porque registrou secas severas, quando as afluências ficaram significativamente abaixo das médias por quatro anos seguidos, entre 1952 e 1956”, explicou Barbosa.

A partir dos dados de vazão afluente desse série histórica, o modelo matemático e computacional analisou cenários com demanda variável de água do Cantareira entre 30 e 40 m³/s.

Algumas das constatações do modelo foram que o Cantareira é capaz de atender uma demanda de até 34 m³/s em um cenário de escassez de água como ocorreu entre 1950 a 1960 com um risco insignificante de desabastecimento. Acima desse valor a escassez e, consequentemente, o risco de racionamento de água no reservatório aumenta exponencialmente.

Para que o Cantareira possa atender uma demanda de 38 m³/s em um período de escassez de água, o modelo indicou que seria preciso começar a racionar a água do reservatório 40 meses (3 anos e 4 meses) antes que o nível da bacia atingisse o ponto crítico, abaixo do volume normal e próximo do limite mínimo de operação.

Dessa forma, seria possível atender entre 85% e 90% da demanda de água do reservatório no período de seca até que ele recuperasse seu volume ideal, evitando um racionamento mais grave do que aconteceria caso fosse mantido o nível pleno de abastecimento do reservatório.

“Quanto antes for feito o racionamento de água de um sistema de abastecimento hídrico melhor o prejuízo é distribuído ao longo do tempo”, disse Barbosa. “A população pode se preparar melhor para um racionamento de 15% de água durante um período de dois anos, por exemplo, do que um corte de 40% em apenas dois meses”, comparou.

Sistemas integrados

Em outro estudo, os pesquisadores usaram o Sisagua para avaliar a capacidade de os subsistemas Cantareira, Guarapiranga, Alto Tietê e Alto Cotia atenderem as atuais demandas de água em um cenário de escassez do recurso natural.

Para isso, eles também utilizaram dados de vazões afluentes dos quatro subsistemas no período de 1950 a 1960.

Os resultados das análises feitas pelo método matemático e computacional indicaram que o subsistema de Cotia atingiu um limite crítico de racionamento diversas vezes durante o período simulado de dez anos.

Em contrapartida, o subsistema Alto Tietê ficou com volume de água acima de sua meta frequentemente.

Com base nessas constatações, os pesquisadores sugerem novas interligações para transferência entre esses quatro subsistemas de abastecimento.

Parte da demanda de água do subsistema de Cotia poderia ser fornecida pelos subsistemas de Guarapiranga e Cantareira. Por outro lado, esses dois subsistemas também poderiam receber água do subsistema Alto Tietê, indicaram as projeções do Sisagua.

“A transferência de água entre os subsistemas proporcionaria maior flexibilidade e resultaria em uma melhor distribuição, eficiência e confiabilidade do sistema de abastecimento hídrico da região metropolitana de São Paulo”, avaliou Barbosa.

De acordo com o pesquisador, as projeções feitas pelo Sisagua também indicaram a necessidade de investimentos em novas fontes de abastecimento de água para a região metropolitana de São Paulo.

Segundo ele, as principais bacias que abastecem São Paulo sofrem de problemas como a concentração urbana.

Em torno da bacia do Alto Tietê, por exemplo, que ocupa apenas 2,7% do território paulista, está concentrada quase 50% da população do Estado de São Paulo, superando em cinco vezes a densidade demográfica de países como Japão, Coréia e Holanda.

Já as bacias de Piracicaba, Paraíba do Sul, Sorocaba e Baixada Santista – que representam 20% da área de São Paulo – concentram 73% da população paulista, com densidade demográfica superior ao de países como Japão, Holanda e Reino Unido, apontam os pesquisadores.

“Será inevitável pensar em outras fontes de abastecimento de água para a região metropolitana de São Paulo, como o sistema Juquiá, no interior do estado, que tem água de excelente quantidade e em grandes volumes”, disse Barbosa.

“Em razão da distância, essa obra será cara e tem sido postergada. Mas, agora, não dá mais para adiá-la”, afirmou.

Além de São Paulo, o Sisagua também foi utilizado para modelar os sistemas de suprimento hídrico de Los Angeles, nos Estados Unidos, e Taiwan.

O artigo “Planning and operation of large-scale water distribution systems with preemptive priorities”, (doi: 10.1061/(ASCE)0733-9496(2008)134:3(247)), de Barros e outros, pode ser lido por assinantes do Journal of Water Resources Planning and Managementem ascelibrary.org/doi/abs/10.1061/%28ASCE%290733-9496%282008%29134%3A3%28247%29.

Agência Fapesp

The Water Data Drought (N.Y.Times)

Then there is water.

Water may be the most important item in our lives, our economy and our landscape about which we know the least. We not only don’t tabulate our water use every hour or every day, we don’t do it every month, or even every year.

The official analysis of water use in the United States is done every five years. It takes a tiny team of people four years to collect, tabulate and release the data. In November 2014, the United States Geological Survey issued its most current comprehensive analysis of United States water use — for the year 2010.

The 2010 report runs 64 pages of small type, reporting water use in each state by quality and quantity, by source, and by whether it’s used on farms, in factories or in homes.

It doesn’t take four years to get five years of data. All we get every five years is one year of data.

The data system is ridiculously primitive. It was an embarrassment even two decades ago. The vast gaps — we start out missing 80 percent of the picture — mean that from one side of the continent to the other, we’re making decisions blindly.

In just the past 27 months, there have been a string of high-profile water crises — poisoned water in Flint, Mich.; polluted water in Toledo, Ohio, and Charleston, W. Va.; the continued drying of the Colorado River basin — that have undermined confidence in our ability to manage water.

In the time it took to compile the 2010 report, Texas endured a four-year drought. California settled into what has become a five-year drought. The most authoritative water-use data from across the West couldn’t be less helpful: It’s from the year before the droughts began.

In the last year of the Obama presidency, the administration has decided to grab hold of this country’s water problems, water policy and water innovation. Next Tuesday, the White House is hosting a Water Summit, where it promises to unveil new ideas to galvanize the sleepy world of water.

The question White House officials are asking is simple: What could the federal government do that wouldn’t cost much but that would change how we think about water?

The best and simplest answer: Fix water data.

More than any other single step, modernizing water data would unleash an era of water innovation unlike anything in a century.

We have a brilliant model for what water data could be: the Energy Information Administration, which has every imaginable data point about energy use — solar, wind, biodiesel, the state of the heating oil market during the winter we’re living through right now — all available, free, to anyone. It’s not just authoritative, it’s indispensable. Congress created the agency in the wake of the 1970s energy crisis, when it became clear we didn’t have the information about energy use necessary to make good public policy.

That’s exactly the state of water — we’ve got crises percolating all over, but lack the data necessary to make smart policy decisions.

Congress and President Obama should pass updated legislation creating inside the United States Geological Survey a vigorous water data agency with the explicit charge to gather and quickly release water data of every kind — what utilities provide, what fracking companies and strawberry growers use, what comes from rivers and reservoirs, the state of aquifers.

Good information does three things.

First, it creates the demand for more good information. Once you know what you can know, you want to know more.

Second, good data changes behavior. The real-time miles-per-gallon gauges in our cars are a great example. Who doesn’t want to edge the M.P.G. number a little higher? Any company, community or family that starts measuring how much water it uses immediately sees ways to use less.

Finally, data ignites innovation. Who imagined that when most everyone started carrying a smartphone, we’d have instant, nationwide traffic data? The phones make the traffic data possible, and they also deliver it to us.

The truth is, we don’t have any idea what detailed water use data for the United States will reveal. But we can be certain it will create an era of water transformation. If we had monthly data on three big water users — power plants, farmers and water utilities — we’d instantly see which communities use water well, and which ones don’t.

We’d see whether tomato farmers in California or Florida do a better job. We’d have the information to make smart decisions about conservation, about innovation and about investing in new kinds of water systems.

Water’s biggest problem, in this country and around the world, is its invisibility. You don’t tackle problems that are out of sight. We need a new relationship with water, and that has to start with understanding it.

Statisticians Found One Thing They Can Agree On: It’s Time To Stop Misusing P-Values (FiveThirtyEight)

Footnotes

  1. Even the Supreme Court has weighed in, unanimously ruling in 2011 that statistical significance does not automatically equate to scientific or policy importance. ^

Christie Aschwanden is FiveThirtyEight’s lead writer for science.

Semantically speaking: Does meaning structure unite languages? (Eureka/Santa Fe Institute)

1-FEB-2016

Humans’ common cognitive abilities and language dependance may provide an underlying semantic order to the world’s languages

SANTA FE INSTITUTE

We create words to label people, places, actions, thoughts, and more so we can express ourselves meaningfully to others. Do humans’ shared cognitive abilities and dependence on languages naturally provide a universal means of organizing certain concepts? Or do environment and culture influence each language uniquely?

Using a new methodology that measures how closely words’ meanings are related within and between languages, an international team of researchers has revealed that for many universal concepts, the world’s languages feature a common structure of semantic relatedness.

“Before this work, little was known about how to measure [a culture’s sense of] the semantic nearness between concepts,” says co-author and Santa Fe Institute Professor Tanmoy Bhattacharya. “For example, are the concepts of sun and moon close to each other, as they are both bright blobs in the sky? How about sand and sea, as they occur close by? Which of these pairs is the closer? How do we know?”

Translation, the mapping of relative word meanings across languages, would provide clues. But examining the problem with scientific rigor called for an empirical means to denote the degree of semantic relatedness between concepts.

To get reliable answers, Bhattacharya needed to fully quantify a comparative method that is commonly used to infer linguistic history qualitatively. (He and collaborators had previously developed this quantitative method to study changes in sounds of words as languages evolve.)

“Translation uncovers a disagreement between two languages on how concepts are grouped under a single word,” says co-author and Santa Fe Institute and Oxford researcher Hyejin Youn. “Spanish, for example, groups ‘fire’ and ‘passion’ under ‘incendio,’ whereas Swahili groups ‘fire’ with ‘anger’ (but not ‘passion’).”

To quantify the problem, the researchers chose a few basic concepts that we see in nature (sun, moon, mountain, fire, and so on). Each concept was translated from English into 81 diverse languages, then back into English. Based on these translations, a weighted network was created. The structure of the network was used to compare languages’ ways of partitioning concepts.

The team found that the translated concepts consistently formed three theme clusters in a network, densely connected within themselves and weakly to one another: water, solid natural materials, and earth and sky.

“For the first time, we now have a method to quantify how universal these relations are,” says Bhattacharya. “What is universal – and what is not – about how we group clusters of meanings teaches us a lot about psycholinguistics, the conceptual structures that underlie language use.”

The researchers hope to expand this study’s domain, adding more concepts, then investigating how the universal structure they reveal underlies meaning shift.

Their research was published today in PNAS.

The world’s greatest literature reveals multi fractals and cascades of consciousness (Science Daily)

Date: January 21, 2016

Source: The Henryk Niewodniczanski Institute of Nuclear Physics Polish Academy of Sciences

Summary: James Joyce, Julio Cortazar, Marcel Proust, Henryk Sienkiewicz and Umberto Eco. Regardless of the language they were working in, some of the world’s greatest writers appear to be, in some respects, constructing fractals. Statistical analysis, however, revealed something even more intriguing. The composition of works from within a particular genre was characterized by the exceptional dynamics of a cascading (avalanche) narrative structure.


Sequences of sentence lengths (as measured by number of words) in four literary works representative of various degree of cascading character. Credit: Source: IFJ PAN 

James Joyce, Julio Cortazar, Marcel Proust, Henryk Sienkiewicz and Umberto Eco. Regardless of the language they were working in, some of the world’s greatest writers appear to be, in some respects, constructing fractals. Statistical analysis carried out at the Institute of Nuclear Physics of the Polish Academy of Sciences, however, revealed something even more intriguing. The composition of works from within a particular genre was characterized by the exceptional dynamics of a cascading (avalanche) narrative structure. This type of narrative turns out to be multifractal. That is, fractals of fractals are created.

As far as many bookworms are concerned, advanced equations and graphs are the last things which would hold their interest, but there’s no escape from the math. Physicists from the Institute of Nuclear Physics of the Polish Academy of Sciences (IFJ PAN) in Cracow, Poland, performed a detailed statistical analysis of more than one hundred famous works of world literature, written in several languages and representing various literary genres. The books, tested for revealing correlations in variations of sentence length, proved to be governed by the dynamics of a cascade. This means that the construction of these books is in fact a fractal. In the case of several works their mathematical complexity proved to be exceptional, comparable to the structure of complex mathematical objects considered to be multifractal. Interestingly, in the analyzed pool of all the works, one genre turned out to be exceptionally multifractal in nature.

Fractals are self-similar mathematical objects: when we begin to expand one fragment or another, what eventually emerges is a structure that resembles the original object. Typical fractals, especially those widely known as the Sierpinski triangle and the Mandelbrot set, are monofractals, meaning that the pace of enlargement in any place of a fractal is the same, linear: if they at some point were rescaled x number of times to reveal a structure similar to the original, the same increase in another place would also reveal a similar structure.

Multifractals are more highly advanced mathematical structures: fractals of fractals. They arise from fractals ‘interwoven’ with each other in an appropriate manner and in appropriate proportions. Multifractals are not simply the sum of fractals and cannot be divided to return back to their original components, because the way they weave is fractal in nature. The result is that in order to see a structure similar to the original, different portions of a multifractal need to expand at different rates. A multifractal is therefore non-linear in nature.

“Analyses on multiple scales, carried out using fractals, allow us to neatly grasp information on correlations among data at various levels of complexity of tested systems. As a result, they point to the hierarchical organization of phenomena and structures found in nature. So we can expect natural language, which represents a major evolutionary leap of the natural world, to show such correlations as well. Their existence in literary works, however, had not yet been convincingly documented. Meanwhile, it turned out that when you look at these works from the proper perspective, these correlations appear to be not only common, but in some works they take on a particularly sophisticated mathematical complexity,” says Prof. Stanislaw Drozdz (IFJ PAN, Cracow University of Technology).

The study involved 113 literary works written in English, French, German, Italian, Polish, Russian and Spanish by such famous figures as Honore de Balzac, Arthur Conan Doyle, Julio Cortazar, Charles Dickens, Fyodor Dostoevsky, Alexandre Dumas, Umberto Eco, George Elliot, Victor Hugo, James Joyce, Thomas Mann, Marcel Proust, Wladyslaw Reymont, William Shakespeare, Henryk Sienkiewicz, JRR Tolkien, Leo Tolstoy and Virginia Woolf, among others. The selected works were no less than 5,000 sentences long, in order to ensure statistical reliability.

To convert the texts to numerical sequences, sentence length was measured by the number of words (an alternative method of counting characters in the sentence turned out to have no major impact on the conclusions). The dependences were then searched for in the data — beginning with the simplest, i.e. linear. This is the posited question: if a sentence of a given length is x times longer than the sentences of different lengths, is the same aspect ratio preserved when looking at sentences respectively longer or shorter?

“All of the examined works showed self-similarity in terms of organization of the lengths of sentences. Some were more expressive — here The Ambassadors by Henry James stood out — while others to far less of an extreme, as in the case of the French seventeenth-century romance Artamene ou le Grand Cyrus. However, correlations were evident, and therefore these texts were the construction of a fractal,” comments Dr. Pawel Oswiecimka (IFJ PAN), who also noted that fractality of a literary text will in practice never be as perfect as in the world of mathematics. It is possible to magnify mathematical fractals up to infinity, while the number of sentences in each book is finite, and at a certain stage of scaling there will always be a cut-off in the form of the end of the dataset.

Things took a particularly interesting turn when physicists from the IFJ PAN began tracking non-linear dependence, which in most of the studied works was present to a slight or moderate degree. However, more than a dozen works revealed a very clear multifractal structure, and almost all of these proved to be representative of one genre, that of stream of consciousness. The only exception was the Bible, specifically the Old Testament, which has so far never been associated with this literary genre.

“The absolute record in terms of multifractality turned out to be Finnegan’s Wake by James Joyce. The results of our analysis of this text are virtually indistinguishable from ideal, purely mathematical multifractals,” says Prof. Drozdz.

The most multifractal works also included A Heartbreaking Work of Staggering Genius by Dave Eggers, Rayuela by Julio Cortazar, The US Trilogy by John Dos Passos, The Waves by Virginia Woolf, 2666 by Roberto Bolano, and Joyce’s Ulysses. At the same time a lot of works usually regarded as stream of consciousness turned out to show little correlation to multifractality, as it was hardly noticeable in books such as Atlas Shrugged by Ayn Rand and A la recherche du temps perdu by Marcel Proust.

“It is not entirely clear whether stream of consciousness writing actually reveals the deeper qualities of our consciousness, or rather the imagination of the writers. It is hardly surprising that ascribing a work to a particular genre is, for whatever reason, sometimes subjective. We see, moreover, the possibility of an interesting application of our methodology: it may someday help in a more objective assignment of books to one genre or another,” notes Prof. Drozdz.

Multifractal analyses of literary texts carried out by the IFJ PAN have been published in Information Sciences, a journal of computer science. The publication has undergone rigorous verification: given the interdisciplinary nature of the subject, editors immediately appointed up to six reviewers.


Journal Reference:

  1. Stanisław Drożdż, Paweł Oświȩcimka, Andrzej Kulig, Jarosław Kwapień, Katarzyna Bazarnik, Iwona Grabska-Gradzińska, Jan Rybicki, Marek Stanuszek. Quantifying origin and character of long-range correlations in narrative textsInformation Sciences, 2016; 331: 32 DOI: 10.1016/j.ins.2015.10.023

The One Weird Trait That Predicts Whether You’re a Trump Supporter (Politico Magazine)

And it’s not gender, age, income, race or religion.

1/17/2016


If I asked you what most defines Donald Trump supporters, what would you say? They’re white? They’re poor? They’re uneducated?

You’d be wrong.

In fact, I’ve found a single statistically significant variable predicts whether a voter supports Trump—and it’s not race, income or education levels: It’s authoritarianism.

That’s right, Trump’s electoral strength—and his staying power—have been buoyed, above all, by Americans with authoritarian inclinations. And because of the prevalence of authoritarians in the American electorate, among Democrats as well as Republicans, it’s very possible that Trump’s fan base will continue to grow.

My finding is the result of a national poll I conducted in the last five days of December under the auspices of the University of Massachusetts, Amherst, sampling 1,800 registered voters across the country and the political spectrum. Running a standard statistical analysis, I found that education, income, gender, age, ideology and religiosity had no significant bearing on a Republican voter’s preferred candidate. Only two of the variables I looked at were statistically significant: authoritarianism, followed by fear of terrorism, though the former was far more significant than the latter.

Authoritarianism is not a new, untested concept in the American electorate. Since the rise of Nazi Germany, it has been one of the most widely studied ideas in social science. While its causes are still debated, the political behavior of authoritarians is not. Authoritarians obey. They rally to and follow strong leaders. And they respond aggressively to outsiders, especially when they feel threatened. From pledging to “make America great again” by building a wall on the border to promising to close mosques and ban Muslims from visiting the United States, Trump is playing directly to authoritarian inclinations.

Not all authoritarians are Republicans by any means; in national surveys since 1992, many authoritarians have also self-identified as independents and Democrats. And in the 2008 Democratic primary, the political scientist Marc Hetherington found that authoritarianism mattered more than income, ideology, gender, age and education in predicting whether voters preferred Hillary Clinton over Barack Obama. But Hetherington has also found, based on 14 years of polling, that authoritarians have steadily moved from the Democratic to the Republican Party over time. He hypothesizes that the trend began decades ago, as Democrats embraced civil rights, gay rights, employment protections and other political positions valuing freedom and equality. In my poll results, authoritarianism was not a statistically significant factor in the Democratic primary race, at least not so far, but it does appear to be playing an important role on the Republican side. Indeed, 49 percent of likely Republican primary voters I surveyed score in the top quarter of the authoritarian scale—more than twice as many as Democratic voters.

Political pollsters have missed this key component of Trump’s support because they simply don’t include questions about authoritarianism in their polls. In addition to the typical battery of demographic, horse race, thermometer-scale and policy questions, my poll asked a set of four simple survey questions that political scientists have employed since 1992 to measure inclination toward authoritarianism. These questions pertain to child-rearing: whether it is more important for the voter to have a child who is respectful or independent; obedient or self-reliant; well-behaved or considerate; and well-mannered or curious. Respondents who pick the first option in each of these questions are strongly authoritarian.

Based on these questions, Trump was the only candidate—Republican or Democrat—whose support among authoritarians was statistically significant.

So what does this mean for the election? It doesn’t just help us understand what motivates Trump’s backers—it suggests that his support isn’t capped. In a statistical analysis of the polling results, I found that Trump has already captured 43 percent of Republican primary voters who are strong authoritarians, and 37 percent of Republican authoritarians overall. A majority of Republican authoritarians in my poll also strongly supported Trump’s proposals to deport 11 million illegal immigrants, prohibit Muslims from entering the United States, shutter mosques and establish a nationwide database that track Muslims.

And in a general election, Trump’s strongman rhetoric will surely appeal to some of the 39 percent of independents in my poll who identify as authoritarians and the 17 percent of self-identified Democrats who are strong authoritarians.

What’s more, the number of Americans worried about the threat of terrorism is growing. In 2011, Hetherington published research finding that non-authoritarians respond to the perception of threat by behaving more like authoritarians. More fear and more threats—of the kind we’ve seen recently in the San Bernardino and Paris terrorist attacks—mean more voters are susceptible to Trump’s message about protecting Americans. In my survey, 52 percent of those voters expressing the most fear that another terrorist attack will occur in the United States in the next 12 months were non-authoritarians—ripe targets for Trump’s message.

Take activated authoritarians from across the partisan spectrum and the growing cadre of threatened non-authoritarians, then add them to the base of Republican general election voters, and the potential electoral path to a Trump presidency becomes clearer.

So, those who say a Trump presidency “can’t happen here” should check their conventional wisdom at the door. The candidate has confounded conventional expectations this primary season because those expectations are based on an oversimplified caricature of the electorate in general and his supporters in particular. Conditions are ripe for an authoritarian leader to emerge. Trump is seizing the opportunity. And the institutions—from the Republican Party to the press—that are supposed to guard against what James Madison called “the infection of violent passions” among the people have either been cowed by Trump’s bluster or are asleep on the job.

It is time for those who would appeal to our better angels to take his insurgency seriously and stop dismissing his supporters as a small band of the dispossessed. Trump support is firmly rooted in American authoritarianism and, once awakened, it is a force to be reckoned with. That means it’s also time for political pollsters to take authoritarianism seriously and begin measuring it in their polls.

Matthew MacWilliams is founder of MacWilliams Sanders, a political communications firms, and a Ph.D. candidate in political science at the University of Massachusetts, Amherst, where he is writing his dissertation about authoritarianism.

Read more: http://www.politico.com/magazine/story/2016/01/donald-trump-2016-authoritarian-213533#ixzz3xj06TM2n

Algoritmo quântico mostrou-se mais eficaz do que qualquer análogo clássico (Revista Fapesp)

11 de dezembro de 2015

José Tadeu Arantes | Agência FAPESP – O computador quântico poderá deixar de ser um sonho e se tornar realidade nos próximos 10 anos. A expectativa é que isso traga uma drástica redução no tempo de processamento, já que algoritmos quânticos oferecem soluções mais eficientes para certas tarefas computacionais do que quaisquer algoritmos clássicos correspondentes.

Até agora, acreditava-se que a chave da computação quântica eram as correlações entre dois ou mais sistemas. Exemplo de correlação quântica é o processo de “emaranhamento”, que ocorre quando pares ou grupos de partículas são gerados ou interagem de tal maneira que o estado quântico de cada partícula não pode ser descrito independentemente, já que depende do conjunto (Para mais informações veja agencia.fapesp.br/20553/).

Um estudo recente mostrou, no entanto, que mesmo um sistema quântico isolado, ou seja, sem correlações com outros sistemas, é suficiente para implementar um algoritmo quântico mais rápido do que o seu análogo clássico. Artigo descrevendo o estudo foi publicado no início de outubro deste ano na revista Scientific Reports, do grupo Nature: Computational speed-up with a single qudit.

O trabalho, ao mesmo tempo teórico e experimental, partiu de uma ideia apresentada pelo físico Mehmet Zafer Gedik, da Sabanci Üniversitesi, de Istambul, Turquia. E foi realizado mediante colaboração entre pesquisadores turcos e brasileiros. Felipe Fernandes Fanchini, da Faculdade de Ciências da Universidade Estadual Paulista (Unesp), no campus de Bauru, é um dos signatários do artigo. Sua participação no estudo se deu no âmbito do projeto Controle quântico em sistemas dissipativos, apoiado pela FAPESP.

“Este trabalho traz uma importante contribuição para o debate sobre qual é o recurso responsável pelo poder de processamento superior dos computadores quânticos”, disse Fanchini à Agência FAPESP.

“Partindo da ideia de Gedik, realizamos no Brasil um experimento, utilizando o sistema de ressonância magnética nuclear (RMN) da Universidade de São Paulo (USP) em São Carlos. Houve, então, a colaboração de pesquisadores de três universidades: Sabanci, Unesp e USP. E demonstramos que um circuito quântico dotado de um único sistema físico, com três ou mais níveis de energia, pode determinar a paridade de uma permutação numérica avaliando apenas uma vez a função. Isso é impensável em um protocolo clássico.”

Segundo Fanchini, o que Gedik propôs foi um algoritmo quântico muito simples que, basicamente, determina a paridade de uma sequência. O conceito de paridade é utilizado para informar se uma sequência está em determinada ordem ou não. Por exemplo, se tomarmos os algarismos 1, 2 e 3 e estabelecermos que a sequência 1- 2-3 está em ordem, as sequências 2-3-1 e 3-1-2, resultantes de permutações cíclicas dos algarismos, estarão na mesma ordem.

Isso é fácil de entender se imaginarmos os algarismos dispostos em uma circunferência. Dada a primeira sequência, basta girar uma vez em um sentido para obter a sequência seguinte, e girar mais uma vez para obter a outra. Porém, as sequências 1-3-2, 3-2-1 e 2-1-3 necessitam, para serem criadas, de permutações acíclicas. Então, se convencionarmos que as três primeiras sequências são “pares”, as outras três serão “ímpares”.

“Em termos clássicos, a observação de um único algarismo, ou seja uma única medida, não permite dizer se a sequência é par ou ímpar. Para isso, é preciso realizar ao menos duas observações. O que Gedik demonstrou foi que, em termos quânticos, uma única medida é suficiente para determinar a paridade. Por isso, o algoritmo quântico é mais rápido do que qualquer equivalente clássico. E esse algoritmo pode ser concretizado por meio de uma única partícula. O que significa que sua eficiência não depende de nenhum tipo de correlação quântica”, informou Fanchini.

O algoritmo em pauta não diz qual é a sequência. Mas informa se ela é par ou ímpar. Isso só é possível quando existem três ou mais níveis. Porque, havendo apenas dois níveis, algo do tipo 1-2 ou 2-1, não é possível definir uma sequência par ou ímpar. “Nos últimos tempos, a comunidade voltada para a computação quântica vem explorando um conceito-chave da teoria quântica, que é o conceito de ‘contextualidade’. Como a ‘contextualidade’ também só opera a partir de três ou mais níveis, suspeitamos que ela possa estar por trás da eficácia de nosso algoritmo”, acrescentou o pesquisador.

Conceito de contextulidade

“O conceito de ‘contextualidade’ pode ser melhor entendido comparando-se as ideias de mensuração da física clássica e da física quântica. Na física clássica, supõe-se que a mensuração nada mais faça do que desvelar características previamente possuídas pelo sistema que está sendo medido. Por exemplo, um determinado comprimento ou uma determinada massa. Já na física quântica, o resultado da mensuração não depende apenas da característica que está sendo medida, mas também de como foi organizada a mensuração, e de todas as mensurações anteriores. Ou seja, o resultado depende do contexto do experimento. E a ‘contextualidade’ é a grandeza que descreve esse contexto”, explicou Fanchini.

Na história da física, a “contextualidade” foi reconhecida como uma característica necessária da teoria quântica por meio do famoso Teorema de Bell. Segundo esse teorema, publicado em 1964 pelo físico irlandês John Stewart Bell (1928 – 1990), nenhuma teoria física baseada em variáveis locais pode reproduzir todas as predições da mecânica quântica. Em outras palavras, os fenômenos físicos não podem ser descritos em termos estritamente locais, uma vez que expressam a totalidade.

“É importante frisar que em outro artigo [Contextuality supplies the ‘magic’ for quantum computation] publicado na Nature em junho de 2014, aponta a contextualidade como a possível fonte do poder da computação quântica. Nosso estudo vai no mesmo sentido, apresentando um algoritmo concreto e mais eficiente do que qualquer um jamais imaginável nos moldes clássicos.”