The heatwave scorching western Europe is the most severe and widespread ever and is only possible due to the climate crisis driven by fossil fuel burning, scientists have said.
Almost half of Europe’s 850 largest cities are also enduring their worst ever heat stress, a combination of temperature and humidity, they found. Muggier conditions mean sweating is less effective at cooling the body, making heatwaves even more dangerous.
The analysis comes as the UK recorded its hottest ever June temperature on Thursday, 36.7C (98.06F) in Somerset, and much of western Europe recorded a sharp rise in medical emergencies, including some deaths.
In summer 2022, more than 60,000 people died due to heat in Europe. The statistical analysis needed to assess the impact of the current heatwave will take time to complete. Nonetheless, the heatwave is certain to exact a heavy toll and is also disrupting lives and livelihoods, with schools closed, hospitals struggling and rail and air journeys cancelled across the continent.
The new analysis by scientists from the World Weather Attribution (WWA) consortium shows how rapidly extreme heat is worsening as carbon pollution continues to pile up in the atmosphere. As recently as 2003, a heatwave like the current one in Europe would have been 2C cooler due to the lower level of global heating at the time. In 1976, another famous heatwave year, it would have been 3.5C cooler.
The sweltering night-time temperatures currently harming people’s sleep are about 100 times more likely today than in 2003. The scientists warned that without urgent climate action, future heat conditions would get even more extreme and the current summer could seem relatively cool in retrospect.
“This is the most severe and widespread heatwave to have ever affected this large a region of Europe,” said Dr Theodore Keeping, an extreme weather research associate at Imperial College London and part of the WWA team. “We found that in the last 50 years, during which time the planet has warmed by 1.1C, the chance of a heatwave like this has changed immensely. This event would not have been possible in June without climate change. But do we expect this to be a cool summer going forward? That’s absolutely the case.”
He said many capital cities were experiencing not only their hottest recorded three-day period in June but the hottest three-day period at any time of year. At least 100 million people in Europe were expected to face temperatures above 35C on Thursday.
The scientists used wet bulb globe temperatures to assess the additional impact of high humidity. “It accounts for the ability of the human body to cool itself down. With the worst conditions ever experienced in 45% of cities over 50,000 people, the health impacts of this heatwave are likely to be extremely high,” Keeping said. “The speed of change is startling.”
Commenting on the WWA analysis, Simon Stiell, the UN’s climate chief, said: “Climate change is running rampant, caused by the world’s addiction to burning coal, oil and gas. But the solutions are equally clear: a faster shift to clean energy – which is now much cheaper than fossil fuels – as well as protecting forests and building climate resilience.”
The WWA team used both observed and reliable forecast temperature data to analyse the hottest three-day period across a large area of western Europe, which is sitting under a “heat dome”. Using peer-reviewed methods, they found unequivocally that climate change was the driving force behind the severity of the heat.
They ruled out natural variability of the weather, in particular any influence from the El Niño event that has begun in the Pacific Ocean. The current weather pattern, a blocked high-pressure system trapping hot air over Europe and drawing warm air up from the Sahara, is not unusual in summer, the scientists said. Instead, the level of heat has been supercharged by global heating.
Carolina Pereira Marghidan, of the Red Cross Red Crescent Climate Centre, said: “After the devastating 2003 heatwave in Europe, many countries invested in early warning systems and action plans. Research shows that those have saved many lives, but it’s not enough.”
Heatwave Britain must do more to prepare for this scorching new normal (The Independent)
Editorial: As the UK swelters and June temperature records tumble, the government must redouble its investment in resilience policies that meet the future rather than ignore it
The “red alerts” issued by the Meteorological Office are rare, serious, and speak just as much to the climate crisis facing planet Earth as they do to the immediate risks to human health in Britain.
Perhaps it is the heat making the more vocal climate-change deniers dismiss the sweltering evidence before them, but against the backdrop of these record-breaking temperatures, their claims that “it’s just weather” appear in the worst of taste, and dangerous with it.
Temperatures approaching 40C in June are not normal. But they are increasingly frequent. So are extraordinarily wet winters. The reality of climate change from global warming, and the danger that it will accelerate into an unpredictable and catastrophic cycle by the middle of the century, should be treated with the urgency the moment demands.
In countries such as Britain, built on the perfectly natural presumption of a permanently temperate climate, there is an all too obvious need to increase resilience, from railway tracks to the foundations of buildings and flood defences.
A few years ago, this position was common ground. During his recent, almost valedictory appearance at Prime Minister’s Questions, Sir Keir Starmer bemoaned the loss of national purpose in restraining greenhouse gas emissions and pursuing the target of a net zero UK economy by 2050. After all, for all his fatal flaws, Boris Johnson accepted the science and the need for action at successive Cop summits, and it was Theresa May who put the net zero target into law.
Now Kemi Badenoch calls herself a “net zero sceptic” – rather too close to flat-Earthism for a serious politician. Still worse is the fracturing of the international consensus by an anti-science elite: Donald Trump’s inexplicable insistence that climate change is a “hoax” will be his true legacy to future generations.
Under the pressure of the cost of living crisis, strained public finances, and the frankly malign influence of the fossil-fuel lobby on British politics, the public and politicians alike have found more immediate, quotidian matters to fret about. This approach is perfectly understandable, but deeply flawed. Climate change, with its costly consequences for every nation and every human being, is an inconvenient truth, and an issue that should transcend all others.
In fact, humanity cannot afford to ignore the fact that renewable sources – alongside a role for nuclear power – can produce cheap, plentiful and clean energy. They will have to be adopted in any case, because fossil fuels are a finite resource, carry unacceptable geopolitical risks, and will so alter life on Earth as to render it almost unrecognisable, just as the weather is now. The drive to net zero is not a burden or an obstacle to higher standards of living, but the way to achieve hitherto unknown prosperity – especially if the voracious appetite for energy of the AI data centres can be satisfied without engendering irreversible climate change.
Paying for the massive investment in green power has always been the issue, but rarely is it set against the cost of doing nothing – crop failure, buildings collapsing from subsidence, increased incidence of earthquakes, hurricanes and floods, widespread disruption to transport and industry, and the flows of humans that will inevitably follow from the desertification of sub-Saharan Africa and water shortages across the equatorial regions.
What would the loss of pollinating insects and the rainforests do to our way of life? We know that it would not be cheap, or even possible, to fix.
Even if it is practically impossible to reverse climate change, we can still limit it. Some imaginative solutions will need to be found. How, for example, to discourage people from installing central heating systems – the wrong kind of resilience when powered in part by burning natural gas, thus creating a vicious cycle.
Could we reform school term times, which still revolve around the long-gone need to get the harvest in? Are there novel ways to bolster flood defences, both at the riverside and at the coast? Can we mandate the installation of new railway tracks that are less susceptible to buckling? What can the insurance sector do to help people affected by subsidence – especially as the UK has such an old housing stock? Must we shut motorways for hours after an accident, when people then have little access to water and shade?
The prime minister is right to have set up Cobra meetings to monitor the situation, but he, or more likely his successor, should also work on the ways in which we can protect lives – and the economy – from a hotter, damper future. And of course, the drive for net zero has to go on, because doing nothing cannot be an option.
“Esta é a onda de calor mais intensa e abrangente que já atingiu essa ampla região da Europa.” Theodore Keeping, pesquisador associado do Imperial College, deixa os números de lado ao explicar a jornalistas o que ocorre nesta semana na Europa. A mudança climática criou um evento virtualmente impossível há 50 anos.
Essas e outras conclusões constam de estudo publicado nesta sexta-feira (26) pelo WWA (World Weather Attribution), consórcio de cientistas liderados pela instituição londrina que verifica a responsabilidade da mudança climática em eventos extremos.
“Nos últimos 50 anos, o planeta aqueceu 1,1°C. Nesse período, a probabilidade de uma onda de calor como essa mudou imensamente. Esse evento não teria sido possível [na Europa] em um mês de junho sem as mudanças climáticas”, diz Keeping. “As temperaturas noturnas registradas não teriam sido possíveis em nenhuma época do ano sem as mudanças climáticas”, reitera.
Parisienses nadam no canal de Saint-Martin, em Paris, na noite de quinta-feira (25); a liberação de banho no local foi antecipada em razão da onda de calor recorde que assola a Europa nesta semana – Ludovic Marin/AFP
A responsabilidade pela crise do clima, mostra a ciência, reside sobretudo na queima de carvão, petróleo e gás. Ou, como diz Simon Stiell, chefe do clima na ONU, no “vício mundial” pela energia suja, mais cara do que as alternativas renováveis.
A probabilidade de que temperaturas máximas diárias como as desta semana ocorram durante três dias seguidos em qualquer época do ano aumentou mais de 500 vezes, calcula o estudo.
Na quinta-feira (25), a França registrou pelo terceiro dia consecutivo seu dia mais quente da história; a Météo-France informou que também a noite francesa foi a mais quente já registrada.
Duas estações nucleares foram desligadas no país devido ao aquecimento excessivo da água de rio utilizada para refrigerar os reatores.
As chamadas noites tropicais, quase uma rotina desde o fim de semana no Reino Unido, Espanha e na própria França, já alcançam Alemanha, Áustria e Itália. Quando os termômetros se mantêm acima dos 20°C no período noturno, o resfriamento do solo não ocorre e projeta um dia ainda mais quente na manhã seguinte.
A condição climática é considerada grave pela OMM (Organização Mundial de Meteorologia) por impedir a recuperação do corpo humano após um dia de esforço combatendo o calor. Provoca fadiga e doenças relacionadas ao calor, especialmente em crianças, idosos e portadores de comorbidades.
Apenas 20% das edificações na Europa têm ar condicionado. No Reino Unido, o número está perto de 5%. “Muitas residências, escolas e sistemas de transporte, bem como outras infraestruturas essenciais, foram projetadas para um clima mais frio, especialmente no noroeste do continente”, afirma Carolina Pereira Marghidan, do Centro de Clima da Cruz Vermelha Crescente Vermelho, que também participa do estudo do WWA.
A situação é diferente de 2003, quando uma onda de calor histórica matou mais de 70 mil pessoas no continente, grande parte idosos. “Muitos países investiram em sistemas de alerta precoce e planos de ação. Pesquisas mostram que essas medidas salvaram muitas vidas nas últimas décadas. A conscientização também cresceu muito, tudo isso é importante, mas não suficiente”, diz a pesquisadora.
Em entrevista ao jornal Le Monde, o prefeito de Paris, Emmanuel Grégoire, usou as escolas da cidade como exemplo para o tamanho da tarefa: com apenas 200 de 600 prédios adaptados ao calor, mesmo que existisse dinheiro para reformar tudo não haveria prestadores de serviço suficientes para terminar a tarefa em poucos anos.
“Para nos adaptarmos, precisamos mudar o ritmo de nossas vidas.”
Segundo o estudo do WWA, 45% de 854 cidades analisadas em 30 países europeus já bateram ou devem bater em junho marcas históricas de Índice de Bulbo Úmido Termômetro de Globo. O IBUTG, amplamente divulgado pela sigla em inglês (WBGT), é uma medida do estresse térmico e da capacidade do corpo de se resfriar por meio da evaporação do suor.
A combinação de calor intenso e umidade é perigosa, dizem os especialistas. Quando o corpo sua, o intuito é resfriá-lo. Com a umidade, o mecanismo perde eficácia.
A análise também compara o planeta atual, com 1,4°C de aquecimento global em comparação aos níveis pré-industriais, com aquele que testemunhou ondas de calor marcantes não apenas em 2003, como também em 1976.
Há 50 anos, um evento como o atual seria 3,5°C mais frio; há 23 anos, a ocorrência de noites tropicais como a desta semana seriam 100 vezes menos prováveis. E não dá para colocar a culpa no El Niño, condição climática que exacerba a ocorrência de secas e de chuvas extremas. O estudo afasta essa possibilidade.
“Sim, é a mudança climática; sim, a culpa é nossa; não, não é o El Niño. Sim, temos as soluções; não, não estamos colocando-as em prática com a rapidez necessária”, resume Friederike Otto, professora de Ciência do Clima do Imperial College.
“A questão é realmente que tipo de futuro queremos.”
A chegada do El Niño já faz as seguradoras calcularem os impactos do fenômeno e se prepararem para um pico de indenizações. O setor residencial espera aumento de prejuízos ligados a chuvas, enquanto a seca deve elevar os acionamentos de apólices rurais.
O El Niño é o aquecimento das águas do oceano Pacífico, que altera o clima do planeta. A Administração Nacional Oceânica e Atmosférica dos Estados Unidos confirmou o início do fenômeno no dia 11, com previsão de 63% de alcançar um nível muito forte de novembro a janeiro. A alta nas temperaturas globais tende a ampliar seus efeitos.
“Tudo indica que os maiores impactos nas carteiras de seguro residencial e patrimonial, como empresas e condomínios, serão na primavera, principalmente a partir de setembro e outubro”, diz Jarbas Medeiros, presidente da comissão de riscos patrimoniais massificados da FenSeg (Federação Nacional de Seguros Gerais).
Carros no pátio do Detran de Porto Alegre cobertos pelas águas da inundação do lago Guaíba – Bruno Santos – 19.mai.24/Folhapress
O cálculo do prejuízo depende das características de cada seguradora e da preparação das cidades atingidas, mas há clareza no setor residencial de que os maiores danos serão no Sul, onde chuvas fortes podem se tornar mais frequentes. No Norte e Centro-Oeste, o El Niño deve trazer mais seca e aumentar o risco de quebras de safra no agronegócio.
“Sabemos que podem acontecer eventos mais catastróficos em algumas regiões, e as seguradoras já começam a acompanhar isso muito de perto e a preparar suas estruturas, porque montamos uma força-tarefa para atendimento aos clientes em eventos extremos”, afirma Medeiros.
A última estimativa da FenSeg, de 2021, indicou que menos de 1% das residências do país tinha cobertura contra danos causados por alagamentos. Dados mais recentes das seguradoras apontam que a procura pela proteção aumentou, principalmente após o desastre no Rio Grande do Sul em 2024, mas os números ainda são baixos.
Sain’t Clair Lima, diretor de produtos da Bradesco Seguros, diz que de 4% a 6% das apólices residenciais da empresa cobrem inundações. A situação varia conforme a região: no Sul, a cobertura é de 6% a 7%.
“Se as previsões se confirmarem, deve ter aumento de pelo menos dois dígitos em relação à frequência de sinistros”, afirma Lima. Os sinistros são as ocasiões em que clientes sofrem danos e precisam acionar a seguradora para receber indenização.
Medeiros, que também atua como diretor de ramos elementares e vida na Porto Seguro, afirma que somente 3% das apólices residenciais da empresa incluem inundações. A cobertura alcança 50% para vendavais e 80% para danos elétricos devido a cortes de energia.
Segundo ele, dez seguradoras oferecem a proteção para alagamentos atualmente no Brasil, contra apenas três na época do desastre gaúcho.
“Embora essa seja uma cobertura bastante desafiadora do ponto de vista de subscrição e precificação, o mercado trabalha para ampliar a oferta, para que o cliente encontre nas seguradoras uma possibilidade de se proteger contra os eventos extremos”, diz.
Sinistros em condomínios e empresas também devem aumentar, e Medeiros afirma que a proteção contra alagamento nessas categorias não passa de 5% das carteiras.
De acordo com o diretor, 29% da receita com seguros residenciais da Porto Seguro vêm de coberturas de eventos climáticos, incluindo alagamento, vendaval e dano elétrico. Porém, 48% do valor pago em indenizações se deve a essas ocorrências, taxa superior ao montante indenizado por furtos ou roubos.
“Claramente são coberturas que trazem risco para a companhia, porque a proporção entre indenização e pagamento é maior”, afirma. “As pessoas têm medo de ser roubadas, de sair de férias e, quando voltar, ver que a casa foi arrombada. Mas, muitas vezes, não passa na cabeça que o que mais causa prejuízo é o evento climático”.
Adilson Lavrador, diretor-executivo de operações, sinistros e tecnologia da Tokio Marine, diz que a companhia acompanha as informações sobre o El Niño e que fenômenos climáticos podem impactar praticamente todo o ecossistema de seguros.
“Em cenários de enchentes severas, chuvas intensas e vendavais, os ramos de seguros patrimoniais, de automóvel e agrícola tendem a registrar elevação nas ocorrências”, afirma. “Em situações extremas, também impactam o seguro de vida”.
No agronegócio, os números mostram uma queda no valor pago pelos clientes às seguradoras. Daniel Nascimento, presidente da comissão de seguro rural da FenSeg, afirma que houve uma retração de 7% no valor do prêmio no primeiro trimestre de 2026, em relação ao mesmo período de 2025.
O setor também registra redução na área de lavouras protegidas: 3,2 milhões de hectares estavam segurados em 2025, menos da metade dos 7,1 milhões de hectares do ano anterior.
“As seguradoras vêm acompanhando de perto o El Niño e fazem um planejamento de vendas para não expor muito seu capital”, diz. “Nosso maior desafio é que o produtor não espere o próximo evento impactar a sua região [para contratar a proteção]”.
Lima, da Bradesco Seguros, afirma que os prejuízos do agro com eventuais perdas de safra não poderão ser totalmente compensados: “Por mais que o seguro consiga recompor de alguma forma a perda financeira, há uma preocupação com todo o ecossistema, principalmente o financeiro, porque vai faltar alimento no mercado e gerar inflação”.
It’s been hot in London this week. Really hot. A dangerous heat wave has hit Western Europe. Yesterday, the UK recorded its highest ever June temperature at 36.1 °C (about 97 °F). But as the weather app on my phone confirmed, it felt like 39 °C.
It’s frightening that we are seeing such temperatures in the UK in June. According to the Met Office, the country’s national weather and climate service, June temperatures peaked at an average 19 °C (66 °F) in England between 1991 and 2020. Across Europe, the heat wave is likely to cause thousands of deaths. There will be other awful consequences for agriculture, infrastructure, and the health system.
But this week I want to look at what the heat does to our minds and brains. Personally, I’ve found it almost impossible to think straight. The heat is distracting and my mind is foggy. I dread to think about the conditions of people who work outdoors, in even hotter regions.
It’s not just exhaustion and confusion. The effects of heat on the brain can be deadly. And researchers are still trying to figure out why.
Studies have confirmed that as temperatures rise, people seem to get more irritable and more violent. Most of these studies are based on associations, though. It’s difficult to directly study how a heat wave might affect our thinking, says Catherine Thompson, a cognitive psychologist at Liverpool Hope University.
She has been studying the effects of extreme heat on firefighters instead. It’s easier to measure people’s cognitive skills before and after they undergo scheduled training that involves entering a burning building.
It’s early days, but the team found that firefighters found it harder to focus and control their attention immediately after heat exposure—something people in heat waves can empathize with, I’m sure.
The firefighters’ skills returned to normal after 20 minutes or so of cooling down. But they’d experienced just 15 minutes of intense heat exposure. Thompson doesn’t know what the effects of living through a days-long heat wave might be—or how long they’ll last. Figuring that out might involve shipping cognitive test kits to thousands of people during the few days’ notice of an impending heat wave. “My guess [is] that no one’s done it because it’s just so difficult to do,” says Thompson.
Still, researchers can learn about some of the impacts of heat waves through studies after the fact. And those studies suggest that the heat seems to have more disastrous outcomes for people with mental-health disorders.
Those outcomes become apparent when temperatures rise above what is considered typical for a given region. “There seems to be a correlation where the hotter it gets, especially during the hottest times of the year, the worse the mental-health outcomes,” says Joshua Wortzel, who directs the Heat-Mind Lab at Hartford HealthCare in Connecticut.
In a study published in 2023, Emma Lawrence at the University of Oxford, who studies the effect of climate change on mental health, and her colleagues reviewed the evidence linking mental-health outcomes to ambient outdoor temperatures. They found that during heat waves, there was a 9.7% increase in the rate of hospital admissions for people with such conditions.
“People who live with mental-health conditions are among the most susceptible to the physical impacts of heat,” says Lawrence. People with schizophrenia were found to have been three times more likely to die during the record-breaking heat wave that affected Canada in 2021, for example.
In order to protect people, we need a better understanding of the mechanisms underlying these effects. After all, a lot of things change when it’s very, very hot. Some people may end up stuck indoors, avoiding outdoor play and exercise, and it can be difficult to get a good night of sleep, for example. Sleep, socializing, and exercise are all really important for our mental health.
But whether unusual heat does something specific to our brains is, as Wortzel puts it, “the million-dollar question.”
Research in lab animals suggests that excessive heat can alter the way chemical signals work in our brain. The levels of neurotransmitters like serotonin, for example, seem to increase when rats and mice are exposed to high temperatures, according to multiple studies. The heat may also interfere with the way networks in our brains communicate with each other. It might affect the way oxygen reaches our brain cells.
“There are so many biological reasons why brains may be negatively affected by heat,” says Wortzel.
Emerging research suggests that for whatever reason, children and young people are among the most vulnerable. In research published earlier this week, Wortzel and his colleagues saw a 2.97% increase in the suicide rate among people in the US aged 15 to 24 for every 1 °C increase in average monthly temperature. That’s more than double the increase seen in people over the age of 24 (which is concerning in its own right).
Other work hints that heat exposure might have long-term consequences for children’s brain development. Babies who were exposed to either extreme heat or cold appeared to have altered white matter by the time they were nine to 12 years old—although it’s not clear how these impacts might affect an individual child.
“It seems that extreme temperature exposure for very young children may affect their brain development,” says Lawrence, who spoke to me from Oxford. She was meant to be in London for Climate Action Week, but her event, which focused on extreme heat, ended up being canceled … owing to the extreme heat.
We are living through the effects of climate change. And that brings a new urgency to the question of how heat affects our brains. Children born in 2020 are predicted to experience around seven times the number of heat waves their grandparents did, says Lawrance. “[We] need to be serious about adapting to a warming world.”
A Noaa (Administração Nacional Oceânica e Atmosférica) dos Estados Unidos confirmou, nesta quinta-feira (11), o início do El Niño.
O fenômeno climático deve se desenvolver para um nível moderado ou forte durante o outono no hemisfério norte (que vai de setembro a dezembro; primavera no sul), segundo a agência americana. Foi estimada em 63% a chance de um El Niño muito forte de novembro a janeiro —a possibilidade apresentada no mês passado era de 37%—, de acordo com a Noaa, com possibilidade de figurar entre os recordes do fenômeno desde o início dos registros, em 1950.
Apesar de o El Niño ter o poder de influenciar eventos climáticos extremos, cada ano do fenômeno é diferente. Por isso, segundo a Noaa, um El Niño considerado muito forte não necessariamente resultará em eventos climáticos maiores e mais impactos. Mas essa classificação aumenta as chances desses tipos de acontecimento.
Pés enlameados de pessoa após caminhada pelo leito seco de um lago na comunidade quilombola Saracura, na área de várzea do rio Amazonas, próxima a Santarém, no Pará – Lalo de Almeida – 22.nov.24/Folhapress
O ano de 2024 foi também o mais quente registrado no mundo desde o século 19. Dado que o fenômeno meteorológico impacta nas temperaturas, já se especula a possibilidade de um novo recorde de calor se avizinhando.
Um El Niño muito forte significa um aquecimento igual ou maior a 2°C, comparado à média histórica, das águas superficiais do oceano Pacífico em uma região próxima à linha do Equador (veja mais abaixo).
As demais classificações de intensidade do fenômeno seguem a mesma lógica da temperatura da água, variando, em linhas gerais, a cada 0,5°C.
Dessa forma, um El Niño forte representa um aquecimento de 1,5°C a 2°C acima do nível normal; um moderado, de 1°C a 1,5°C; um fraco de 0,5°C a 1°C; e um neutro de -0,5°C a 0,5°C.
Para o meteorologista Márcio Cataldi, professor do departamento de Engenharia Agrícola e Meio Ambiente da Universidade Federal Fluminense (UFF), “as previsões indicam que esse pode ser um El Niño muito forte, mais forte do que o que a gente tem registrado até hoje”. Ele lembra, porém, que só há registros confiáveis de El Niño a partir da década de 1980, quando satélites passaram a contribuir com a coleta de dados.
O climatologista Francisco Eliseu Aquino, professor do Departamento de Geografia da Universidade Federal do Rio Grande do Sul (UFRGS), disse que o apelido super El Niño, que passou a ser usado para se referir ao evento agora em curso, destaca a intensidade do fenômeno em comparação aos demais, mas não é um termo técnico.
O que é o El Niño
O El Niño é um acontecimento natural e é caracterizado pelo aquecimento, acima da média, da superfície do oceano Pacífico, perto da linha do Equador. Vale lembrar que, apesar da sua ocorrência histórica, esse fenômeno agora ocorre em um mundo alterado pela crise climática, o que muda jogo, podendo amplificar impactos —e levando, inclusive, a uma alteração na medição do El Niño.
O fenômeno tem relação com os ventos alísios, que usualmente empurram águas quentes em direção à Ásia. Em alguns anos anos, porém, que tais ventos se enfraquecem, segundo a Noaa. Esses são os anos de El Niño.
Há ainda um outro fenômeno associado, a La Niña. Ainda segundo a agência americana, esse segundo acontecimento se dá quando os alísios se tornam mais intensos do que o normal. O fenômeno se caracteriza, com isso, pela superfície da água mais fria do que a média histórica.
O El Niño costuma durar entre 9 e 12 meses, segundo a Organização Meteorológica Mundial (OMM). Em geral, começa no final do inverno do hemisfério Sul e atinge o pico entre novembro e janeiro. O fenômeno começa a desaparecer a partir do primeiro mês do ano.
Como afeta o Brasil
Segundo nota técnica do Inpe (Instituto Nacional de Pesquisas Espaciais), o El Niño deste ano pode reduzir o volume de chuvas na amazônia. Isso levaria a um aumento no risco de fogo no bioma.
Por esse motivo, o ministro Flávio Dino, do STF (Supremo Tribunal Federal), chegou a determinar que a União e os estados parte da amazônia e do pantanal apresentassem planejamento e os preparativos frente ao aumento do risco de incêndios florestais.
Enquanto o Norte e Nordeste usualmente ficam com menos chuvas, anos de El Niño costumam ter maior volume de precipitação no Sul do Brasil.
A região Centro-Oeste costuma ter temperaturas mais elevadas, aumentando também o risco de fogo.
Já no Sudeste, anos de El Niño costumam registrar aumento da temperatura média, especialmente na primavera e verão, mais chuvas no sudeste de São Paulo, centro-sul do Rio de Janeiro e de Minas Gerais e redução de precipitação em áreas mais ao norte. Também podem ocorrer secas na região, o que varia de acordo com a intensidade do fenômeno.
Como afeta outras partes do mundo
O El Niño provavelmente terá um impacto negativo na produção agrícola no Sudeste Asiático e na Índia, onde o fenômeno é tipicamente associado a chuvas abaixo da média, segundo Kyle Tapley, executivo de vendas empresariais do WeatherDesk da Vaisala Xweather.
As monções fornecem quase 70% das chuvas na Índia e são vitais para o setor agrícola, que representa cerca de 18% da economia de quase US$ 4 trilhões. Chuvas abaixo da média podem significar colheitas menores de culturas como arroz, algodão e soja, além de afetar as safras de inverno.
Enquanto isso, os produtores de arroz da Indonésia estão correndo para antecipar o calendário habitual de plantio enquanto enfrentam a ameaça de um longo período de seca neste ano. O ministro da Economia da Malásia alertou que o El Niño pode causar uma queda média de 8% a 10% na produção agrícola.
“O El Niño normalmente leva a uma temporada de furacões menos ativa nos EUA, e esperamos uma temporada de furacões no Atlântico abaixo da média neste ano. No entanto, é importante lembrar que um furacão forte ainda é possível mesmo em uma temporada menos ativa”, disse Tapley.
A temporada de furacões nos EUA começou em 1º de junho e vai até 30 de novembro.
Com a chegada do El Niño, anunciada nesta quinta-feira (11) pela Noaa (Administração Oceânica e Atmosférica Nacional), as cidades precisarão ter mais bem definidos os planos de preparação para enfrentar o fenômeno climático.
Bairro da cidade de Cruzeiro do Sul foi devastado pelas enchentes que atingiram o Rio Grande do Sul em 2024; El Niño deve aumentar recorrência de temporais na região sul – Folhapress/Anselmo Cunha – 4.jun.2024
Mas, e as autoridades que não obedeceram Dino, que medidas podem tomar agora que o fenômeno começou?
Mesmo diante de um planeta cada vez mais instável, eventos passados e modelos climáticos são os melhores mapas para definir as estratégias para enfrentar este El Niño. O fenômeno, provocado pelo aquecimento do Pacífico Equatorial, tende a gerar chuvas acima da média na região Sul, enquanto Norte e Nordeste normalmente sofrem com secas mais intensas.
“O Pacífico corresponde a metade da Terra em longitude. É muita água. Quando essa água se move e muda de lugar, ela cutuca a atmosfera e gera ondas atmosféricas”, diz a oceanóloga Regina Rodrigues, pesquisadora da UFSC (Universidade Federal de Santa Catarina).
“No Brasil, o que geralmente acontece é que essas ondas criam o que chamamos de bloqueio atmosférico —uma alta pressão que fica sobre o Sudeste. As frentes frias chegam e não conseguem passar. Então, fica chovendo no mesmo lugar”, explica.
Planos de contingenciamento
Rodrigues acrescenta que saber onde, exatamente, essas chuvas vão acontecer, se no Rio Grande do Sul ou em Santa Catarina, por exemplo, é mais difícil de prever no longo prazo. Mas as simulações climáticas usadas atualmente já conseguem fazer a previsão no médio prazo, com 10 a 15 dias de antecedência.
“Se os estados e cidades estivessem preparados, bastaria acionar os planos de contingência para atuar. Evitar tudo não é possível, mas há uma série de medidas que podem aliviar os impactos”, diz a cientista, acrescentando que essas ações de adaptação precisam ser locais.
Planos de contingência incluem, por exemplo, saber quais lugares correm risco de deslizamento de terra e comunicar a população sobre o que fazer quando começar a chover.
O meteorologista Marcelo Seluchi, coordenador-geral de Operações e Modelagem do Cemaden (Centro Nacional de Monitoramento e Alertas de Desastres Naturais), afirma que as cidades precisam detalhar elementos como a rota de fuga e a definição prévia de espaços que servirão como abrigos na hora da emergência.
“E o ideal é que tudo isso seja treinado, simulado. É difícil fazer um plano de contingência para uma cidade como Porto Alegre? É muito difícil, mas tem que ser feito”, adverte o pesquisador.
Ele conta que cidades como Valparaíso, que precisa se preparar para a ocorrência de tsunamis, faz simulados regularmente com toda a população, de mais de 300 mil habitantes.
Seluchi ressalta, ainda, a importância da conscientização da população em seguir as orientações das autoridades.
“Quando a Defesa Civil chega, a pessoa fala: ‘Ah, moro aqui há 40 anos e aqui não acontece nada. O rio nunca chegou até aqui’. Até que o rio chega e as pessoas morrem afogadas. Isso é terrível. É preciso conscientizar as pessoas com certo cuidado, sem gerar pânico, mas indicando o que deve ser feito”, diz.
O mesmo vale para alertas de condições extremas que são enviadas por mensagem de texto, como é o caso da prefeitura de São Paulo. “Não adianta você ter um celular tocando se você não sabe o que tem que fazer”, afirma o meteorologista.
Estrutura física e burocrática
Além das tempestades, o El Niño também tende a aumentar a ocorrência de ondas de calor e secas, o que pode levar a problemas de saúde e incêndios florestais.
“É possível que nos meses de agosto a outubro tenhamos muitas ondas de calor, com temperaturas muito elevadas e umidade muito baixa. É necessário ter um protocolo, incluindo suspender algumas atividades, como aquelas ao ar livre”, opina Seluchi.
Entre as estratégias para evitar que as pessoas se exponham às altas temperaturas estão a definição de locais públicos para resfriamento: estabelecimentos com ar-condicionado e água à disposição da população.
No caso dos incêndios florestais, o governo federal vem fazendo há meses uma mobilização com os entes subnacionais para estruturação de brigadas e outras providências, como fazer aceiros para evitar que as chamas se espalhem.
Além disso, é possível reforçar campanhas de comunicação para que não sejam feitas fogueiras ou queimadas durante a seca e endurecer a fiscalização de crimes ambientais.
Rodrigues afirma, ainda, que algumas medidas burocráticas podem ser uma boa carta na manga para as prefeituras e governos estaduais. “A Defesa Civil de Santa Catarina, por exemplo, já tem contratos pré-licitados com empresas para casos de emergência, estrutura de liderança comunitária e contingenciamento pronto para ser acionado.”
Em caso de previsão de chuvas fortes, uma atitude simples é limpar os sistemas de drenagem das cidades, ajudando a prevenir inundações.
“Não é muito dinheiro se você pensar nos impactos”, diz a pesquisadora da UFSC. “Estudos mostram que cinco anos depois de um evento climático extremo o impacto econômico ainda é sentido. Vamos sentir até 2029 os impactos do El Niño de 2023/24 —mas já temos outro. A prevenção é muito mais barata.”
De 6 a 8 de agosto, aconteceram três lives muito esclarecedoras sobre o que está por trás do antes e depois dos desastres que fomos submetidos no Rio Grande do Sul. Como ainda estamos vivendo o rescaldo de tanta destruição, creio ser muito útil este texto e outros que seguirão nas próximas semanas. Espero que sirva para compreendermos melhor o que estamos atravessando. Se você já se deu conta que precisa acompanhar o que está acontecendo nessa fase de agravamento do aquecimento global, pois isso afeta diretamente o seu cotidiano, inclusive seus planos, o que vou trazer nas próximas linhas será esclarecedor.
Um grupo de jornalistas mulheres, que compõe o Grupo de Trabalho de Comunicação da Rede de Emergência Climática e Ambiental (Reca), organizou em parceria da Federação Nacional de Jornalista (Fenaj) três lives intituladas “Diálogos entre jornalistas e especialistas acerca do desastre”. Dá para acompanhar a gravação no YouTube da Fenaj.
Esses encontros trouxeram muitas coisas que a mídia convencional e as redes sociais não abordaram.
Já parou para pensar o que o jornalismo faz com a ocorrência de desastres e o que os desastres fazem com o jornalismo? Essa foi a indagação da professora Marcia Franz Amaral, da UFSM, na abertura do encontro. Diante do que passamos, com tanta falta de orientação sobre o que fazer, tanto desespero, como deve ser a comunicação com população, com os atingidos, com a imprensa das autoridades e dos detentores de informações técnicas?
Tenho feito a cobertura de desastres, fui diretamente afetada por essa última enchente e venho trabalhando em projetos para despertar o interesse de diferentes públicos sobre as mudanças climáticas. Esse contexto complexo me fez voltar à universidade. Estou fazendo mestrado em comunicação, justamente para pesquisar, desvelar contextos e com aspiração de contribuir para que saibamos encarar com mais assertividade esse momento que exige adaptação e mitigação às mudanças climáticas.
Fui uma das painelistas da primeira live. Foi um mega desafio, pois estava quase sem voz. Peguei uma virose, uma pereba que tem deixado muita gente doente em Porto Alegre e Região Metropolitana. Escrevo isso só para explicar o meu desempenho, se você for me ouvir na live. Eu avalio que também é uma consequência da remexida geral da cidade, na qual o ambiente foi submetido.
E sabem por que fui uma das convidadas a falar? Porque fiz reportagens mostrando contextos em que outros colegas jornalistas não se debruçaram. Fiquei muito tocada com a declaração do Roberto Villar Belmonte, professor da Uniritter, que escreveu em um grupo sobre minha atuação.
“Depois da enchente de 2023, apenas a repórter freelancer Sílvia Marcuzzo fez reportagens de fôlego apontando a falta de governança ambiental (proposital) no RS. A imprensa regional dita hegemônica continua fingindo que o tema não existe, mesmo após maio de 2024. Seria legal citar isso na tua fala, Sílvia, na tua abordagem contínua da pauta, não apenas durante a desgraça (quando a morte é o principal valor notícia)”.
Ele escreveu isso também para justificar a minha participação na programação do 8º Congresso Brasileiro de Jornalismo Ambiental, que esse ano será em Fortaleza. Confere a programação do CBJA, será híbrida, online e presencial.
A primeira live, realizada em 6 de agosto, trouxe a chamada: os alertas foram emitidos. E agora?
Reinaldo Estelles, coordenador-geral do Departamento de Articulação e Gestão, da Secretaria Nacional de Proteção e Defesa Civil do Ministério da Integração e Desenvolvimento Regional, foi categórico: “Não adianta emitir alarmes se a população não souber o que é para fazer”. Esse é um dos pontos nevrálgicos, não basta uma sirene tocar, os bombeiros chamarem. A população precisa compreender o que significa estar em perigo. Creio que quem teve a experiência dos episódios dos meses de maio e junho no Rio Grande do Sul sabe muito bem o que isso quer dizer. Fomos vítimas de uma sequência de trapalhadas, de falta de gestão dos poderes públicos municipais e estadual.
Há muitas dimensões diferentes de informação, que estão intimamente ligadas a vários fatores. Ou seja, mais uma vez ficou supernítido o quanto o Estado que se gaba de “ter façanhas que sirvam de modelo a toda terra” se equivocou em insistir em determinados erros. Há muitas questões por trás das medidas dos tomadores de decisão que precisam ser esclarecidas.
Na live, Estelles anunciou o lançamento do projeto-piloto de um novo sistema de alerta, que aciona todos os celulares de uma região em risco. E reforçou: as Defesas Civis dos municípios e do Estado precisam se capacitar. Outros desastres virão. Ele salientou o quanto as Defesas Civis precisam promover a criação e a mobilização de núcleos comunitários. A participação de vários segmentos, principalmente com a atuação de lideranças locais, são essenciais para a estruturação de planos de contingência. Por favor, se você que me lê souber de algum lugar no Rio Grande do Sul onde isso esteja acontecendo, me conte.
Vagner Anabor, professor de Meteorologia da UFSM, lembrou que o Estado está em uma das regiões de maior incidência de tempestades severas. E na sua opinião, o que vivemos esse ano foi o maior desastre já ocorrido no Brasil. Outra curiosidade apontada por ele é que uns 25% da força de trabalho da Metereologia do País é composta por profissionais formados no RS. Ou seja, o Estado exporta gente qualificada, mas não dispõe de servidores que atuem no próprio território onde nasceram.
Ele defende o fortalecimento de medidas de prevenção. E lamenta que o Climatempo, do governo do Estado, conte apenas com dois metereologistas e um engenheiro hidrólogo. Anabor estima que seria necessária uma equipe entre 20 e 25 pessoas para dar conta de uma área do tamanho do RS.
Outro ponto importante colocado por Anabor é que “a cadeia da informação é muito longa”. E, por questão de minutos, muitas vidas podem ser salvas. Isso quer dizer que, desde o momento em que se sabe o que vem pela frente, até informar e mobilizar diferentes equipes, transmitir alerta e comunicar às comunidades sobre os riscos que eles correm, há muitas etapas a serem cumpridas até o momento de chegar em regiões que serão atingidas. Há diferentes atores envolvidos.
No caso do RS e de Porto Alegre, então, ocorreram muitas situações que deixaram evidente o quanto isso foi prejudicial. E a preparação para lidar com situações de perigo iminente requer planejamento e a execução de um bom plano de contingência (o que também não tivemos por aqui).
Os painelistas salientaram o quanto a imprensa desempenha função crucial para ampliar a percepção de risco da população. Quem cobre precisa saber o que significa uma chuva de 100 milímetros. E para complicar ainda mais o contexto, tem proliferado o número de influencers, gente que só porque sabe falar diante da câmera fica espalhando informações que muitas vezes mais atrapalham do que ajudam. Isso sem falar nas fake news.
Resumindo: enquanto as respectivas autoridades não adotarem condutas responsivas, que assumam o processo de uma comunicação para o bem comum, para salvar vidas, para evitar o pior, teremos que conviver com a insegurança, de procurar entender o que fazer diante de uma situação de risco.
O repórter Luciano Velleda, do Sul21, destacou que diversas vezes a imprensa precisou esperar anúncios da Defesa Civil porque seriam dados pelo governador e pelo prefeito de Porto Alegre em coletivas. Ou seja, assim que chega até a autoridade uma determinada informação, ela é avaliada se é o governador ou o prefeito que serão os porta-vozes. Vale lembrar da vez em que o prefeito sugeriu que os porto-alegrenses deixassem a cidade, fossem para a praia.
Em outros países, onde a comunicação de risco faz parte da cultura e funciona, como o Japão, a cadeia (o caminho que a informação percorre) é curta. Todos são treinados para saber o que fazer em caso de perigo. A autoridade máxima é técnica. Uma série de medidas, como a emissão de alerta em todos os canais de rádio e televisão, são acionadas em caso de risco.
Na próxima semana, trarei mais sobre esse assunto. Porque já está na cara que precisamos avançar nas medidas de prevenção a desastres. Esse assunto não pode e não deve ficar restrito a decisões políticas. A sociedade precisa se apropriar das diversas camadas de conhecimento para evitar danos de toda ordem. Ainda mais em ano de eleição!
Com a palavra, os professores das escolas atingidas pelas enchentes.
Para encerrar, sugiro que vejam a liveInundações no RS e a situação das escolas na RME/POA, realizada no dia 12, onde professores da rede municipal de ensino da Capital contam o que passaram e o que está sendo feito nas escolas atingidas pela enchente. A iniciativa é do projeto de extensão Fazeres Pedagógicos da Faculdade de Educação da UFRGS.
Foto da Capa: Freepik / Gerada por IAMais textos de Sílvia Marcuzzo: Clique aqui.
Sílvia Marcuzzo é jornalista, artivista, mestranda na Famecos/PUCRS e integrante do Grupo de Pesquisa sobre Comunicação, Crise e Cuidado. Articuladora de coletivos, repórter freelancer e editora de publicações socioambientais. Trabalha com comunicação e meio ambiente desde 1993. É consultora e assessora de organizações que atuam pelo bem da coletividade, por um mundo mais sustentável e com qualidade de vida para todos. Saiba mais em silviamarcuzzo.com.br
Seguindo a sequência que comecei a semana passada (clique aqui para ler), hoje abordo o que rolou na live “Diálogos entre jornalistas e especialistas acerca do desastre”, realizada dia 7 de agosto, que pode ser acessada no YouTube da Federação Nacional dos Jornalistas (Fenaj). É o segundo dos três encontros promovidos pelo Grupo de Trabalho de Comunicação da Rede de Emergência Climática e Ambiental (Reca).
Com o tema “O desastre eclodiu. Quais são os protocolos?” Com essa pergunta, a mediadora Débora Gallas, do Grupo de Pesquisa de Jornalismo Ambiental e RECA, conduziu o encontro online que teve a participação de Irineu de Brito Junior, especialista em gestão de desastres da Unesp, Armin Braun, diretor do Centro Nacional de Gerenciamento de Riscos e Desastres (Cenad), e dos jornalistas Maria Teresa Cruz e Paulo Mueller.
Um dos pontos que foi unanimidade entre os debatedores foi a necessidade de se cumprir protocolos. O grande X da questão é que, por aqui, pelos pagos, pela Capital gaúcha, o protocolo é algo nebuloso. Digamos que o protocolo aqui durante a enchente era a Defesa Civil avisar pelos seus canais, incluindo o grupo de WhatsApp, o Instagram e o site oficial, que uma tempestade intensa estava vindo. O governador e o prefeito eram os porta-vozes das informações importantes também.
Armin Braun ressaltou a importância dos jornalistas de veículos para dar a noção sobre a percepção da previsão do tempo. Ele explicou que o Cenad trabalha na preparação e na resposta aos desastres. O foco é justamente articular e capacitar os estados e municípios para encarar os riscos hidrológicos, geológicos, meteorológicos. Há vários órgãos públicos envolvidos nessa rede.
Já o professor Irineu destacou o quanto precisa ser feito um planejamento prévio para que se tenha condições de gerenciar o problema provocado por um desastre. Ele citou variáveis que envolvem a logística para o atendimento às demandas. Tudo isso precisa ser pensado em tempo de calma, antes de uma temporada de tempestades, por exemplo.
E a resposta a situações de calamidade não são apenas com relação a intempéries climáticas. Ele lembrou-se do caso do grande número de venezuelanos entrando em Roraima, que também exigiu uma mobilização do governo. Ou seja, a Defesa Civil dos Estados e municípios precisa estar estruturada, com ações já ensaiadas antes de haver um incidente. Para você que me lê, isso parece óbvio. Mas o que vivemos nesse ano no Rio Grande do Sul demonstrou que pouco ou muito pouco de planos de antecipação, ou de contingência, foi colocado em prática.
Vale lembrar que, só em 2023, ocorreram mortes provocadas por enchentes e enxurradas em março, junho, julho, setembro, novembro e dezembro. Ou seja, já tínhamos tido 81 mortes em distintas regiões do Estado. Esses dados eu mesma levantei junto à Defesa Civil. Mas isso não bastou para que os órgãos competentes tomassem as medidas de precaução em 2024.
O jornalista e radialista Paulo Mueller, que acompanhou vários episódios de acidentes de todo tipo em Santa Catarina, tocou numa situação que todo mundo que cobre esse tipo de pauta enfrenta: a dificuldade de se ter acesso às fontes oficiais. É muito comum os jornalistas pedirem informações para a assessoria de imprensa do governo ou da Defesa Civil, mas se tiver a resposta, a prioridade é o atendimento ao chamado, não a imprensa.
Mueller contou o quanto a Defesa Civil de Santa Catarina se capacitou, se estruturou ao longo do tempo, depois de tantos episódios de enchente. Em Blumenau, por exemplo, todos os moradores já sabem se a sua rua vai alagar. O Estado vizinho também utiliza as escolas para trabalhar a cultura da prevenção. Lá também há muitos problemas devido à ocupação desordenada no solo.
E aí, pergunto: por que ainda não se estruturou programas de educação e comunicação que atendam às necessidades das comunidades e da imprensa? Será que os governos estão se dando conta que se houvesse um sistema eficiente que explicasse o risco, nesse momento de crise climática, as mortes e perdas incalculáveis seriam evitadas? Isso é ou não é negacionismo?
Essas lives são muito esclarecedoras para termos noção do quanto esse assunto precisa ser compreendido por todos. Pois somos todos vulneráveis a novos possíveis episódios. Pior: situações terríveis de desgraça ainda são usadas politicamente para contar vantagem de que estão fazendo isso, aquilo, quando, na verdade, para evitar que o pior acontecesse, quase nada foi feito. Assim que um técnico fica sabendo o risco que determinada região, município corre, o tomador de decisão é informado. Só que o que sentimos na pele, aqui no RS, é que a decisão de informar e como informar é muito lenta ou considera primeiro o contexto político e não o socioambiental e econômico.
Em tempos de redes sociais e de “influencers” que se aproveitam de tragédias para ter mais visualizações, muita mentira, desinformação da pior espécie circulou. Então, é mais do que na hora dos governos estruturarem mecanismos de comunicação que traduzam e deixem claro o que deve ser feito em caso de risco. Será que não seria mais eficiente do que ter que desmentir as mentiras que espalham durante os desastres?
Segundo Maria Teresa, que acompanhou de perto o desastre de São Sebastião, no carnaval do ano passado, as autoridades de São Paulo sabiam que choveria muito acima da média naquele feriadão, mas não se empenharam em alertar sobre o risco que as pessoas correriam ao ir para o badalado litoral paulista. Ela disse ainda que o Instituto de Pesquisas Tecnológicas (IPT) já tinha feito um levantamento e mapeado 52 áreas de risco – mais da metade no lugar onde houve o deslizamento – em São Sebastião. Será que o governo não tomou as medidas de prevenção necessárias para salvar vidas?
A jornalista reforçou a necessidade de os profissionais de imprensa saberem se cuidar e obedecerem aos protocolos de seguranças. Ela atualmente atua em favelas no Rio e diz que as medidas são iguais à cobertura de um campo minado de guerra. Maria Teresa salientou a necessidade das redações, de quem atua direto nas coberturas, se capacitarem para enfrentar desafios extremos. Ficar sem conexão de celular, sem conseguir chegar aos locais e, ao mesmo tempo, ter empatia para saber se colocar no lugar do outro, são desafios complexos que precisam ser pensados muito antes de um desastre acontecer.
Você sabe doar direito?
A comunicação sobre o que doar e formas de como enviar também foram abordadas no encontro. Os participantes evidenciaram o quanto a população precisa ser solidária na hora de escolher e remeter as doações. Tem gente que mandou fantasia de carnaval, roupas íntimas – aliás, não se deve mandar esse tipo de vestimenta usada, só se for nova – pinguim de geladeira e até fita VHS de como fazer bijuterias para abrigos. Outra dica é que pares de sapatos devem estar amarrados juntos, pois também é fácil de se perder um pé do outro.
Situação das escolas
Marque na agenda, haverá outra live sobre a situação hoje das escolas atingidas pela enchente. Já foram realizados encontros online nos dias 22 de julho e 12 de agosto, com as escolas da Rede Municipal de Ensino de POA. A próxima será no dia 2 de setembro, às 19h30. Os professores estarão tratando das escolas públicas de Região Metropolitana. No YouTube do projeto Fazeres Pedagógicos, um projeto da Faculdade de Educação da UFRGS.
Foto da Capa: FreepikMais textos de Sílvia Marcuzzo: Clique Aqui.
Sílvia Marcuzzo é jornalista, artivista, mestranda na Famecos/PUCRS e integrante do Grupo de Pesquisa sobre Comunicação, Crise e Cuidado. Articuladora de coletivos, repórter freelancer e editora de publicações socioambientais. Trabalha com comunicação e meio ambiente desde 1993. É consultora e assessora de organizações que atuam pelo bem da coletividade, por um mundo mais sustentável e com qualidade de vida para todos. Saiba mais em silviamarcuzzo.com.br
This guide is part of State of Emergency, a Grist series exploring how climate disasters are impacting voting and politics. A companion piece examines the logistics of voting if you’ve been impacted by extreme weather.
No matter where you live, extreme weather can hit your area, causing damage to homes, power outages, and dangerous or deadly conditions. If you’re on the coast, it may be a hurricane; in the Midwest or South, a tornado; in the West, wildfires; and as we’ve seen in recent years, anywhere can experience heat waves or flash flooding.
Living through a disaster and its aftermath can be both traumatic and chaotic, from the immediate losses of life and belongings to conflicting information around where to access aid. The weeks and months after may be even more difficult, as the attention on your community is gone but civic services and events have stalled or changed drastically.
Grist compiled this resource guide to help you stay prepared and informed. It looks at everything from how to find the most accurate forecasts to signing up for emergency alerts to the roles that different agencies play in disaster aid.
An aerial view shows flooding in Merced, California following a “bomb cyclone” in January 2023. Josh Edelson / AFP via Getty Images
Where to find the facts on disasters
These days, many people find out about disasters in their area via social media. But it’s important to make sure the information you’re receiving is accurate. Here’s where to find the facts on extreme weather and the most reliable places to check for emergency alerts and updates.
Your local emergency manager: Your city or county will have an emergency management department, which is part of the local government. In larger cities, it’s often a separate agency; in smaller communities, fire chiefs or sheriff’s offices may manage emergency response and alerts. Emergency managers are responsible for communicating with the public about disasters, managing rescue and response efforts, and coordinating between different agencies. They usually have an SMS-based emergency alert system, so sign up for those via your local website (Note: Some cities have multiple languages available, but most emergency alerts are only in English.) Many emergency management agencies are active on Facebook, so check there for updates as well.
Local news: The local television news and social media accounts from verified news sources will have live updates during and after a storm. Follow your local newspaper and television station on Facebook or other social media, or check their websites regularly.
Weather stations and apps: The Weather Channel, Apple Weather, and Google will have information on major storms, but that may not be the case for smaller-scale weather events, and you shouldn’t rely on these apps to tell you if you need to evacuate or move to higher ground.
National Weather Service: This agency, also known as NWS, is part of the National Oceanic and Atmospheric Administration and offers information and updates on everything from wildfires to hurricanes to air quality. You can enter your zip code on weather.gov and customize your homepage. The NWS also has regional and local branches where you can sign up for SMS alerts. If you’re in a rural area or somewhere that isn’t highlighted on its maps, keep an eye out for local alerts and evacuation orders, as NWS may not have as much information ahead of time.
Cal Fire firefighters livestream images and data from efforts to control and contain the Park Fire on July 29 near Chico, California. David McNew/Getty Images
These can often be expensive to create, so contact your local disaster aid organizations, houses of worship, or charities to see if there are free or affordable kits available. Try to gather as much as you can ahead of time in case shelves are empty when a storm is on the way.
Some of the most important things to have:
Water (one gallon per person per day for several days)
Food (at least a several-day supply of non-perishable food) and a can opener
Medicines and documentation of your medical needs
Identification and proof of residency documents (see a more detailed list below)
Battery-powered or hand crank radio, batteries, flashlight
First aid kit
Masks, hand sanitizer, and trash bags
Wrench or pliers
Cell phone with chargers and a backup battery
Diapers, wipes, and food or formula for babies and children
Food and medicines for any household pets
Don’t forget: Documents
One of the most important things to have in your emergency kit is documents you may need to prove your residence, demonstrate extent of damage, and vote. FEMA often requires you to provide these documents in order to receive financial assistance after a disaster.
Government issued ID, such as a drivers’ license for for each member of your household
Proof of citizenship or legal residency for each member of your household (passport, green card, etc.)
Social Security card for each member of your household
Documentation of your medical needs, such as medications or special equipment including oxygen tanks, wheelchairs, etc.
Health insurance card
Car title and registration documents
Pre-disaster photos of the inside and outside of your house and belongings
Copy of your homeowners’ or renters’ insurance policy
For homeowners: copies of your deed, mortgage information, and flood insurance policy, if applicable
For renters: a copy of your lease
Financial documents such as a checkbook or voided check
You can find more details about why you may need these documents here.
A volunteer assesses the remains of a charred apartment complex in the aftermath of a wildfire in Lahaina, western Maui, Hawaiʻi in 2023. Yuki Iwamura/AFP via Getty Images
Disaster aid 101
It can be hard to know who to lean on or trust when it comes to natural disasters. Where do official evacuation orders come from, for example, or who do you call if you need to be rescued? And where can you get money to help pay for emergency housing or to rebuild your home or community. Here’s a breakdown of the government officials and agencies in charge of delivering aid before, during, and after a disaster:
Emergency management agencies: Almost all cities and counties have local emergency management departments, which are part of the local government. Sometimes they’re agencies all their own, but in smaller communities, fire chiefs or sheriff’s offices may manage emergency response and alerts. These departments are the first line of defense during a weather disaster. They’re responsible for communicating with the public about incoming disasters, managing rescue and response efforts during an extreme weather event, and coordinating between different agencies. Many emergency management agencies, however, have a small staff and are under-resourced.
Much of the work that emergency managers do happens before a disaster: They develop response plans that lay out evacuation routes and communication procedures, and they also delegate responsibility to different government agencies like the police, fire, and public health departments. Most counties and cities publish these plans online.
In most cases, they are the most trustworthy resource in the days just before and just after a hurricane or other big weather event. They’ll send out alerts and warnings, coordinate evacuation efforts, and direct survivors and victims to resources and shelter.
You can find your state emergency management agency here. There isn’t a comprehensive list by county or city, but if you search your location online you’ll likely find a website, a page on the county or city website, or a Facebook page that posts updates.
Law enforcement: County sheriffs and city police departments are often the largest and best-staffed agencies in a given community, so they play a key role during disasters. Sheriff’s departments often enforce mandatory evacuation orders, going door-to-door to ensure that people vacate an area. They manage traffic flow during evacuations and help conduct search and rescue operations.
Law enforcement agencies may restrict access to disaster areas for the first few days after a flood or fire. In most states, city and county governments also have the power to issue curfew orders, and law enforcement officers can enforce these curfews with fines or even arrests. In some rural counties, the sheriff’s department may serve as the emergency management department.
Lexington Firefighters’ swift water teams rescue people stranded by extreme rain in Lost Creek, Kentucky in 2022. Michael Swensen/Getty Images
Governor: State governors control several key aspects of disaster response. They have the power to declare a state of emergency, which allows them to deploy rescue and repair workers, distribute financial assistance to local governments, and activate the state National Guard. The governor has a key role in the immediate response to a disaster, but a smaller role in distributing aid and assistance to individual disaster victims.
In almost all U.S. states, and all hurricane-prone states along the Gulf of Mexico, the governor also has the power to announce mandatory evacuation orders. The penalty for not following these orders differs, but is most often a cash fine. (Though states seldom enforce these penalties.) The state government also decides whether to implement other transportation procedures such as contraflow, where officials reverse traffic flow on one side of a highway to allow larger amounts of people to evacuate.
HUD: The Department of Housing and Urban Development, or HUD, also spends billions of dollars to help communities recover after disasters, building new housing and public buildings such as schools — but this money takes much longer to arrive. Unlike FEMA, HUD must wait for Congress to approve its post-disaster work, and then it must dole out grants to states for specific projects. In some cases, such as the aftermaths of Hurricane Laura in Louisiana or Hurricane Florence in North Carolina, it took years for projects to get off the ground. States and local governments, not individual people, apply for money from HUD, but the agency can direct you to FEMA or housing counselors.
A homeowner hangs a sign that reads “FEMA please help make Mexico Beach great again” on a house damaged by Hurricane Michael in Florida in 2018. Hector Retamal/AFP via Getty Images
FEMA
The Federal Emergency Management Agency, or FEMA, is the federal government’s main disaster response agency. It provides assistance to states and local governments during large events like hurricanes, wildfires, and floods. FEMA is part of the Department of Homeland Security.
FEMA is almost never the first resource on the ground after a disaster strikes. In order for the agency to send resources to a disaster area, the state’s governor must first request a disaster declaration from the president, and the president must approve it. For large disasters such as Category 4 or 5 hurricanes, this typically happens fast. For smaller disasters, like severe rain or flooding events, it can take weeks or even months for the president to grant a declaration and activate the agency. FEMA has historically not responded to heat waves.
FEMA is broken into regional offices and offers specific contacts and information for each of those, as well as for tribal nations. You can find your FEMA region here.
FEMA has two primary roles after a federally declared disaster:
Contributing to community rebuilding costs: The agency helps states and local governments pay for the cost of removing debris and rebuilding public infrastructure. During only the most extreme events, the agency also deploys its own teams of firefighters and rescue workers to help locate missing people, clear roadways, and restore public services. For the most part, states and local law enforcement conduct on-the-ground recovery work. (Read more about FEMA’s responsibilities and programs here.)
Individual financial assistance: FEMA gives outfinancial assistanceto individual people who have lost their homes and belongings. This assistance can take several forms. FEMA gives out pre-loaded debit cards to help people buy food and fuel in the first days after a disaster, and may also provide cash payments for home repairs that your insurance doesn’t cover. The agency also provides up to 18 months of housing assistance for people who lose their homes in a disaster, and sometimes houses disaster survivors in its own manufactured housing units or “FEMA trailers.” FEMA also sometimes covers funeral and grieving expenses as well as medical and dental treatment.
In the aftermath of a disaster, FEMA offers survivors:
A one-time payment of $750 for emergency needs
Temporary housing assistance equivalent to 14 nights’ stay in a hotel in your area
Up to 18 months of rental assistance
Payments for lost property that isn’t covered by your homeowner’s insurance
And other forms of assistance, depending on your needs and losses
If you are a U.S. citizen or meet certain qualifications as a non-citizen and live in a federal disaster declaration area, you are eligible for financial assistance. Regardless of citizenship or immigration status, if you are affected by a disaster you may be eligible for crisis counseling, disaster legal services, disaster case management, medical care, shelter, food, and water.
FEMA representatives take information from people displaced by Hurricane Ian in Estero, Florida in 2022. Thomas Simonetti for The Washington Post via Getty Images
FEMA also runs the National Flood Insurance Program, which provides insurance coverage of up to $350,000 for home flood damage. The agency recommends that everyone who lives in a flood zone purchase this coverage — and most mortgage lenders require it for borrowers in flood zones — though many homes outside the zones are also vulnerable. You must begin paying for flood insurance at least 30 days before a disaster in order to be eligible for a payout. You can check if your home is in a flood zone by using this FEMA website.
How to get FEMA aid: The easiest way to apply for individual assistance from FEMA is to fill out the application form ondisasterassistance.gov. This is easiest to do from a personal computer over Wi-Fi, but you can do it from a smartphone with cellular data if necessary. This website does not become active until the president issues a disaster declaration.
Some important things to know:
FEMA will require you to create an account on the secure website Login.gov. Use this account to submit your aid application.
You can track the status of your aid application and receive notifications if FEMA needs more documents from you.
If FEMA denies your application for aid, you can appeal, but the process is lengthy.
Visiting a FEMA site in your area after a disaster: FEMA disaster recovery centers are facilities and mobile units where you can find information about the agency’s programs as well as other state and local resources. FEMA representatives can help you navigate the aid application process or direct you to nonprofits, shelters, or state and local resources. Visit this website to locate a recovery center in your area or text DRC and a ZIP Code to 43362. Example: DRC 01234.
A woman looks over her apartment in Fort Myers, Florida, after Hurricane Ian inundated it with floodwaters in 2022. Joe Raedle/Getty Images
What to expect after a disaster
Disasters affect people in many different ways, and it’s normal to grieve your losses — personal, professional, community — in your own time. Here are a few resources if you need mental health support after experiencing an extreme weather event.
The National Center for PTSD, or post-traumatic stress disorder, on what to expect after experiencing a disaster.
The American Red Cross has disaster mental health volunteers they often dispatch to areas hit by a disaster.
The Substance Abuse and Mental Health Services Administration, or SAMHSA, has a fact sheet on managing stress after a disaster. The agency has a Disaster Distress Helpline that provides 24/7 crisis counseling and support. Call or text: 1-800-985-5990
After a disaster is an especially vulnerable time. Beware of scams and make sure to know your rights.
Be wary of solicitors who arrive at your home after a disaster claiming to represent FEMA or another agency. FEMA will never ask you for money. The safest way to apply for aid is through FEMA’s official website: disasterassistance.gov.
Be cautious about hiring contractors or construction workers in the days after a disaster. Many cities require permits for rebuilding work, and it’s common for scammers to pose as contractors after a disaster.
Renters can often face evictions after a disaster, so familiarize yourself with tenant rights in your state.
Residents of Paradise, California visit the town’s planning department to file permitting applications to re-build homes and other structures after the devastating 2018 Camp Fire. Gabrielle Lurie/San Francisco Chronicle via Getty Image
What to keep in mind before, during, and after a disaster
The most important thing to consider during a disaster is your own, your family’s, and your community’s safety. The National Weather Service has a guide for hurricanes and floods; FEMA has a guide for wildfires; the Centers for Disease Control and Prevention has a guide for extreme heat safety.
A few potentially life-saving things to remember:
Never wade in floodwaters. They often contain harmful runoff from sewer systems and can cause serious illness and health issues.
If it’s safe to do so, turn off electricity at the main breaker or fuse box in your home or business before a hurricane to prevent electric shock.
If you lose power, never operate a generator inside your home. Generators emit carbon monoxide, a colorless and odorless gas that can be fatal if inhaled.
Did we miss something? Please let us know by emailing community@grist.org.
Só a ciência, sem a política, não vai conseguir produzir as soluções que o mundo precisa para combater a crise climática.
Quem diz é Michael Sandel, professor de filosofia política da Universidade Harvard e autor de diversos livros —o último publicado no Brasil é “O Descontentamento da Democracia” (ed. Civilização Brasileira).
A frase pode até parecer um truísmo, mas resume o cerne das críticas de Sandel às democracias contemporâneas: quando a política é dominada pelo discurso tecnocrático, os cidadãos acabam sem voz e sem meios de participar das decisões que afetam suas vidas.
Em “O Descontentamento da Democracia”, ele diz que a culpa da ascensão do autoritarismo pelo mundo é do chamado neoliberalismo, que promoveu o fortalecimento do setor financeiro e a desregulação dos mercados.
Para Sandel, essas políticas foram levadas adiante por tecnocratas de direita e esquerda que alienaram cidadãos das decisões econômicas, amparados por um discurso de meritocracia, gerando uma reação de ressentimento contra as elites e ceticismo quanto à democracia.
Por isso, diz, é importante não repetir o mesmo erro com a política climática. A ciência é, sim, crucial para embasar as decisões, mas é preciso participação democrática —e as lideranças não podem usar o discurso científico como forma de escapar de suas responsabilidades.
Sandel participou recentemente do ciclo de palestras online Clima e Sociedade, promovido pela UFSM (Universidade Federal de Santa Maria), em que conversou com lideranças comunitárias que estão no front de combate aos efeitos das enchentes que atingiram o Rio Grande do Sul.
Em entrevista à Folha, ele explica como os pontos levantados em seu livro se aplicam ao debate climático, avalia a atuação de instituições multilaterais nesse campo e defende que se evite o discurso apocalíptico.
Em vez de reforçar um sentimento de solidariedade, crises como a pandemia parecem ter explicitado divisões —e democracias como os Estados Unidos continuam tão polarizadas quanto antes. O mundo superestima a capacidade dessas crises de gerar solidariedade mútua?
A pandemia foi um ótimo teste. No começo da crise de saúde, com frequência ouvíamos que essa emergência iria nos unir, mostrando que somos igualmente vulneráveis, apesar das desigualdades econômicas. Quem podia trabalhar de casa logo percebeu o quanto dependemos do trabalho de pessoas que são ignoradas.
Poderia ter sido a hora para debater melhores salários e reconhecimento para os trabalhadores essenciais. Mas isso não ocorreu. A pandemia retrocedeu e a gratidão a eles também. Foi uma oportunidade perdida, a pandemia não nos levou a uma transformação social ou espiritual.
Para manter o senso de comunidade que crises como as enchentes no Sul despertam, é necessário criar instituições e espaços públicos sólidos, além formas de organização. Pressionar os governos por recursos é importante, mas é preciso construir instituições na sociedade civil, estabelecer um diálogo contínuo para que todos entendam que dividimos uma vida comum.
Você coloca a economia no centro da sua análise da crise das democracias liberais, em detrimento de uma análise mais cultural, que hoje parece mais popular no debate público. Por que essa abordagem econômica é mais adequada?
Em “O Descontentamento da Democracia”, escrevo sobre o que chamo de economia política da cidadania. Nas últimas décadas, erramos ao pressupor que o único propósito da economia é promover o consumo. E que, portanto, nosso foco principal deveria ser o crescimento do PIB e a distribuição da riqueza.
Tudo isso importa, é claro, mas não são as únicas questões que devemos levar em conta. É preciso se perguntar quais arranjos econômicos são favoráveis à participação democrática.
Democracia não é só ir votar. Democracia é criar condições econômicas e sociais que possibilitem às pessoas deliberar como iguais [sobre seu destino], moldando as forças que as governam.
Quando as pessoas não têm voz, elas se sentem excluídas, raivosas, ressentidas —e vão se conectar a políticos demagogos que canalizam essa alienação. Isso é o que começa a explicar o que está havendo, nos últimos anos, tanto nos EUA quanto no Brasil.
Sou contra uma separação tão dura entre uma análise econômica e outra cultural sobre por que cidadãos têm apoiado líderes autoritários pelo mundo.
Nos últimos anos, a divisão entre vencedores e derrotados se aprofundou, envenenando a política. Isso tem em partes a ver com a desigualdade, mas há também uma mudança de atitude em relação ao sucesso individual.
Quem está no topo acha que os lucros que recebeu do mercado são a medida de seus méritos —e que quem ficou para trás, por consequência, também mereceria o próprio destino.
Isso ajuda a explicar a política da raiva e do ressentimento. E também o crescimento do populismo autoritário de direita. Muitos da classe trabalhadora acham que as elites os olham de cima para baixo, com especial desprezo contra aqueles que não receberam educação universitária.
Agora, quanto dessa análise é econômica e quanto é cultural? São ambos os casos. É econômica porque mostra como a economia pode deteriorar a democracia participativa. E porque foca no papel do crescimento da desigualdade. Mas também é cultural, porque identifico esses elementos de ressentimento.
É preciso atar as duas pontas, resolver as desigualdades e lidar com a sensação de não ter voz, a raiva de tantos da classe trabalhadora.
Sua análise está centrada na globalização e nas chamadas políticas neoliberais. Qual o impacto disso no debate político sobre a mudança climática?
A política da mudança climática é um exemplo de como algo focado nas elites rapidamente vira um discurso tecnocrático quanto ao meio ambiente, que pode reforçar a polarização.
Há um jeito de organizar a economia e conduzir as políticas públicas que leva os cidadãos a se sentir sem voz. É uma política que trata as questões econômicas e ambientais como algo técnico, que só diz respeito aos especialistas.
Vimos esse discurso tecnocrático durante a pandemia, quando representantes das elites diziam que só estavam “seguindo a ciência”, o que é um jeito de escapar das responsabilidades.
Claro que é importante seguir a ciência no meio de uma pandemia ou da mudança climática —mas é um erro pressupor que a ciência sozinha pode realizar as avaliações políticas necessárias.
Por exemplo, durante a pandemia, a ciência não podia resolver se deveríamos fechar as escolas e por quanto tempo. Esse era um julgamento político, que teve que ser debatido pelos cidadãos dentro do processo democrático —e quem tomou as decisões teria que assumir responsabilidade por elas.
Não adianta só dizer que se está seguindo a ciência. No caso da política climática, a ciência precisa informar as decisões que vamos tomar, mas essas medidas precisam ser debatidas entre as pessoas implicadas nelas. Pois isso envolve negociações, questões distributivas, um debate sobre quem vai pagar o preço da transição para a economia verde… E por aí vai.
O que nos trouxe a esse momento tão polarizado é a insistência das elites políticas de que são especialistas ou que estão amparadas por especialistas. Com isso, fica implícito que quem discorda ou está mal informado ou é ignorante. E que, portanto, essas pessoas não estariam qualificadas a ter voz.
É o mesmo que ocorreu com a dignidade da classe trabalhadora, deteriorada pela financeirização da economia, a terceirização do trabalho, tudo em nome dos especialistas que diziam que isso seria bom para todos.
Se repetimos essa postura tecnocrática no combate à mudança climática, teremos outra vez as elites olhando os cidadãos de cima, dizendo que estão só seguindo a ciência.
A mudança climática é uma crise que requer ação global. Mas, no seu livro, você mostra ceticismo quanto às organizações multilaterais. Como elas deveriam funcionar?
A mudança climática requer cooperação global, sem dúvidas. E isso significa que precisamos de instituições multilaterais para conceber e implementar políticas, a fim de proteger o planeta e promover a transição para a economia verde.
As instituições globais hoje operam como instituições tecnocráticas, sem legitimidade ou participação democrática. E esse é um problema com o qual teremos que lidar.
A Europa já estava lidando com isso antes de a crise climática se tornar algo tão central. Mesmo esse bloco, onde a maioria dos países têm tradição democrática, tem sido associado aos burocratas de Bruxelas. Cidadãos nacionais se ressentem de determinações vindas desses burocratas e acham que não têm voz.
O mesmo vale para as instituições que serão necessárias para lidarmos com a crise climática. Precisamos de plataformas para um discurso público global, que possa envolver os cidadãos comuns na formulação de políticas que nos levarão a uma economia verde.
Se for algo puramente tecnocrático, mesmo o grupo de especialistas melhor administrado não vai ser capaz de conquistar legitimidade democrática e implementar qualquer política. Em resumo, não sou cético quanto às instituições multilaterais, apenas quero enfatizar a necessidade de participação democrática.
Seu principal ponto é que as políticas neoliberais teriam levado eleitores para a extrema direita. Você aponta que o presidente Joe Biden foi o primeiro a romper com essas diretrizes econômicas. No entanto, Donald Trump tem grandes chances de ser eleito. O que houve?
Um novo mandato de Trump aumentaria os riscos que a democracia americana enfrenta. Sim, Joe Biden rompeu com o mercado neoliberal que produziu a polarização política.
Ele falou sobre tentar restaurar a dignidade do trabalho, inclusive para quem não tem formação universitária.
Biden revitalizou as políticas antitruste, não só com objetivo de diminuir preços ao consumidor, mas também de responsabilizar o poder econômico, especialmente no caso das “big techs”. Também levou o Congresso a implementar investimentos públicos em infraestrutura que não eram vistos há décadas.
Por que ele não está colhendo dividendos políticos disso? Ele não foi capaz de articular essas medidas em uma nova visão de governo, não conseguiu explicar como todas essas políticas, se vistas em conjunto, podem renovar a cidadania democrática. E que, ao restaurar a dignidade do trabalho, as pessoas podem ter voz na política.
Uma liderança não depende só de implementar boas políticas, mas de oferecer uma visão que seja ao mesmo tempo econômica, política e moral.
RAIO-X
Michael J. Sandel, 71
É professor de filosofia política na Universidade Harvard, nos EUA, com obras que já foram traduzidas para mais de 30 línguas. Em livros como “O Descontentamento da Democracia” e “A Tirania do Mérito”, escreve sobre ética, economia e democracia, entre outros temas. Seu curso intitulado Justiça foi o primeiro de Harvard a ser disponibilizado gratuitamente online —e já foi visto por dezenas de milhões de pessoas.
Researchers measuring the effect of Hurricane Sandy on children in utero at the time reported: ‘Our findings are extremely alarming.’ Illustration: Ngadi Smart/The Guardian
Are growing rates of anxiety, depression, ADHD, PTSD, Alzheimer’s and motor neurone disease related to rising temperatures and other extreme environmental changes?
In late October 2012, a category 3 hurricane howled into New York City with a force that would etch its name into the annals of history. Superstorm Sandy transformed the city, inflicting more than $60bn in damage, killing dozens, and forcing 6,500 patients to be evacuated from hospitals and nursing homes. Yet in the case of one cognitive neuroscientist, the storm presented, darkly, an opportunity.
Yoko Nomura had found herself at the centre of a natural experiment. Prior to the hurricane’s unexpected visit, Nomura – who teaches in the psychology department at Queens College, CUNY, as well as in the psychiatry department of the Icahn School of Medicine at Mount Sinai – had meticulously assembled a research cohort of hundreds of expectant New York mothers. Her investigation, the Stress in Pregnancy study, had aimed since 2009 to explore the potential imprint of prenatal stress on the unborn. Drawing on the evolving field of epigenetics, Nomura had sought to understand the ways in which environmental stressors could spur changes in gene expression, the likes of which were already known to influence the risk of specific childhood neurobehavioural outcomes such as autism, schizophrenia and attention deficit hyperactivity disorder (ADHD).
The storm, however, lent her research a new, urgent question. A subset of Nomura’s cohort of expectant women had been pregnant during Sandy. She wanted to know if the prenatal stress of living through a hurricane – of experiencing something so uniquely catastrophic – acted differentially on the children these mothers were carrying, relative to those children who were born before or conceived after the storm.
More than a decade later, she has her answer. The conclusions reveal a startling disparity: children who were in utero during Sandy bear an inordinately high risk of psychiatric conditions today. For example, girls who were exposed to Sandy prenatally experienced a 20-fold increase in anxiety and a 30-fold increase in depression later in life compared with girls who were not exposed. Boys had 60-fold and 20-fold increased risks of ADHD and conduct disorder, respectively. Children expressed symptoms of the conditions as early as preschool.
Flooding in Lindenhurst, New York, in October 2012, after Hurricane Sandy struck. Photograph: Bruce Bennett/Getty Images
“Our findings are extremely alarming,” the researchers wrote in a 2022 study summarising their initial results. It is not the type of sentence one usually finds in the otherwise measured discussion sections of academic papers.
Yet Nomura and her colleagues’ research also offers a representative page in a new story of the climate crisis: a story that says a changing climate doesn’t just shape the environment in which we live. Rather, the climate crisis spurs visceral and tangible transformations in our very brains. As the world undergoes dramatic environmental shifts, so too does our neurological landscape. Fossil-fuel-induced changes – from rising temperatures to extreme weather to heightened levels of atmospheric carbon dioxide – are altering our brain health, influencing everything from memory and executive function to language, the formation of identity, and even the structure of the brain. The weight of nature is heavy, and it presses inward.
Evidence comes from a variety of fields. Psychologists and behavioural economists have illustrated the ways in which temperature spikes drive surges in everything from domestic violence to online hate speech. Cognitive neuroscientists have charted the routes by which extreme heat and surging CO2 levels impair decision-making, diminish problem-solving abilities, and short-circuit our capacity to learn. Vectors of brain disease, such as ticks and mosquitoes, are seeing their habitable ranges expand as the world warms. And as researchers like Nomura have shown, you don’t need to go to war to suffer from post-traumatic stress disorder: the violence of a hurricane or wildfire is enough. It appears that, due to epigenetic inheritance, you don’t even need to have been born yet.
When it comes to the health effects of the climate crisis, says Burcin Ikiz, a neuroscientist at the mental-health philanthropy organisation the Baszucki Group, “we know what happens in the cardiovascular system; we know what happens in the respiratory system; we know what happens in the immune system. But there’s almost nothing on neurology and brain health.” Ikiz, like Nomura, is one of a growing cadre of neuroscientists seeking to connect the dots between environmental and neurological wellness.
As a cohesive effort, the field – which we might call climatological neuroepidemiology – is in its infancy. But many of the effects catalogued by such researchers feel intuitive.
Residents evacuate Evia, Greece, in 2021, after wildfires hit the island. Photograph: Bloomberg/Getty Images
Perhaps you’ve noticed that when the weather gets a bit muggier, your thinking does the same. That’s no coincidence; it’s a nearly universal phenomenon. During a summer 2016 heatwave in Boston, Harvard epidemiologists showed that college students living in dorms without air conditioning performed standard cognitive tests more slowly than those living with it. In January of this year, Chinese economists noted that students who took mathematics tests on days above 32C looked as if they had lost the equivalent of a quarter of a year of education, relative to test days in the range 22–24C. Researchers estimate that the disparate effects of hot school days – disproportionately felt in poorer school districts without access to air conditioning and home to higher concentrations of non-white students – account for something on the order of 5% of the racial achievement gap in the US.
Cognitive performance is the tip of the melting iceberg. You may have also noticed, for example, your own feelings of aggression on hotter days. You and everyone else – and animals, too. Black widow spiders tend more quickly toward sibling cannibalism in the heat. Rhesus monkeys start more fights with one another. Baseball pitchers are more likely to intentionally hit batters with their pitches as temperatures rise. US Postal Service workers experience roughly 5% more incidents of harassment and discrimination on days above 32C, relative to temperate days.
Neuroscientists point to a variety of routes through which extreme heat can act on behaviour. In 2015, for example, Korean researchers found that heat stress triggers inflammation in the hippocampus of mice, a brain region essential for memory storage. Extreme heat also diminishes neuronal communication in zebrafish, a model organism regularly studied by scientists interested in brain function. In human beings, functional connections between brain areas appear more randomised at higher temperatures. In other words, heat limits the degree to which brain activity appears coordinated. On the aggression front, Finnish researchers noted in 2017 that high temperatures appear to suppress serotonin function, more so among people who had committed violent crimes. For these people, blood levels of a serotonin transporter protein, highly correlated with outside temperatures, could account for nearly 40% of the fluctuations in the country’s rate of violent crime.
Prolonged exposure to heat can activate a multitude of biochemical pathways associated with Alzheimer’s and Parkinson’s. Illustration: Ngadi Smart/The Guardian
“We’re not thinking about any of this,” says Ikiz. “We’re not getting our healthcare systems ready. We’re not doing anything in terms of prevention or protections.”
Ikiz is particularly concerned with the neurodegenerative effects of the climate crisis. In part, that’s because prolonged exposure to heat in its own right – including an increase of a single degree centigrade – can activate a multitude of biochemical pathways associated with neurodegenerative diseases such as Alzheimer’s and Parkinson’s. Air pollution does the same thing. (In rats, such effects are seen after exposure to extreme heat for a mere 15 minutes a day for one week.) Thus, with continued burning of fossil fuels, whether through direct or indirect effects, comes more dementia. Researchers have already illustrated the manners in which dementia-related hospitalisations rise with temperature. Warmer weather worsens the symptoms of neurodegeneration as well.
Prior to her move to philanthropy, Ikiz’s neuroscience research largely focused on the mechanisms underlying the neurodegenerative disease amyotrophic lateral sclerosis (ALS, also known as Lou Gehrig’s disease or motor neurone disease). Today, she points to research suggesting that blue-green algae, blooming with ever-increasing frequency under a changing global climate, releases a potent neurotoxin that offers one of the most compelling causal explanations for the incidence of non-genetic ALS. Epidemiologists have, for example, identified clusters of ALS cases downwind of freshwater lakes prone to blue-green algae blooms.
A supermarket in Long Beach is stripped of water bottles in preparation for Hurricane Sandy. Photograph: Mike Stobe/Getty Images
It’s this flavour of research that worries her the most. Children constitute one of the populations most vulnerable to these risk factors, since such exposures appear to compound cumulatively over one’s life, and neurodegenerative diseases tend to manifest in the later years. “It doesn’t happen acutely,” says Ikiz. “Years pass, and then people get these diseases. That’s actually what really scares me about this whole thing. We are seeing air pollution exposure from wildfires. We’re seeing extreme heat. We’re seeing neurotoxin exposure. We’re in an experiment ourselves, with the brain chronically exposed to multiple toxins.”
Other scientists who have taken note of these chronic exposuresresort to similarly dramatic language as that of Nomura and Ikiz. “Hallmarks of Alzheimer disease are evolving relentlessly in metropolitan Mexico City infants, children and young adults,” is part of the title of a recent paper spearheaded by Dr Lilian Calderón-Garcidueñas, a toxicologist who directs the University of Montana’s environmental neuroprevention laboratory. The researchers investigated the contributions of urban air pollutionand ozone to biomarkers of neurodegeneration and found physical hallmarks of Alzheimer’s in 202 of the 203 brains they examined, from residents aged 11 months to 40 years old. “Alzheimer’s disease starting in the brainstem of young children and affecting 99.5% of young urbanites is a serious health crisis,” Calderón-Garcidueñas and her colleagues wrote. Indeed.
Flooding in Stonehaven, Aberdeenshire, in 2020. Photograph: Martin Anderson/PA
Such neurodevelopmental challenges – the effects of environmental degradation on the developing and infant brain – are particularly large, given the climate prognosis. Rat pups exposed in utero to 40C heat miss brain developmental milestones. Heat exposure during neurodevelopment in zebrafish magnifies the toxic effects of lead exposure. In people, early pregnancy exposure to extreme heat is associated with a higher risk of children developing neuropsychiatric conditions such as schizophrenia and anorexia. It is also probable that the ALS-causing neurotoxin can travel in the air.
Of course, these exposures only matter if you make it to an age in which neural rot has a chance to manifest. Neurodegenerative disease mostly makes itself known in middle-aged and elderly people. But, on the other hand, the brain-eating amoeba likely to spread as a result of the climate crisis – which is 97% fatal and will kill someone in a week – mostly infects children who swim in lakes. As children do.
A coordinated effort to fully understand and appreciate the neurological costs of the climate crisis does not yet exist. Ikiz is seeking to rectify this. In spring 2024, she will convene the first meeting of a team of neurologists, neuroscientists and planetary scientists, under the banner of the International Neuro Climate Working Group.
The goal of the working group (which, full disclosure, I have been invited to join) is to wrap a collective head around the problem and seek to recommend treatment practices and policy recommendations accordingly, before society finds itself in the midst of overlapping epidemics. The number of people living with Alzheimer’s is expected to triple by 2050, says Ikiz – and that’s without taking the climate crisis into account. “That scares me,” she says. “Because in 2050, we’ll be like: ‘Ah, this is awful. Let’s try to do something.’ But it will be too late for a lot of people.
“I think that’s why it’s really important right now, as evidence is building, as we’re understanding more, to be speaking and raising awareness on these issues,” she says. “Because we don’t want to come to that point of irreversible damage.”
For neuroscientists considering the climate problem, avoiding that point of no return implies investing in resilience research today. But this is not a story of climate anxiety and mental fortitude. “I’m not talking about psychological resilience,” says Nomura. “I’m talking about biological resilience.”
A research agenda for climatological neuroepidemiology wouldprobably bridge multiple fields and scales of analysis. It would merge insights from neurology, neurochemistry, environmental science, cognitive neuroscience and behavioural economics – from molecular dynamics to the individual brain to whole ecosystems. Nomura, for example, wants to understand how external environmental pressures influence brain health and cognitive development; who is most vulnerable to these pressures and when; and which preventive strategies might bolster neurological resilience against climate-induced stressors. Others want to price these stressors, so policymakers can readily integrate them into climate-action cost-benefit analyses.
Storm devastation in Seaside Heights, New Jersey. Photograph: Mike Groll/AP
For Nomura, it all comes back to stress. Under the right conditions, prenatal exposure to stress can be protective, she says. “It’s like an inoculation, right? You’re artificially exposed to something in utero and you become better at handling it – as long as it is not overwhelmingly toxic.” Stress in pregnancy, in moderation, can perhaps help immunise the foetus against the most deleterious effects of stress later in life. “But everybody has a breaking point,” she says.
Identifying these breaking points is a core challenge of Nomura’s work. And it’s a particularly thorny challenge, in that as a matter of both research ethics and atmospheric physics, she and her colleagues can’t just gin up a hurricane and selectively expose expecting mothers to it. “Human research in this field is limited in a way. We cannot run the gold standard of randomised clinical trials,” she says. “We cannot do it. So we have to take advantage of this horrible natural disaster.”
Recently, Nomura and her colleagues have begun to turn their attention to the developmental effects of heat. They will apply similar methods to those they applied to understanding the effects of Hurricane Sandy – establishing natural cohorts and charting the developmental trajectories in which they’re interested.
The work necessarily proceeds slowly, in part because human research is further complicated by the fact that it takes people longer than animals to develop. Rats zoom through infancy and are sexually mature by about six weeks, whereas for humans it takes more than a decade. “That’s a reason this longitudinal study is really important – and a reason why we cannot just get started on the question right now,” says Nomura. “You cannot buy 10 years’ time. You cannot buy 12 years’ time.” You must wait. And so she waits, and she measures, as the waves continue to crash.
Clayton Page Aldern’s book The Weight of Nature, on the effects of climate change on brain health, is published by Allen Lane on 4 April.
Brad Plumer, Max Bearak, Lisa Friedman, Jenny Gross
Nov. 20, 2022
Nations reached a landmark deal to compensate developing nations for climate harm. But some leaders said the summit didn’t go far enough in addressing the root causes of global warming.
Sameh Shoukry, the Egyptian foreign minister, seated, reading a statement at the closing session of climate talks in Sharm el Sheikh. Credit: Mohamed Abd El Ghany/Reuters
Nov. 20, 2022, 3:33 a.m. ET
SHARM EL SHEIKH, Egypt — Diplomats from nearly 200 countries concluded two weeks of climate talks on Sunday by agreeing to establish a fund that would help poor, vulnerable countries cope with climate disasters made worse by the greenhouse gases from wealthy nations.
The decision on payments for loss and damage caused by global warming represented a breakthrough on one of the most contentious issues at United Nations climate negotiations. For more than three decades, developing nations have pressed rich, industrialized countries to provide compensation for the costs of destructive storms, heat waves and droughts linked to rising temperatures.
But the United States and other wealthy countries had long blocked the idea, for fear that they could face unlimited liability for the greenhouse gas emissions that are driving climate change.
The loss and damage agreement hammered out in this Red Sea resort town makes clear that payments are not to be seen as an admission of liability. The deal calls for a committee with representatives from 24 countries to work over the next year to figure out exactly what form the fund should take, which countries and financial institutions should contribute, and where the money should go. Many of the other details are still to be determined.
Developing countries hailed the deal as a landmark victory.
“The announcement offers hope to vulnerable communities all over the world who are fighting for their survival from climate stress,” said Sherry Rehman, the climate minister of Pakistan, which suffered catastrophic flooding this summer that left one-third of the country underwater and caused $30 billion in damages. Scientists later found that global warming had worsened the deluges.
While the new climate agreement dealt with the damages from global warming, it did far less to address the greenhouse gas emissions that are the root cause of the crisis. Experts say it is crucial for all nations to slash their emissions much more rapidly in order to keep warming at relatively safe levels. But the deal did not go much beyond what countries agreed to last year at U.N. climate talks in Glasgow.
“The loss and damage deal agreed is a positive step, but it risks becoming a ‘fund for the end of the world’ if countries don’t move faster to slash emissions,” said Manuel Pulgar-Vidal, who presided over the United Nations summit in 2014 and is now the climate lead for the World Wide Fund for Nature. “We cannot afford to have another climate summit like this one.”
The new agreement emphasizes that countries should strive to limit global warming to 1.5 degrees Celsius, or 2.7 degrees Fahrenheit, above preindustrial levels. Beyond that threshold, scientists say, the risk of climate catastrophes increases significantly. Early in the summit, some negotiators feared that the talks would abandon a focus on that target, which many vulnerable nations, such as low-lying islands in the Pacific, see as essential to their survival.
Current policies by national governments would put the world on track for a much hotter 2.1 to 2.9 degrees Celsius of warming this century, compared with preindustrial levels. Staying at 1.5 degrees would require countries to slash their fossil-fuel emissions roughly in half this decade, a daunting task.
India and more than 80 other countries wanted language that would have called for a “phase-down” of all fossil fuels, not just coal, but also oil and gas. That would have gone beyond the deal at Glasgow, which called for a “phase-down” of coal only. But that effort was blocked by major oil producers like Canada and Saudi Arabia, as well as by China, according to people close to the negotiations.
“It is more than frustrating to see overdue steps on mitigation and the phaseout of fossil energies being stonewalled by a number of large emitters and oil producers,” said Annalena Baerbock, the German foreign minister, in a statement.
Xie Zhenhua, China’s special envoy for climate, and Sherry Rehman, Pakistan’s climate minister, at the COP27 closing session on Sunday. Credit: Peter Dejong/Associated Press
Frans Timmermans, the European Union’s top climate official, said the deal fell far short of what was needed and was a sign of the growing gap between climate science and national climate policies. Too many countries blocked measures needed to address global warming, he said.
“Friends are only friends if they also tell you things you might not want to hear,” Mr. Timmermans said. “This is the make-or-break decade, but what we have in front of us is not enough of a step forward for people and planet.”
The two-week summit, which had been scheduled to end on Friday, stretched until dawn on Sunday as exhausted negotiators from nearly 200 nations clashed over fine print. The talks came at a time of multiple crises. Russia’s invasion of Ukraine has roiled global food supply and energy markets, stoked inflation and spurred some countries to burn more coal and other alternatives to Russian gas, threatening to undermine climate goals.
At the same time, rising global temperatures have intensified deadly floods in places like Pakistan and Nigeria, as well as fueled record heat across Europe and Asia. In the Horn of Africa, a third year of severe drought has brought millions to the brink of famine.
Much of the focus over the past two weeks was on loss and damage.
Developing nations — largely from Asia, Africa, Latin America, the Caribbean and South Pacific — fought first to place the debate over a loss and damage fund on the formal agenda of the two-week summit. And then they were relentless in their pressure campaign, arguing that it was a matter of justice, noting they did little to contribute to a crisis that threatens their existence. They made it clear that a summit held on the African continent that ended without addressing loss and damage would be seen as a moral failure.
As the summit neared its end, the European Union consented to the idea of a loss and damage fund, though it insisted that any aid should be primarily focused on the most vulnerable nations, and that aid might include a wide variety of options such as new insurance programs in addition to direct payments.
That left the United States, which has pumped more greenhouse gases into the atmosphere than any nation in history, as the last big holdout. By Saturday, as talks stretched into overtime, American officials said that they would accept a loss and damage fund, breaking the logjam.
Still, major hurdles remain.
There is no guarantee that wealthy countries will deposit money into the fund. A decade ago, the United States, the European Union and other wealthy emitters pledged to mobilize $100 billion per year in climate finance by 2020 to help poorer countries shift to clean energy and adapt to future climate risks through measures like building sea walls. They are still falling short by tens of billions of dollars annually.
And while American diplomats agreed to a fund, money must be appropriated by Congress. Last year, the Biden administration sought $2.5 billion in climate finance but secured just $1 billion, and that was when Democrats controlled both chambers. With Republicans set to take over the House in January, the prospects of Congress approving an entirely new pot of money for loss and damage appear dim.
“Sending U.S. taxpayer dollars to a U.N. sponsored green slush fund is completely misguided,” said Senator John Barrasso, Republican of Wyoming. “The Biden administration should focus on lowering spending at home, not shipping money to the U.N. for new climate deals. Innovation, not reparations, is key to fighting climate change.”
The United States and the European Union secured language in the deal that could expand the donor base to include major emerging economies like China and Saudi Arabia. The United Nations currently classifies China as a developing country, which has traditionally exempted it from obligations to provide climate aid, even though it is now the world’s biggest emitter of greenhouse gases as well as the second-largest economy. The new changes are likely to spark fights in the future, since China has fiercely resisted being treated as a developed nation in global climate talks.
For their part, a variety of European nations have voluntarily pledged more than $300 million to address loss and damage so far, with most of that money going toward a new insurance program to help countries recover from disasters like flooding. Poorer countries have praised those early efforts while noting that they may ultimately face hundreds of billions of dollars per year in unavoidable, irreversible climate damages.
“We have the fund, but we need money to make it worthwhile,” said Mohamed Adow, executive director of Power Shift Africa, a group that aims to mobilize climate action across the continent. “What we have is an empty bucket. Now we need to fill it so that support can flow to the most impacted people who are suffering right now at the hands of the climate crisis.”
Indigenous peoples around the world tell myths which contain warning signs for natural disasters. Scientists are now listening.
Native knowledge. A Moken woman stares out to sea. Photo by Taylor Weidman/LightRocket/Getty
Carrie Arnold is a freelance science writer, whose work has appeared in the Washington Post, Scientific American and Slate, among others. Her latest book is Decoding Anorexia (2012). She lives in Virginia.
Shortly before 8am on 26 December 2004, the cicadas fell silent and the ground shook in dismay. The Moken, an isolated tribe on the Andaman Islands in the Indian Ocean, knew that the Laboon, the ‘wave that eats people’, had stirred from his ocean lair. The Moken also knew what was next: a towering wall of water washing over their island, cleansing it of all that was evil and impure. To heed the Laboon’s warning signs, elders told their children, run to high ground.
The tiny Andaman and Nicobar Islands were directly in the path of the tsunami generated by the magnitude 9.1 earthquake off the coast of Sumatra. Final totals put the islands’ death toll at 1,879, with another 5,600 people missing. When relief workers finally came ashore, however, they realised that the death toll was skewed. The islanders who had heard the stories about the Laboon or similar mythological figures survived the tsunami essentially unscathed. Most of the casualties occurred in the southern Nicobar Islands. Part of the reason was the area’s geography, which generated a higher wave. But also at the root was the lack of a legacy; many residents in the city of Port Blair were outsiders, leaving them with no indigenous tsunami warning system to guide them to higher ground.
Humanity has always courted disaster. We have lived, died and even thrived alongside vengeful volcanoes and merciless waves. Some disasters arrive without warning, leaving survival to luck. Often, however, there is a small window of time giving people a chance to escape. Learning how to crack open this window can be difficult when a given catastrophe strikes once every few generations. So humans passed down stories through the ages that helped cultures to cope when disaster inevitably struck. These stories were fodder for anthropologists and social scientists, but in the past decade, geologists have begun to pay more attention to how indigenous peoples understood, and prepared for, disaster. These stories, which couched myth in metaphor, could ultimately help scientists prepare for cataclysms to come.
Anyone who has spent time around small children gets used to the question ‘why?’ Why is the sky blue? Why do birds fly? Why does thunder make such a loud noise? A friend’s mother told us that thunder was God going bowling in the sky. Nature need not be scary and unpredictable, even if it was controlled by forces we could neither see nor understand.
The human penchant for stories and meaning is nothing new. Myths and legends provide entertainment, but they also transmit knowledge of how to behave and how the world works. Breaking the code of these stories, however, takes skill. Tales of gods gone bowling during summer downpours seems nonsensical on the surface, but know a little about the sudden thunderclaps and the clatter of bowling pins as they’re struck by a ball, and the story makes sense.
In 1968, Dorothy Vitaliano, a geologist at Indiana University, pioneered the study of cultural myths that told of real geological events. Ancient Sanskrit tales told of entire cities that sunk beneath the waves with all the hallmarks of a tsunami. Plato’s story of the utopian Atlantis, destroyed by the gods in a wreckage of fire, might have referred to a volcano that partially destroyed the Greek island of Thera more than 3,500 years ago.
this story wasn’t simply a saga of angry gods but a geological record of an ancient eruption
Vitaliano published her work in a folklore journal, not a scientific one. It would take another geologist, Patrick Nunn of the University of the Sunshine Coast in Australia, to bring the field more fully into the physical sciences. Nunn’s work in the paradisiacal South Pacific gave him the opportunity to immerse himself in the islands’ traditional cultures. A group on Fiji regaled him with a story of Tanovo, the ancient chief of the Fijian island of Ono. One day, Tanovo ran across his main rival, the chief of the volcano Nabukelevu. To intimidate Tanovo, the volcano chief made Nabukelevu rise up and belch gas and burning rock into the air. Tanovo responded by weaving massive baskets to remove the mountain, dropping the debris in the ocean to create new islands. To Nunn, this story wasn’t simply a saga of angry gods but a geological record of an ancient eruption. Pressure from magma can make a volcano expand in size before the release of gas and ash. Geologists knew that small islands around Fiji were the result of volcanic rubble, but Nunn was the first geologist to hear these stories and read between the lines.
The problem was that the best geological evidence Nunn could find dated the last eruption of Nabukelevu to 50,000 years in the past, long before any humans inhabited Fiji. Nunn wrote off the tale as merely a fanciful story, and it would have remained that way if not for a new road being built near the volcano. When construction workers dug out the roadbed, they discovered pottery fragments mixed in a three-foot layer of ash. Further analysis revealed that the fragments were 3,000 years old, dating to 1,000 years after humans first arrived on Fiji.
These stories, in synch with archaeological finds, provided evidence of ‘geological events we don’t have access to any other way. There are not many examples of wholly invented myths – ancient humans were not like modern fiction writers. The point of these stories was to pass knowledge along,’ Nunn explained.
Brian McAdoo, a tsunami scientist at Yale-NUS in Singapore, began his career plumbing the depths of the ocean in high-tech submersibles to understand the earthquakes that triggered tsunamis. In 1998, a magnitude 7.1 earthquake struck off the northern coast of Papua New Guinea, triggering a tsunami estimated to have killed more than 2,000 on the island. The quake was comparatively gentle for such a deadly tsunami, which led McAdoo to begin looking at the social and cultural factors that made some geological disasters deadlier than others. His research introduced him to local tribes who told him traditional stories about earthquakes and tsunamis from the past.
‘A lot of the people we talked to said that their grandmothers would tell these stories about how their grandmothers survived a tsunami,’ McAdoo said.
As McAdoo was delving into the mysteries of Fijian stories in the southwestern Pacific, other scientists were using a similar strategy to study seismic events in the Pacific Northwest. Brian Atwater, an employee of the United States Geological Survey (USGS) in the 1970s and ’80s, was tasked with mapping the earthquake risks across Northern California, Oregon, and Washington. To do that, Atwater needed information about previous earthquakes that had struck the area. Written records dated back only about 200 years, so Atwater, now at the University of Washington in Seattle, initially relied on information that he could glean from the soil and rocks.
His work sent him into areas where native peoples had lived for thousands of years, and they told the government scientist their own myths about gods who walked the earth, stomping their feet and making the ground shake, as well as giant waves that swept over the land shortly thereafter.
In 2007, Atwater identified a massive earthquake that spawned an equally massive tsunami, decimating villages and forever altering the landscape of the Pacific Northwest. When his team dated the debris from the earthquake, he discovered it had occurred around the year 1700.
‘It was a horrible thing – the burial of a house and no doubt its occupants. It’s a really sobering experience to sift through those artefacts’
When Japanese seismologists heard of this date, they immediately contacted Atwater about a rogue tsunami that no one could explain. The Japanese, of course, were long familiar with tsunamis, having coined the word. They knew that the wall of water always followed an earthquake, and people living along the coast had learned to seek higher ground when they felt the ground start to shake. Yet in the 12th year of the Genroku era, or 1700 CE, a tsunami had hurtled itself into Japan’s eastern shore, but without an accompanying earthquake.
Modern seismologists guessed that the tsunami must have been spawned by an earthquake on the other side of the Pacific, but they couldn’t be any more specific. Atwater’s work gave them the missing information: in the Cascades, the Juan de Fuca plate dives beneath the North American plate, but it doesn’t move smoothly. The rocks get stuck, and tension builds. When the stress becomes too high, the fault ruptures and the plates move – a process that humans describe as an earthquake. Based on the precise recordings of the Japanese tsunami, the researchers provided a much more precise date for the earthquake that devastated the Pacific Northwest. Sometime around 9pm on Tuesday, 26 January 1700, a magnitude 9.0 earthquake hit as the plates violently released the stress pent up in the rocks.
‘It was a horrible thing to contemplate – the burial of a house and no doubt its occupants, as well as so many other parts of their lives. It’s a really sobering experience to sift through those artefacts,’ Atwater said.
Linking traditional Native American stories to historic records of a Japanese tsunami was considered an exception, not the start of a fruitful geological collaboration. It seemed that McAdoo, Nunn and Atwater’s explorations would be confined to the fringes of geology.
Then the 2004 tsunami struck.
A century before, a tsunami had slammed into the Indonesian island of Simeulue, killing hundreds and leaving even more homeless. The event was seared into the memory of those who survived, determined to pass their hard-earned wisdom along to their children. Their instructions were devastatingly simple: if the water recedes after an earthquake, run immediately to high ground. They didn’t invoke gods or the supernatural, but these types of warnings likely formed the kernel of later myths and traditional stories, Nunn says. During the tsunami of 2004, their efficacy was clear. On Simeulue, with a population of more than 80,000, only seven people died. Before the roar of the waves drowned out human voices, the island was filled with shouts of ‘Smong! Smong! Smong!’, the local word for a tsunami.
Such stories regularly cropped up in the weeks and months following the tsunami. Residents of remote villages knew exactly what to do and survived with relatively few casualties. As the stories gained in popularity, the idea that they had valid geological merit began to grow.
‘The 2004 tsunami completely changed how science looked at disasters. There were more conversations between social scientists, natural scientists, and engineers, which led to more insights on how and why these disasters happened,’ McAdoo said.
Most recently, a paper in Science published in August 2016 revealed geological evidence for a massive ancient flood in China that had long been rumoured to have spurred the formation of the country’s first imperial dynasty. Around 4,000 years ago, the stories go, an ‘Emperor Yu’ rose to power based on his ability to drain lowlands of flood. No one knew whether Emperor Yu was a real person or whether the floodwaters he tamed actually existed.
Yet studying the landslides in the Jishi Gorge that dammed the Yellow River high in the Tibetan plateau, a team of Chinese scientists gathered archaeological and geological evidence to demonstrate that the dams failed right around the time that China’s first dynasty emerged. The failure rerouted the Yellow River, a dynamic that could lead to persistent flooding downstream. The researchers also found evidence of large-scale drainage projects in the Yellow River delta that popped up not long after the Jishi Gorge landslides.
My personal suburban legends left me intimately familiar with what to do if I ever saw a funnel cloud
The destructive power of natural disasters hasn’t diminished in the thousands of years during which these stories were told and retold. And humanity now faces an even greater catastrophe in the form of climate change. Unlike floods, earthquakes, tsunamis and volcanoes, the devastation from global warming isn’t sudden and violent. It has been creeping up on us for decades, but that doesn’t mean it will be any less deadly. To fight these changes, humanity needs a new set of tales.
On Fiji, 25-year-old Betty Barkha is traversing her homeland to gather stories of how locals are responding to increased cyclones and flooding caused by our changing climate. These stories might not have the nail-biting drama of oral epics filled with supernatural forces, but they can connect with readers and listeners in ways that dry data from government agencies can’t.
Most humans don’t spend their evenings swapping stories around a campfire, but we haven’t lost our penchant for myth. The same summer storms caused by gods gone bowling could also generate tornadoes. As a child in the Midwest, I knew all the signs: a sky that looked like pea soup, wind that had the angry roar of an oncoming train, and the plaintive wail of a warning siren. A few years before I was born, a tornado had ripped through my town, leaving a path of debris less than a quarter mile from my home. Decades later, stories are still told of how a gas station was levelled on one side of the street but a building diagonally across was untouched. My personal suburban legends left me intimately familiar with what to do if I ever saw a funnel cloud.
Whether the disaster is earthquake, volcano or ocean wave, modern responses will likely involve cutting-edge science, but chances are we’ll also be spinning stories for aeons to come.
With global warming no longer just a threat but a full-blown crisis, Columbia experts are on the frontlines, documenting the dangers and developing solutions.
1. More scientists are investigating ways to help people adapt
Over the past half century, thousands of scientists around the world have dedicated their careers to documenting the link between climate change and human activity. A remarkable amount of this work has been done at Columbia’s Lamont-Doherty Earth Observatory, in Palisades, New York. Indeed, one of the founders of modern climate science, the late Columbia geochemist Wally Broecker ’53CC, ’58GSAS, popularized the term “global warming” and first alerted the broader scientific community to the emerging climate crisis in a landmark 1975 paper. He and other Columbia researchers then set about demonstrating that rising global temperatures could not be explained by the earth’s natural long-term climate cycles. For evidence, they relied heavily on Columbia’s world-class collections of tree-ring samples and deep-sea sediment cores, which together provide a unique window into the earth’s climate history.
Today, experts say, the field of climate science is in transition. Having settled the question of whether humans are causing climate change — the evidence is “unequivocal,” according to the UN’s Intergovernmental Panel on Climate Change (IPCC) — many scientists have been branching out into new areas, investigating the myriad ways that global warming is affecting our lives. Columbia scholars from fields as diverse as public health, agriculture, economics, law, political science, urban planning, finance, and engineering are now teaming up with climate scientists to learn how communities can adapt to the immense challenges they are likely to confront.
The University is taking bold steps to support such interdisciplinary thinking. Its new Columbia Climate School, established last year, is designed to serve as a hub for research and education on climate sustainability. Here a new generation of students will be trained to find creative solutions to the climate crisis. Its scholars are asking questions such as: How can communities best protect themselves from rising sea levels and intensifying storm surges, droughts, and heat waves? When extreme weather occurs, what segments of society are most vulnerable? And what types of public policies and ethical principles are needed to ensure fair and equitable adaptation strategies? At the same time, Columbia engineers, physicists, chemists, data scientists, and others are working with entrepreneurs to develop the new technologies that are urgently needed to scale up renewable-energy systems and curb emissions.
“The challenges that we’re facing with climate change are so huge, and so incredibly complex, that we need to bring people together from across the entire University to tackle them,” says Alex Halliday, the founding dean of the Columbia Climate School and the director of the Earth Institute. “Success will mean bringing the resources, knowledge, and capacity of Columbia to the rest of the world and guiding society toward a more sustainable future.”
For climate scientists who have been at the forefront of efforts to document the effects of fossil-fuel emissions on our planet, the shift toward helping people adapt to climate change presents new scientific challenges, as well as the opportunity to translate years of basic research into practical, real-world solutions.
“A lot of climate research has traditionally looked at how the earth’s climate system operates at a global scale and predicted how a given amount of greenhouse-gas emissions will affect global temperatures,” says Adam Sobel, a Columbia applied physicist, mathematician, and climate scientist. “The more urgent questions we face now involve how climate hazards vary across the planet, at local or regional scales, and how those variations translate into specific risks to human society. We also need to learn to communicate climate risks in ways that can facilitate actions to reduce them. This is where climate scientists need to focus more of our energy now, if we’re to maximize the social value of our work.”
A firefighter battles the Caldor Fire in Grizzly Flats, California, last summer. (Fred Greaves / Reuters)
2. Big data will enable us to predict extreme weather
Just a few years ago, scientists couldn’t say with any confidence how climate change was affecting storms, floods, droughts, and other extreme weather around the world. But now, armed with unprecedented amounts of real-time and historical weather data, powerful new supercomputers, and a rapidly evolving understanding of how different parts of our climate system interact, researchers are routinely spotting the fingerprints of global warming on our weather.
“Of course, no individual weather event can be attributed solely to climate change, because weather systems are highly dynamic and subject to natural variability,” says Sobel, who studies global warming’s impact on extreme weather. “But data analysis clearly shows that global warming is tilting the scales of nature in a way that is increasing both the frequency and intensity of certain types of events, including heat waves, droughts, and floods.”
According to the World Meteorological Organization, the total number of major weather-related disasters to hit the world annually has increased five-fold since the 1970s. In 2021, the US alone endured eighteen weather-related disasters that caused at least $1 billion in damages. Those included Hurricanes Ida and Nicholas; tropical storms Fred and Elsa; a series of thunderstorms that devastated broad swaths of the Midwest; floods that overwhelmed the coasts of Texas and Louisiana; and a patchwork of wildfires that destroyed parts of California, Oregon, Washington, Idaho, Montana, and Arizona. In 2020, twenty-two $1 billion events struck this country — the most ever.
“The pace and magnitude of the weather disasters we’ve seen over the past couple of years are just bonkers,” says Sobel, who studies the atmospheric dynamics behind hurricanes. (He notes that while hurricanes are growing stronger as a result of climate change, scientists are not yet sure if they are becoming more common.) “Everybody I know who studies this stuff is absolutely stunned by it. When non-scientists ask me what I think about the weather these days, I say, ‘If it makes you worried for the future, it should, because the long-term trend is terrifying.’”
The increasing ferocity of our weather, scientists say, is partly attributable to the fact that warmer air can hold more moisture. This means that more water is evaporating off oceans, lakes, and rivers and accumulating in the sky, resulting in heavier rainstorms. And since hot air also wicks moisture out of soil and vegetation, regions that tend to receive less rainfall, like the American West, North Africa, the Middle East, and Central Asia, are increasingly prone to drought and all its attendant risks. “Climate change is generally making wet areas wetter and dry regions drier,” Sobel says.
Flooding killed at least three hundred people in China’s Henan Province in July. (Cai Yang / Xinhua via Getty Images)
But global warming is also altering the earth’s climate system in more profound ways. Columbia glaciologist Marco Tedesco, among others, has found evidence that rising temperatures in the Arctic are weakening the North Atlantic jet stream, a band of westerly winds that influence much of the Northern Hemisphere’s weather. These winds are produced when cold air from the Arctic clashes with warm air coming up from the tropics. But because the Arctic is warming much faster than the rest of the world, the temperature differential between these air flows is diminishing and causing the jet stream to slow down and follow a more wobbly path. As a result, scientists have discovered, storm systems and pockets of hot or cold air that would ordinarily be pushed along quickly by the jet stream are now sometimes hovering over particular locations for days, amplifying their impact. Experts say that the jet stream’s new snail-like pace may explain why a heavy rainstorm parked itself over Zhengzhou, China, for three days last July, dumping an entire year’s worth of precipitation, and why a heat wave that same month brought 120-degree temperatures and killed an estimated 1,400 people in the northwestern US and western Canada.
Many Columbia scientists are pursuing research projects aimed at helping communities prepare for floods, droughts, heat waves, and other threats. Sobel and his colleagues, for example, have been using their knowledge of hurricane dynamics to develop an open-source computer-based risk-assessment model that could help policymakers in coastal cities from New Orleans to Mumbai assess their vulnerability to cyclones as sea levels rise and storms grow stronger. “The goal is to create analytic tools that will reveal how much wind and flood damage would likely occur under different future climate scenarios, as well as the human and economic toll,” says Sobel, whose team has sought input from public-health researchers, urban planners, disaster-management specialists, and civil engineers and is currently collaborating with insurance companies as well as the World Bank, the International Red Cross, and the UN Capital Development Fund. “Few coastal cities have high-quality information of this type, which is necessary for making rational adaptation decisions.”
Radley Horton ’07GSAS, another Columbia climatologist who studies weather extremes; Christian Braneon, a Columbia civil engineer and climate scientist; and Kim Knowlton ’05PH and Thomas Matte, Columbia public-health researchers, are members of the New York City Panel on Climate Change, a scientific advisory body that is helping local officials prepare for increased flooding, temperature spikes, and other climate hazards. New York City has acted decisively to mitigate and adapt to climate change, in part by drawing on the expertise of scientists from Columbia and other local institutions, and its city council recently passed a law requiring municipal agencies to develop a comprehensive long-term plan to protect all neighborhoods against climate threats. The legislation encourages the use of natural measures, like wetland restoration and expansion, to defend against rising sea levels. “There’s a growing emphasis on attending to issues of racial justice as the city develops its adaptation strategies,” says Horton. “In part, that means identifying communities that are most vulnerable to climate impacts because of where they’re located or because they lack resources. We want to make sure that everybody is a part of the resilience conversation and has input about what their neighborhoods need.”
Horton is also conducting basic research that he hopes will inform the development of more geographically targeted climate models. For example, in a series of recent papers on the atmospheric and geographic factors that influence heat waves, he and his team discovered that warm regions located near large bodies of water have become susceptible to heat waves of surprising intensity, accompanied by dangerous humidity. His team has previously shown that in some notoriously hot parts of the world — like northern India, Bangladesh, and the Persian Gulf — the cumulative physiological impact of heat and humidity can approach the upper limits of human tolerance. “We’re talking about conditions in which a perfectly healthy person could actually die of the heat, simply by being outside for several hours, even if they’re resting and drinking plenty of water,” says Horton, explaining that when it is extremely humid, the body loses its ability to sufficiently perspire, which is how it cools itself. Now his team suspects that similarly perilous conditions could in the foreseeable future affect people who live near the Mediterranean, the Black Sea, the Caspian Sea, or even the Great Lakes. “Conditions in these places probably won’t be quite as dangerous as what we’re seeing now in South Asia or the Middle East, but people who are old, sick, or working outside will certainly be at far greater risk than they are today,” Horton says. “And communities will be unprepared, which increases the danger.”
How much worse could the weather get? Over the long term, that will depend on us and how decisively we act to reduce our fossil-fuel emissions. But conditions are likely to continue to deteriorate over the next two to three decades no matter what we do, since the greenhouse gases that we have already added to the atmosphere will take years to dissipate. And the latest IPCC report states that every additional increment of warming will have a larger, more destabilizing impact. Of particular concern, the report cautions, is that in the coming years we are bound to experience many more “compound events,” such as when heat waves and droughts combine to fuel forest fires, or when coastal communities get hit by tropical storms and flooding rivers simultaneously.
“A lot of the extreme weather events that we’ve been experiencing lately are so different from anything we’ve seen that nobody saw them coming,” says Horton, who points out that climate models, which remain our best tool for projecting future climate risks, must constantly be updated with new data as real-world conditions change. “What’s happening now is that the conditions are evolving so rapidly that we’re having to work faster, with larger and more detailed data sets, to keep pace.”
Soybean yields in many parts of the world are expected to drop as temperatures rise. (Rory Doyle / Bloomberg via Getty Images)
3. The world’s food supply is under threat
“A warmer world could also be a hungry one, even in the rich countries,” writes the Columbia environmental economist Geoffrey Heal in his latest book, Endangered Economies: How the Neglect of Nature Threatens Our Prosperity. “A small temperature rise and a small increase in CO2 concentrations may be good for crops, but beyond a point that we will reach quickly, the productivity of our present crops will drop, possibly sharply.”
Indeed, a number of studies, including several by Columbia scientists, have found that staple crops like corn, rice, wheat, and soybeans are becoming more difficult to cultivate as the planet warms. Wolfram Schlenker, a Columbia economist who studies the impact of climate change on agriculture, has found that corn and soybean plants exposed to temperatures of 90°F or higher for just a few consecutive days will generate much less yield. Consequently, he has estimated that US output of corn and soybeans could decline by 30 to 80 percent this century, depending on how high average temperatures climb.
“This will reduce food availability and push up prices worldwide, since the US is the largest producer and exporter of these commodities,” Schlenker says.
There is also evidence that climate change is reducing the nutritional value of our food. Lewis Ziska, a Columbia professor of environmental health sciences and an expert on plant physiology, has found that as CO2 levels rise, rice plants are producing grains that contain less protein and fewer vitamins and minerals. “Plant biology is all about balance, and when crops suddenly have access to more CO2 but the same amount of soil nutrients, their chemical composition changes,” he says. “The plants look the same, and they may even grow a little bit faster, but they’re not as good for you. They’re carbon-rich and nutrient-poor.” Ziska says that the molecular changes in rice that he has observed are fairly subtle, but he expects that as CO2 levels continue to rise over the next two to three decades, the changes will become more pronounced and have a significant impact on human health. “Wheat, barley, potatoes, and carrots are also losing some of their nutritional value,” he says. “This is going to affect everybody — but especially people in developing countries who depend on grains like wheat and rice for most of their calories.”
Experts also worry that droughts, heat waves, and floods driven by climate change could destroy harvests across entire regions, causing widespread food shortages. A major UN report coauthored by Columbia climate scientist Cynthia Rosenzweig in 2019 described the growing threat of climate-induced hunger, identifying Africa, South America, and Asia as the areas of greatest susceptibility, in part because global warming is accelerating desertification there. Already, some eight hundred million people around the world are chronically undernourished, and that number could grow by 20 percent as a result of climate change in the coming decades, the report found.
In hopes of reversing this trend, Columbia scientists are now spearheading ambitious efforts to improve the food security of some of the world’s most vulnerable populations. For example, at the International Research Institute for Climate and Society (IRI), which is part of the Earth Institute, multidisciplinary teams of climatologists and social scientists are working in Ethiopia, Senegal, Colombia, Guatemala, Bangladesh, and Vietnam to minimize the types of crop losses that often occur when climate change brings more sporadic rainfall. The IRI experts, whose work is supported by Columbia World Projects, are training local meteorologists, agricultural officials, and farmers to use short-term climate-prediction systems to anticipate when an upcoming season’s growing conditions necessitate using drought-resistant or flood-resistant seeds. They can also suggest more favorable planting schedules. To date, they have helped boost crop yields in dozens of small agricultural communities.
“This is a versatile approach that we’re modeling in six nations, with the hope of rolling it out to many others,” says IRI director John Furlow. “Agriculture still dominates the economies of most developing countries, and in order to succeed despite increasingly erratic weather, farmers need to be able to integrate science into their decision-making.”
South Sudanese refugees gather at a camp in Uganda. (Dan Kitwood / Getty Images)
4. We need to prepare for massive waves of human migration
For thousands of years,the vast majority of the human population has lived in a surprisingly narrow environmental niche, on lands that are fairly close to the equator and offer warm temperatures, ample fresh water, and fertile soils.
But now, suddenly, the environment is changing. The sun’s rays burn hotter, and rainfall is erratic. Some areas are threatened by rising sea levels, and in others the land is turning to dust, forests to kindling. What will people do in the coming years? Will they tough it out and try to adapt, or will they migrate in search of more hospitable territory?
Alex de Sherbinin, a Columbia geographer, is among the first scientists attempting to answer this question empirically. In a series of groundbreaking studies conducted with colleagues at the World Bank, the Potsdam Institute for Climate Impact Research, New York University, Baruch College, and other institutions, he has concluded that enormous waves of human migration will likely occur this century unless governments act quickly to shift their economies away from fossil fuels and thereby slow the pace of global warming. His team’s latest report, published this fall and based on a comprehensive analysis of climatic, demographic, agricultural, and water-use data, predicts that up to 215 million people from Asia, Eastern Europe, Africa, and Latin America — mostly members of agricultural communities, but also some city dwellers on shorelines — will permanently abandon their homes as a result of droughts, crop failures, and sea-level rise by 2050.
“And that’s a conservative estimate,” says de Sherbinin, a senior research scientist at Columbia’s Center for International Earth Science Information Network. “We’re only looking at migration that will occur as the result of the gradual environmental changes occurring where people live, not massive one-time relocations that might be prompted by natural disasters like typhoons or wildfires.”
De Sherbinin and his colleagues do not predict how many climate migrants will ultimately cross international borders in search of greener pastures. Their work to date has focused on anticipating population movements within resource-poor countries in order to help governments develop strategies for preventing exoduses of their own citizens, such as by providing struggling farmers with irrigation systems or crop insurance. They also identify cities that are likely to receive large numbers of new residents from the surrounding countryside, so that local governments can prepare to accommodate them. Among the regions that will see large-scale population movements, the researchers predict, is East Africa, where millions of smallholder farmers will abandon drought-stricken lands and flock to cities like Kampala, Nairobi, and Lilongwe. Similarly, agricultural communities across Latin America, devastated by plummeting corn, bean, and coffee yields, will leave their fields and depart for urban centers. And in Southeast Asia, rice farmers and fishing families in increasingly flood-prone coastal zones like Vietnam’s Mekong Delta, home to twenty-one million people, will retreat inland.
But these migrations, if they do occur, do not necessarily need to be tragic or chaotic affairs, according to de Sherbinin. In fact, he says that with proper planning, and with input from those who are considering moving, it is even possible that large-scale relocations could be organized in ways that ultimately benefit everybody involved, offering families of subsistence farmers who would otherwise face climate-induced food shortages a new start in more fertile locations or in municipalities that offer more education, job training, health care, and other public services.
“Of course, wealthy nations should be doing more to stop climate change and to help people in developing countries adapt to environmental changes, so they have a better chance of thriving where they are,” he says. “But the international community also needs to help poorer countries prepare for these migrations. If and when large numbers of people do find that their lands are no longer habitable, there should be systems in place to help them relocate in ways that work for them, so that they’re not spontaneously fleeing droughts or floods as refugees but are choosing to safely move somewhere they want to go, to a place that’s ready to receive them.”
Temperatures have become especially dangerous in inner cities as a result of the “urban heat island” effect. (Nina Westervelt / Bloomberg via Getty Images)
5. Rising temperatures are already making people sick
One of the deadliest results of climate change, and also one of the most insidious and overlooked, experts say, is the public-health threat posed by rising temperatures and extreme heat.
“Hot weather can trigger changes in the body that have both acute and chronic health consequences,” says Cecilia Sorensen, a Columbia emergency-room physician and public-health researcher. “It actually alters your blood chemistry in ways that make it prone to clotting, which can lead to heart attacks or strokes, and it promotes inflammation, which can contribute to a host of other problems.”
Exposure to severe heat, Sorensen says, has been shown to exacerbate cardiovascular disease, asthma, chronic obstructive pulmonary disease, arthritis, migraines, depression, and anxiety, among other conditions. “So if you live in a hot climate and lack access to air conditioning, or work outdoors, you’re more likely to get sick.”
By destabilizing the natural environment and our relationship to it, climate change is endangering human health in numerous ways. Researchers at Columbia’s Mailman School of Public Health, which launched its innovative Climate and Health Program in 2010, have shown that rising temperatures are making air pollution worse, in part because smog forms faster in warmer weather and because wildfires are spewing enormous amounts of particulate matter into the atmosphere. Global warming is also contributing to food and drinking-water shortages, especially in developing countries. And it is expected to fuel transmission of dengue fever, Lyme disease, West Nile virus, and other diseases by expanding the ranges of mosquitoes and ticks. But experts say that exposure to extreme heat is one of the least understood and fastest growing threats.
“Health-care professionals often fail to notice when heat stress is behind a patient’s chief complaint,” says Sorensen, who directs the Mailman School’s Global Consortium on Climate and Health Education, an initiative launched in 2017 to encourage other schools of public health and medicine to train practitioners to recognize when environmental factors are driving patients’ health problems. “If I’m seeing someone in the ER with neurological symptoms in the middle of a heat wave, for example, I need to quickly figure out whether they’re having a cerebral stroke or a heat stroke, which itself can be fatal if you don’t cool the body down quickly. And then I need to check to see if they’re taking any medications that can cause dehydration or interfere with the body’s ability to cool itself. But these steps aren’t always taken.”
Sorensen says there is evidence to suggest that climate change, in addition to aggravating existing medical conditions, is causing new types of heat-related illnesses to emerge. She points out that tens of thousands of agricultural workers in Central America have died of an enigmatic new kidney ailment that has been dubbed Mesoamerican nephropathy or chronic kidney disease of unknown origin (CKDu), which appears to be the result of persistent heat-induced inflammation. Since CKDu was first observed among sugarcane workers in El Salvador in the 1990s, Sorensen says, it has become endemic in those parts of Central America where heat waves have grown the most ferocious.
“It’s also been spotted among rice farmers in Sri Lanka and laborers in India and Egypt,” says Sorensen, who is collaborating with physicians in Guatemala to develop an occupational-health surveillance system to spot workers who are at risk of developing CKDu. “In total, we think that at least fifty thousand people have died of this condition worldwide.”
Heat waves are now also killing hundreds of Americans each year. Particularly at risk, experts say, are people who live in dense urban neighborhoods that lack trees, open space, reflective rooftops, and other infrastructure that can help dissipate the heat absorbed by asphalt, concrete, and brick. Research has shown that temperatures in such areas can get up to 15°F hotter than in surrounding neighborhoods on summer days. The fact that these so-called “urban heat islands” are inhabited largely by Black and Latino people is now seen as a glaring racial inequity that should be redressed by investing in public-infrastructure projects that would make the neighborhoods cooler and safer.
“It isn’t a coincidence that racially segregated neighborhoods in US cities are much hotter, on average, than adjacent neighborhoods,” says Joan Casey, a Columbia epidemiologist who studies how our natural and built environments influence human health. In fact, in one recent study, Casey and several colleagues showed that urban neighborhoods that lack green space are by and large the same as those that in the 1930s and 1940s were subject to the racist practice known as redlining, in which banks and municipalities designated minority neighborhoods as off-limits for private lending and public investment. “There’s a clear link between that history of institutionalized racism and the subpar public infrastructure we see in these neighborhoods today,” she says.
Extreme heat is hardly the only environmental health hazard faced by residents of historically segregated neighborhoods. Research by Columbia scientists and others has shown that people in these areas are often exposed to dirty air, partly as a result of the large numbers of trucks and buses routed through their streets, and to toxins emanating from industrial sites. But skyrocketing temperatures are exacerbating all of these other health risks, according to Sorensen.
“A big push now among climate scientists and public-health researchers is to gather more street-by-street climate data in major cities so that we know exactly where people are at the greatest risk of heat stress and can more effectively advocate for major infrastructure upgrades in those places,” she says. “In the meantime, there are relatively small things that cities can do now to save lives in the summer — like providing people free air conditioners, opening community cooling centers, and installing more water fountains.”
Workers install solar panels on the roof of a fish-processing plant in Zhoushan, China. (Yao Feng / VCG via Getty Images)
6. We’re curbing emissions but need to act faster
Since the beginning ofthe industrial revolution, humans have caused the planet to warm 1.1°C (or about 2°F), mainly by burning coal, oil, and gas for energy. Current policies put the world on pace to increase global temperatures by about 2.6°C over pre-industrial levels by the end of the century. But to avoid the most catastrophic consequences of climate change, we must try to limit the warming to 1.5°C, scientists say. This will require that we retool our energy systems, dramatically expanding the use of renewable resources and eliminating nearly all greenhouse-gas emissions by mid-century.
“We’ll have to build the equivalent of the world’s largest solar park every day for the next thirty years to get to net zero by 2050,” says Jason Bordoff, co-dean of the Columbia Climate School. A leading energy-policy expert, Bordoff served on the National Security Council of President Barack Obama ’83CC. “We’ll also have to ramp up global investments in clean energy R&D from about $2 trillion to $5 trillion per year,” he adds, citing research from the International Energy Agency. “The challenge is enormous.”
Over the past few years, momentum for a clean-energy transition has been accelerating. In the early 2000s, global emissions were increasing 3 percent each year. Now they are rising just 1 percent annually, on average, with some projections indicating that they will peak in the mid-2020s and then start to decline. This is the result of a variety of policies that countries have taken to wean themselves off fossil fuels. European nations, for example, have set strict limits on industrial emissions. South Africa, Chile, New Zealand, and Canada have taken significant steps to phase out coal-fired power plants. And the US and China have enacted fuel-efficiency standards and invested in the development of renewable solar, wind, and geothermal energy — which, along with hydropower, account for nearly 30 percent of all electricity production in the world.
“It’s remarkable how efficient renewables have become over the past decade,” says Bordoff, noting that the costs of solar and wind power have dropped by roughly 90 percent and 70 percent, respectively, in that time. “They’re now competing quite favorably against fossil fuels in many places, even without government subsidies.”
But in the race to create a carbon-neutral global economy, Bordoff says, the biggest hurdles are ahead of us. He points out that we currently have no affordable ways to decarbonize industries like shipping, trucking, air travel, and cement and steel production, which require immense amounts of energy that renewables cannot yet provide. “About half of all the emission reductions that we’ll need to achieve between now and 2050 must come from technologies that aren’t yet available at commercial scale,” says Bordoff.
In order to fulfill the potential of solar and wind energy, we must also improve the capacity of electrical grids to store power. “We need new types of batteries capable of storing energy for longer durations, so that it’s available even on days when it isn’t sunny or windy,” he says.
Perhaps the biggest challenge, Bordoff says, will be scaling up renewable technologies quickly enough to meet the growing demand for electricity in developing nations, which may otherwise choose to build more coal- and gas-fueled power plants. “There are large numbers of people around the world today who have almost no access to electricity, and who in the coming years are going to want to enjoy some of the basic conveniences that we often take for granted, like refrigeration, Internet access, and air conditioning,” he says. “Finding sustainable ways to meet their energy needs is a matter of equity and justice.”
Bordoff, who is co-leading the new Climate School alongside geochemist Alex Halliday, environmental geographer Ruth DeFries, and marine geologist Maureen Raymo ’89GSAS, is also the founding director of SIPA’s Center on Global Energy Policy, which supports research aimed at identifying evidence-based, actionable solutions to the world’s energy needs. With more than fifty affiliate scholars, the center has, since its creation in 2013, established itself as an intellectual powerhouse in the field of energy policy, publishing a steady stream of definitive reports on topics such as the future of coal; the potential for newer, safer forms of nuclear energy to help combat climate change; and the geopolitical ramifications of the shift away from fossil fuels. One of the center’s more influential publications, Energizing America, from 2020, provides a detailed roadmap for how the US can assert itself as an international leader in clean-energy systems by injecting more federal money into the development of technologies that could help decarbonize industries like construction, transportation, agriculture, and manufacturing. President Joe Biden’s $1 trillion Infrastructure Investment and Jobs Act, signed into law in November, incorporates many of the report’s recommendations, earmarking tens of billions of dollars for scientific research in these areas.
“When we sat down to work on that project, my colleagues and I asked ourselves: If an incoming administration wanted to go really big on climate, what would it do? How much money would you need, and where exactly would you put it?” Bordoff says. “I think that’s one of our successes.”
Which isn’t to say that Bordoff considers the climate initiatives currently being pursued by the Biden administration to be sufficient to combat global warming. The vast majority of the climate-mitigation measures contained in the administration’s first two major legislative packages — the infrastructure plan and the more ambitious Build Back Better social-spending bill, which was still being debated in Congress when this magazine went to press — are designed to reward businesses and consumers for making more sustainable choices, like switching to renewable energy sources and purchasing electric vehicles. A truly transformative climate initiative, Bordoff says, would also discourage excessive use of fossil fuels. “Ideally, you’d want to put a price on emissions, such as with a carbon tax or a gasoline tax, so that the biggest emitters are forced to internalize the social costs they’re imposing on everyone else,” he says.
Bordoff is a pragmatist, though, and ever mindful of the fact that public policy is only as durable as it is popular. “I think the American people are more divided on this than we sometimes appreciate,” he says. “Support for climate action is growing in the US, but we have to be cognizant of how policy affects everyday people. There would be concern, maybe even outrage, if electric or gas bills suddenly increased. And that would make it much, much harder to gain and keep support during this transition.”
Today, researchers from across the entire University are working together to pursue a multitude of strategies that may help alleviate the climate crisis. Some are developing nanomaterials for use in ultra-efficient solar cells. Others are inventing methods to suck CO2 out of the air and pump it underground, where it will eventually turn into chalk. Bordoff gets particularly excited when describing the work of engineers at the Columbia Electrochemical Energy Center who are designing powerful new batteries to store solar and wind power. “This is a team of more than a dozen people who are the top battery experts in the world,” he says. “Not only are they developing technologies to create long-duration batteries, but they’re looking for ways to produce them without having to rely on critical minerals like cobalt and lithium, which are in short supply.”
In his own work, Bordoff has recently been exploring the geopolitical ramifications of the energy transition, with an eye toward helping policymakers navigate the shifting international power dynamics that are likely to occur as attention tilts away from fossil fuels in favor of other natural resources.
But he believes the best ideas will come from the next generation of young people, who, like the students in the Climate School’s inaugural class this year, are demanding a better future. “When I see the growing sense of urgency around the world, especially among the younger demographics, it gives me hope,” he says. “The pressure for change is building. Our climate policies don’t go far enough yet, so something is eventually going to have to give — and I don’t think it’s going to be the will and determination of the young people. Sooner or later, they’re going to help push through the more stringent policies that we need. The question is whether it will be in time.”
As more frequent and more severe storms erode coastlines, mapmakers must adapt quickly.
A shrinking swath of coastline in Washington state has a regrettable nickname: Washaway Beach. It’s named not for what’s there, but rather for what isn’t. Insatiable Pacific Ocean currents have taken greedy bites out of the land over the past century.
Washaway Beach’s disappearing shore isn’t measured in centimeters or inches. You can’t track the changes with a hardware store measuring stick. Residents of the area, roughly two and a half hours southwest of Seattle, are watching their homes and businesses get swallowed by the sea at an average rate of 100 feet per year; that’s about the height of a 10-story building. It’s the fastest-eroding place in the western United States.
Washaway Beach is an extreme case of erosion. Many factors contribute to its rapid decline. But the quickening march of climate change, including rising sea levels and more frequent and severe storms, poses a growing threat to coastal communities everywhere.
I’ve never been to Washaway Beach. I’m hearing about it for the first time from Peter Doucette, the acting director for the Earth Resources Observation and Science Center at the US Geological Survey. Doucette is showing me over Zoom a colorful animated map of how the community changed between 1985 and 2017. The water eats away at the map’s multicolored patches. The brown beaches, red developed areas and light blue freshwater bogs evaporate in the Pacific’s 32-year sprint to wipe out the town. It’s jarring to watch how quickly the land dissolves into the deep blue as the ocean takes over.
Scientists didn’t have the tech to visualize changes like this even five or 10 years ago, though they had the data. “This is the power of using the data from time; it’s taking advantage of the time dimension, which requires a lot of computing power … but we have that now,” Doucette explains.
Faster satellites, sharper images taken in near real-time and advanced computing techniques are making it possible for mapmakers to redraw Washaway Beach as soon as coastal changes occur. Emerging technologies will help scientists predict what could happen to it in the future, just like a weather report.
For coastal residents around the world, or anyone living in an area susceptible to extreme weather events, this type of mapping could save lives. Up-to-date maps can provide crucial information for first responders needing to traverse areas hit by natural disasters; residents and visitors need regular, ongoing updates to adapt to a changing landscape.
For anyone living in areas less directly affected by the climate crisis, maps that show change over time provide a crucial bridge to understanding what’s really happening in other places, and how quickly.
“By helping people visualize how the world is changing, maybe that will give them a better understanding of climate change as a whole,” says Tanya Harrison, director of science strategy at Planet, a private satellite imagery company. “How is your neighborhood being affected? How is your grandmother’s house being affected? Maybe she lives on the other side of the country or the other side of the world. In a way, that can kind of make this a little bit more personal.”
From clay tablets to satellites
Maps aren’t easy to define. They’re squishy things, molded by the minds of the people who create them. Imperfect representations of our world. One part art; one part science.
Still, they give us a baseline for decision-making, whether it’s finding the closest coffee shop, climbing a mountain or helping people understand something more serious, like climate change.
“[Maps are] such a great intuitive way to gather information and humans are really good at understanding spatial information presented in that way,” says Mike Tischler, director of the National Geospatial Program at the US Geological Survey. “You want to know what’s over the ridge, you want to know what’s around the bend, you want to know where things are.” That’s probably why maps have been around for thousands of years.
A clay tablet known as the Babylonian Map of the World, or Imago Mundi, is the oldest known map of the world. It was discovered in Iraq and dates back to about 600 B.C.
The Babylonian Map of the World is the oldest map of the world. The Trustees of the British Museum
Modern mapmaking got its start in 1852, when French army officer Aimé Laussedat created the first maps with photographs. Laussedat also experimented with aerial photography, sticking cameras on kites and balloons. As air travel became more sophisticated, aerial photography transitioned from balloons to planes in World War I and World War II and, eventually, to satellites in the 1970s.
Nowadays, aerial photography is more automated than it was when ground crews launched unsteady balloons into the air, hoping to get the right shots. Hundreds or thousands of images are taken automatically from planes and satellites to make maps. Now planes and satellites visit the same place regularly, reliably showing how land changes over time.
“Land change is really complex. … Tying it to climate, I’m not sure we’re there yet,” says Jesslyn Brown, research geographer for the Earth Resources Observation and Science Center at the US Geological Survey. You can’t identify patterns that could point to climate change without monitoring the same places at regular intervals.
“This might be a little controversial, but my opinion is that governments don’t find monitoring very sexy,” Brown says. “But it’s an absolute necessity because you can’t manage what you can’t measure, so we need to take these measurements in order to have the information to monitor the Earth and to monitor the effects of climate change.”
Chasing change
In the US, Landsat is the best-known Earth-observing satellite for monitoring and mapping purposes. Landsat 7 and Landsat 8 circle the globe once every 99 minutes, traveling at 17,000 miles per hour. Each satellite covers the entire planet in 16 days. Together, they cover the Earth in eight days because they’re in reverse orbit.
The satellites are “roughly the size of a small school bus,” says Doucette, the USGS director who showed me the map of Washaway Beach, and have a 30-meter resolution, “about the size of a baseball diamond per pixel.”
Generations of Landsat satellites have been doing this since 1972. That 50-year record makes it extremely valuable for tracking changes over time.
“[50 years of data] provides researchers the ability to go back through time and monitor what kinds of changes are going on on the land surface,” Doucette says. “That really wasn’t possible until just the last five to 10 years with the big data compute capabilities that have become available.”
This image of the Himalayan Mountains is one of the first shots taken by Landsat 9. NASA
NASA launched its newest satellite, Landsat 9, on Sept. 27. Soon, it will hand over control of Landsat 9 to the USGS. Then, Landsat 7, which has been orbiting the planet for 22 years, will be retired. Most old Landsat satellites go into “disposal orbits,” destined to circle the planet until they eventually reenter the atmosphere and burn up. Landsat 7 won’t have the same fate; it will be moved into a different orbit to help test NASA’s robotic refueling project, Doucette explains.
Landsat is still the gold standard for satellite imagery, says Terry Sohl, acting branch chief for the Integrated Science and Applications Branch and research scientist at the USGS Earth Resources Observation and Science Center. “To be honest, I’m not sure that’s going to be the case in five years,” Sohl adds.
Private satellite companies are making it easier than ever to visualize changes worldwide almost as soon as they happen for much less money than Landsat.
Smaller, faster, cheaper, sharper
“If you’ve got a satellite right now that covers the Earth every two weeks, you can have homes and cities destroyed in that time,” says Tischler, the USGS director of the National Geospatial Program. Private companies are sending larger numbers of tiny satellites into orbit that cost less to build, launch and operate, have very high-resolution cameras and cover more ground more quickly.
One of the private companies, Planet, has two different types of satellites: Dove and Sky satellites. The 180 Dove satellites are the size of a loaf of bread; they orbit the globe every 90 minutes and have a three- to five-meter resolution, or about 10 to 16 feet.
Fifteen of the Sky satellites orbit at the poles like the Dove satellites. The remaining six Sky satellites orbit at latitudes closer to where people live to capture images of cities. Combined, the Sky satellites orbit Earth 12 times per day. Sky satellites are about the size of a dishwasher and have a resolution of just 50 centimeters, or a little over a foot and a half. They capture details that Landsat’s baseball-diamond-size resolutions can’t.
Smaller satellites are cheaper, too. It costs about a billion dollars to design, build, test and deploy one Landsat satellite. One Planet satellite costs in the “low hundreds of thousands of dollars,” although the company wouldn’t say exactly how much.
Having a lot of smaller satellites also makes it easier for the San Francisco-based team to build them locally and experiment with new technologies quickly.
“If there’s something new that comes to the market that could lead to better image quality … we have the option to just switch that out in-house where we’re actually building the satellites in the basement of our headquarters in San Francisco and just say, ‘Hey, let’s put in a new sensor. Let’s launch that,'” says Harrison, Planet’s director of science strategy.
That way, if they want to test something, they can try it on one satellite and see how it works, without having to update all 200 satellites in their fleet.
Its various satellites have observed many events related to the climate crisis all over the world. The most significant changes they’ve seen have taken place in the coldest regions.
In July 2020, Planet satellites captured the collapse of the last intact Arctic ice shelf. “That was obviously a big tragedy. It’s not the kind of thing that you want to see, but it’s something that we managed to capture,” Harrison says.
Seeing is believing
Newer satellites are giving us more data, more quickly. Advancements in computing are changing how mapmakers use that data to show how our planet is changing right now and how it could change in the future.
Doucette is showing me another map now, this time a projection of what the land near Lubbock, Texas, will look like decades from now. At some point, the Ogallala Aquifer, which supports cotton and other key crops in the region, is going to dry up. Scientists at the USGS worked with other government agencies to create forecasts of Lubbock between 2014 and the end of the century, drawing from Landsat data, socio-economic data and climate data.
The map shows the cotton crop disappearing in tandem with the Ogallala’s water. The projections will vary based on how water usage continues, so scientists create best, middle and worst case scenarios because of the uncertainty.
“Climate is actually much more predictable than people. I don’t worry about the variability in a climate scenario; I worry about the variability of how people behave,” says Sohl, the USGS scientist. “There are all these things that happen that are just so totally unpredictable, like a new government policy that can have a huge impact on the landscape.”
What happens when the Ogallala Aquifer runs out of water? NOAA
Either way, the Ogallala’s water will disappear and it isn’t coming back.
Knowing this in advance gives people in Lubbock time to shift to other types of crops that don’t depend so heavily on water. Doucette suggests dryland wheat or returning the area to grassland.
“This is how we hope to use Landsat and other related Earth observation data so we can understand the causes of change in the past that kind of help us develop these models for projecting potential change going into the future,” Doucette says.
Historic data from Landsat combined with sharper-resolution imagery from private satellite companies equips mapmakers to show climate change impacts now and model what could happen to the same areas decades or even centuries from now. “[Landsat and private satellite companies] really [are] a nice mix of where we’re going in the future,” says Sohl.
As Washaway Beach’s erosion cuts further into inland Washington state, the freshwater cranberry bogs the area is known for are increasingly threatened with contamination from salt water. But with these technologies, scientists can look at the models and make decisions before Washaway Beach, the Ogallala Aquifer and other places like them fall off the map.
“Imagine being able to do this kind of projection … and doing it on a national scale or even a global scale,” Doucette adds. “That’s our hope; this is still kind of cutting-edge research.”
Earth’s annual average temperature checkup can mask a lot of the details of the climate record over the previous year, and 2021 showed that deadly heat-related climate extremes happen, even if it’s not a record-warm year.
Global average temperature isn’t always the most important measure, University of Michigan climate scientist Jonathan Overpeck said, after United States federal agencies released the Global State of the Climate report, ranking 2021 as the sixth-warmest year on record for the planet.
“As with politics, it is often what happens locally that matters most, and 2021 was one of the most deadly and destructive years on record because of the unusually warm atmosphere that is becoming the norm,” he said. “Extreme heat waves were exceptional in 2021, including the deadly Pacific Northwest U.S. and Canada heatwave that killed hundreds and also set the stage for fires that wiped out a whole town.”
Last year, the climate “was metaphorically shouting to us to stop the warming, because if we don’t, the warming-related climate and weather extremes will just get worse and worse, deadlier and deadlier,” he said. “Even tornadoes are now thought to strengthen as a result of the warming, and this effect probably also was the reason we had tornadoes in 2021 that reached northward into parts of Minnesota for the first time ever in December.”
The Pacific Northwest heat wave was the most extreme hotspot in a series of heat extremes that together seemed to stretch across the entire northern hemisphere for much of the summer, said Chloe Brimicome, a climate scientist and heat expert at the University of Reading.
“What really stood out for me was this period in summer, in July,” she said. “Everywhere you looked, consecutive records in many countries for temperature were being broken, day on day on day. I don’t think we’d ever really seen that before, or at least we hadn’t heard about it in the same way before.”
July 2021 ended up being the single hottest month for Earth since measurements started, and on the ninth day of the month, a thermometer at Furnace Creek, in California’s Death Valley, recorded 54.4 degrees Celsius (130 degrees Fahrenheit) for the second year in a row, in what could stand as the highest reliably measured temperature on record.
Near the end of July, a heat wave disrupted Tokyo Olympic Games scheduling, and less than two weeks later, on Aug. 11, a Syracuse, Sicily weather station measured Europe’s warmest-ever temperature, at 48.8 degrees Celsius (119.8 Fahrenheit), during Europe’s hottest summer on record. A few days after that, it rained at the summit of the two-mile thick Greenland Ice Sheet for the first time on record, yet another sign that pervasive warming is affecting the whole globe.
Brimicome said that, with last year’s heat extremes, it hit home that, “Oh dear, this has already started, it’s catching up with us, it’s here now.”
She added, ”We’re going to see more and more of this sort of extreme heat and extreme weather. It wasn’t a shock because that’s what had been projected, but a surprise, because it had always kind of crept up on us.”
Ocean Heat Peaks Again
The reports released Thursday by the National Oceanic and Atmospheric Administration and NASA show that increasing greenhouse gas pollution has driven Earth’s annual average temperature above the pre-fossil fuel era by 1.04 degrees Celsius (1.87 degrees Fahrenheit), as measured by an 1880 to 1900 baseline. And the long-term rate of warming has doubled in recent decades, from an early pace of about 0.08 degrees Celsius (0.14 degrees Fahrenheit) per decade, to 0.18 degrees Celsius (0.32 degrees Fahrenheit) per decade since 1980.
Based on the most recent evaluations of greenhouse gas emissions and concentrations, especially of methane, which recently reached another record level, as well as studies of other important climate indicators, warming could speed up even more in the years ahead. By 2023, the global annual temperature could pass the 1.5 degree Celsius warming limit set by the Paris Agreement, climate scientist James Hansen wrote in his Jan. 11 monthly climate update.
A separate study, published last week, showed that, while the planet’s globally averaged surface temperature has wobbled the past six years, the world’s oceans continued to warm steadily during that time, setting a new record each year, including 2021. That matters a lot for the climate because more than 90 percent of the sun’s heat trapped by greenhouse gases is going into the oceans, said Kevin Trenberth, a distinguished scholar at the National Center for Atmospheric Research and a co-author of the study.
“The ocean is where most of it goes,” he said. “If you’re tracking that over time, we should be able to match that with measurements from satellites. That would be the best indicator of total energy imbalance for the planet.”
By another measure, that energy imbalance is growing at a rate equivalent to the energy from about five Hiroshima-sized atom bombs exploding every second of every day of every year, all captured by the oceans. Manifesting as heat, the energy melts sea ice and ice shelves, raises sea levels and supercharges tropical storms.
And there is no doubt that ocean heat waves are linked with heat waves and drought over land. A 2020 study showed that heat waves and droughts starting over the ocean and moving over land are often longer lasting and more intense than purely land-born events. In another case, a team of researchers studied ecosystem details of how a 2011 ocean and land heat wave interacted over Australia.
Concerns about faster warming ahead are also heightened because warmer oceans are less able to take up carbon dioxide from the atmosphere. Currently, oceans absorb about 25 percent to 30 percent of human carbon dioxide emissions, said Lijing Cheng, lead author of the new ocean heat paper and associate professor with the International Center for Climate and Environmental Sciences at the Institute of Atmospheric Physics of the Chinese Academy of Sciences.
That leads to ocean acidification and “reduces the efficiency of oceanic carbon uptake and leaves more carbon dioxide in the air,” which traps even more heat, he said.
Cheng said the study showed that the pattern of ocean warming “is a result of human-related changes in atmospheric composition,” adding that warmer oceans create more powerful storms and hurricanes, “as well as increasing precipitation and flood risk.”
Fully understanding ocean-atmosphere heat exchange is key to implementing and tracking climate mitigation goals, he added.
Co-author Michael Mann, a climate scientist at Pennsylvania State University, said the oceans will keep warming until net carbon emissions fall to zero.
“Aside from causing coral bleaching and threatening sea life and fish populations we rely upon for roughly 25 percent of our protein intake globally,” Mann said, ocean warming “is destabilizing Antarctic ice shelves and threatens massive (meters) of sea level rise if we don’t act. So this finding really underscores the urgency of climate action now.”
Record Heat in 25 Countries
Another global annual climate summary from a team of scientists with the Berkeley Earth laboratory showed that 1.8 billion people in 25 countries—about a quarter of the world’s population—experienced a record-warm annual average in 2021.
“No one lives at the global average temperature,” said Berkeley Earth lead scientist Robert Rohde. “Most land areas will experience more warming than the global average, and countries must plan their responses to this.”
Some of the world’s most populous countries experienced their hottest years on record, including China, South Korea and Nigeria, and many of them are countries that are already very hot, including Bahrain, Iran, Kuwait, Oman, Qatar, Saudi Arabia and the United Arab Emirates in the Middle East.
Overall, the Berkeley team’s data showed that the global warming caused by greenhouse gases is broadly distributed, as expected, because the pollutants are spread through the atmosphere.
In 2021, 87 percent of Earth’s surface was significantly warmer compared to a 1951-1980 baseline, with 11 percent of the surface at a similar temperature, and only 2.6 percent significantly colder. An absence of cold extremes also illustrates the overall warming trend, as the team reported that no place on Earth recorded a record cold annual average.
A building level of greenhouse gases from human activities “is the direct cause of recent global warming,” Rohde said. “If the Paris Agreement’s goal of no more than 2 degrees Celsius warming is to be reached, significant progress toward reducing greenhouse gas emissions needs to be made soon.”
Brimicome, who does research on extreme heat, said the spate of climate extremes in 2021 may mark a start of a widespread coming to terms with climate change.
“I think we’ve always had these rose-tinted glasses toward it, like yes, climate change is happening, but it’s not going to happen to me,” she said. “We need to take off those glasses and be realistic about what’s happening. Although part of our brain is telling us it can’t be true, it is completely in front of us. If we continue with this narrative, even like I did, that we’re surprised and shocked, it’s kind of like saying it’s not real. But it is real.”
Can you imagine turning on the Weather Channel to get an update on Storm 34B-SQ59? While major storms aren’t sentient beings, it’s become standard to give them human names to make it easier to communicate about them, especially during critical news updates. From Hurricane Elsa to Tropical Storm Cristobal, there’s an intriguing legacy behind naming storms.
The History of Naming Storms
A few hundred years ago, storms were named after the Catholic saint’s day that lined up with the storm. For example, Hurricane Santa Ana landed in Puerto Rico on July 26, 1825. But if storms hit on the same day in different years, names doubled up. Hurricane San Felipe I struck Puerto Rico on September 13, 1876 and then San Felipe II hit in 1928.
In the late 19th century, Australian meteorologist Clement Wragge began using women’s names for tropical storms. The practice was adopted by the U.S. Navy and Air Force during World War II when latitude and longitude identifications proved to be too cumbersome.
Outside of the military, early 20th century storms were named and tracked by the year and order, with names such as “1940 Hurricane Two” and “1932 Tropical Storm Six.” This created some confusion when multiple storms were happening during the same time, especially during news broadcasts. To reduce confusion, United States weather services also began using female names for storms in 1953, and later added male names to the list in 1978. This began the modern version of how we name storms.
Who Is in Charge of Storm Names?
Although NOAA’s (National Oceanic and Atmospheric Administration) National Hurricane Center is the premier source for news about storms, this organization does not name them. Instead, the World Meteorological Organization does. The WMO is a specialized agency of the United Nations, headquartered in Switzerland, that focuses on weather, climate, and water resources. Each year, the WMO creates a list of potential names for the upcoming storm season.
Where Do the Names Come From?
There is a bit of an art to naming modern-day storms. The WMO compiles six lists of names for each of the three basins under its jurisdiction: Atlantic, Eastern North Pacific, and Central North Pacific. Countries outside of this jurisdiction have their own naming conventions. For areas within the WMO, such as the United States, storm names are cycled through every six years. That means that the list of names for the 2021 season will be used again in 2027.
Each list contains 21 names that begin with a different letter of the alphabet (minus Q, U, X, Y, Z because of the limited number of names). For the Atlantic basin, names are typically chosen from English, French, and Spanish, because the countries impacted primarily speak one of those three languages. While the names are supposedly random, there are some pop culture-related coincidences, such as 2021’s Hurricane Elsa.
When Is a Storm Named?
A tropical storm can be named once it meets two criteria: a circular rotation and wind speeds more than 39 MPH. Once a storm reaches 74 MPH, it becomes a hurricane but keeps the same name it was first given as a tropical storm, such as when Tropical Storm Larry turned into Hurricane Larry in September 2021.
Hurricane names can also be retired, and this is often done when a hurricane is especially destructive. As of the 2020 season, there are 93 names on the retired Atlantic hurricane list, including 2004’s Katrina, 2012’s Sandy, and 2016’s Matthew. When a name is retired, it is replaced with a new name.
New Rules in 2021
Before the 2021 season, if the full list of storm names was used before the end of the season, any additional storms that reached the necessary criteria for naming would use the Greek alphabet — Alpha, Beta, Gamma, etc. There were 30 named storms in 2020, only the second time the full list of names had been used.
As of 2021, the WMO will use a supplementary list of names, similar to the original list (starting with Adria and ending with Will). The WMO felt that the Greek names were too distracting. From a technical perspective, the Greek names could also not be replaced in a way that made sense if they were retired (such as Eta and Iota in 2020).
O que o surgimento da internet, os ataques de 11 de setembro de 2001 e a crise econômica de 2008 têm em comum?
Foram eventos extremamente raros e surpreendentes que tiveram um forte impacto na história.
Acontecimentos deste tipo costumam ser chamados de “cisnes negros”.
Alguns argumentam que a recente pandemia de covid-19 também pode ser considerada um deles, mas nem todo mundo concorda.
A “teoria do cisne negro” foi desenvolvida pelo professor, escritor e ex-operador da bolsa libanês-americano Nassim Taleb em 2007.
E possui três componentes, como o próprio Taleb explicou em um artigo no jornal americano The New York Times no mesmo ano:
– Em primeiro lugar, é algo atípico, já que está fora do âmbito das expectativas habituais, porque nada no passado pode apontar de forma convincente para sua possibilidade.
– Em segundo lugar, tem um impacto extremo.
– Em terceiro lugar, apesar de seu status atípico, a natureza humana nos faz inventar explicações para sua ocorrência após o fato em si, tornando-o explicável e previsível.
A tese de Taleb está geralmente associada à economia, mas se aplica a qualquer área.
E uma vez que as consequências costumam ser catastróficas, é importante aceitar que a ocorrência de um evento”cisne negro” é possível — e por isso é necessário ter um plano para lidar com o mesmo.
Em suma, o “cisne negro” representa uma metáfora para algo imprevisível e muito estranho, mas não impossível.
Por que são chamados assim?
No fim do século 17, navios europeus embarcaram na aventura de explorar a Austrália.
Em 1697, enquanto navegava nas águas de um rio desconhecido no sudoeste da Austrália Ocidental, o capitão holandês Willem de Vlamingh avistou vários cisnes negros, sendo possivelmente o primeiro europeu a observá-los.
Como consequência, Vlamingh deu ao rio o nome de Zwaanenrivier (Rio dos Cisnes, em holandês) por causa do grande número de cisnes negros que havia ali.
Tratava-se de um acontecimento inesperado e novo. Até aquele momento, a ciência só havia registrado cisnes brancos.
A primeira referência conhecida ao termo “cisne negro” associado ao significado de raridade vem de uma frase do poeta romano Décimo Júnio Juvenal (60-128).
Desesperado para encontrar uma esposa com todas as “qualidades certas” da época, ele escreveu em latim que esta mulher era rara avis in terris, nigroque simillima cygno (“uma ave rara nestas terras, como um cisne negro”), detalha o dicionário de Oxford.
Porque naquela época e até cerca de 1,6 mil anos depois, para os europeus, não existiam cisnes negros.
Prevendo os ‘cisnes negros’
Um grupo de cientistas da Universidade de Stanford, nos Estados Unidos, está trabalhando para prever o imprevisível.
Ou seja, para se antecipar aos “cisnes negros” — não às aves, mas aos estranhos eventos que acontecem na história.
Embora sua análise primária tenha sido baseada em três ambientes diferentes na natureza, o método computacional que eles criaram pode ser aplicado a qualquer área, incluindo economia e política.
“Ao analisar dados de longo prazo de três ecossistemas, pudemos demonstrar que as flutuações que ocorrem em diferentes espécies biológicas são estatisticamente iguais em diferentes ecossistemas”, afirmou Samuel Bray, assistente de pesquisa no laboratório de Bo Wang, professor de bioengenharia na Universidade de Stanford.
“Isso sugere que existem certos processos universais que podemos utilizar para prever esse tipo de comportamento extremo”, acrescentou Bray, conforme publicado no site da universidade.
Para desenvolver o método de previsão, os pesquisadores procuraram sistemas biológicos que vivenciaram eventos “cisne negro” e como foram os contextos em que ocorreram.
Eles se basearam então em ecossistemas monitorados de perto por muitos anos.
Os exemplos incluíram: um estudo de oito anos do plâncton do Mar Báltico com níveis de espécies medidos duas vezes por semana; medições de carbono de um bosque da Universidade de Harvard, nos EUA, que foram coletadas a cada 30 minutos desde 1991; e medições de cracas (mariscos), algas e mexilhões na costa da Nova Zelândia, feitas mensalmente por mais de 20 anos, detalha o estudo publicado na revista científica Plos Computational Biology.
Os pesquisadores aplicaram a estas bases de dados a teoria física por trás de avalanches e terremotos que, assim como os “cisnes negros”, mostram um comportamento extremo, repentino e de curto prazo.
A partir desta análise, os especialistas desenvolveram um método para prever eventos “cisne negro” que fosse flexível entre espécies e períodos de tempo e também capaz de trabalhar com dados muito menos detalhados e mais complexos.
Posteriormente, conseguiram prever com precisão eventos extremos que ocorreram nesses sistemas.
Até agora, “os métodos se baseavam no que vimos para prever o que pode acontecer no futuro, e é por isso que não costumam identificar os eventos ‘cisne negro'”, diz Wang.
Mas este novo mecanismo é diferente, segundo o professor de Stanford, “porque parte do pressuposto de que estamos vendo apenas parte do mundo”.
“Extrapola um pouco do que falta e ajuda enormemente em termos de previsão”, acrescenta.
Então, os “cisnes negros” poderiam ser detectados em outras áreas, como finanças ou economia?
“Aplicamos nosso método às flutuações do mercado de ações e funcionou muito bem”, disse Wang à BBC News Mundo, serviço de notícias em espanhol da BBC, por e-mail.
Os pesquisadores analisaram os índices Nasdaq, Dow Jones Industrial Average e S&P 500.
“Embora a principal tendência do mercado seja o crescimento exponencial de longo prazo, as flutuações em torno dessa tendência seguem as mesmas trajetórias e escalas médias que vimos nos sistemas ecológicos”, explica.
Mas “embora as semelhanças entre as variações na bolsa e ecológicas sejam interessantes, nosso método de previsão é mais útil nos casos em que os dados são escassos e as flutuações geralmente vão além dos registros históricos (o que não é o caso do mercado de ações)”, adverte Wang.
Por isso, temos que continuar atentos para saber se o próximo “cisne negro” vai nos pegar de surpresa… ou talvez não.
por Ricardo Abramovay – 13/08/2021 às 15:32 – Atualizado 13/08/2021 às 20:06
Relatório da ONU aponta: frear a crise climática exigirá novo paradigma ecológico e de bem-estar, que se sobreponha ao cálculo econômico. Um dos entraves será a indústria do cimento, altamente poluidora, que prepara novo boom da construção
Projeto “+1,5ºC Muda Tudo” , entre o Museu do Prado e a WWF, que atualiza obras clássicas sob a catástrofe climática
Nada indica que os mais importantes tomadores de decisão do planeta estejam preparados para enfrentar o horizonte traçado nesta semana pelo relatório do Painel Intergovernamental de Mudanças Climáticas (IPCC, na sigla em inglês), que analisa a evolução e as perspectivas da relação entre as sociedades humanas e o sistema climático do qual a vida na Terra depende. Uma das mais importantes e promissoras conclusões do relatório é que ainda existe uma estreita janela de oportunidades para que a temperatura global média não suba além de 1,5ºC até o final do século.
Mas esta janela converte-se numa quase invisível fresta quando o mais importante jornal de economia do mundo, o Financial Times, retrata o entusiasmo de Jan Jenisch, presidente do maior grupo produtor global de cimento (Holcin), com o que ele chama de boom da construção, em função das necessidades de infraestrutura dos países em desenvolvimento. Sua alegria é compartilhada por Fernando Gonzales, o CEO da Cemex mexicana que fala em superciclo da construção.
O curioso é que a informação do Financial Times aparece num podcast do jornal, logo antes de um comentário sobre as enchentes na Alemanha e na China e a quebra de recorde de aumento de temperatura na América do Norte, sem que se faça qualquer relação entre cimento e eventos climáticos extremos. Ora, se fosse um país, o setor de cimento seria o terceiro maior emissor global. E não se pode dizer que o setor não esteja atento a seus impactos sobre o sistema climático.
Em 2021, cada tonelada de cimento é produzida com emissões 18% menores do que três décadas antes, mostra um trabalho do CarbonBrief. Neste período, porém, a demanda de cimento no mundo triplicou. O resultado é que, apesar dos avanços tecnológicos do setor, suas emissões continuam subindo.
O recente relatório conjunto da Agência Internacional de Energia e do Conselho Global de Negócios para o Desenvolvimento Sustentável (WBCSD, na sigla em inglês) corrobora esta informação. Até 2050, a produção global de cimento deve aumentar 12%, mas suas emissões crescem “somente” 4%. O relatório do IPCC lançado esta semana faz com que esta inegável conquista (emitir menos por unidade produzida) se converta tragicamente em componente decisivo da crise climática.
O cimento aqui é tomado como um exemplo que atinge o conjunto da vida econômica. Os dados do Painel Internacional de Recursos das Nações Unidas são claros a este respeito: as emissões vindas da produção de materiais (metais, madeira, construção e plástico, sem incluir combustíveis fósseis e alimentos) dobraram entre 1995 e 2016 e passaram de 15% a 23% das emissões globais. E, da mesma forma que no cimento, os avanços técnicos para descarbonizar a oferta de ferro, aço, plástico e borracha foram imensos.
Se a este quadro se acrescentam os planos de ampliação da produção de petróleo e mesmo de carvão e as emissões derivadas da agropecuária no mundo todo, a conclusão é que tanto as estratégias empresariais quanto os planos governamentais de combate à crise climática estão muito aquém da urgência colocada pelo relatório do IPCC. É o que explica a afirmação de Cristiana Figueres, que dirigiu a Convenção Quadro das Nações Unidas sobre Mudanças Climáticas e foi uma das responsáveis pelo Acordo de Paris de 2015, numa entrevista após a divulgação do relatório do IPCC: “Nós não estamos à altura do desafio de nosso tempo… Estamos ainda promovendo melhorias marginais e os tempos apelam para mudança drástica”.
O relatório do IPCC terá alcançado o objetivo de desencadear esta mudança drástica sob duas condições. A primeira é que cada cidadão e cada consumidor encare a crise climática contemporânea com a seriedade e a urgência que enfrentou a pandemia. É fundamental que a economia propicie bem-estar, conforto e condições para que as pessoas e suas comunidades floresçam, mas se não formos capazes de fazer escolhas orientadas pelas mensagens que o IPCC nos está transmitindo o resultado é que simplesmente não haverá futuro.
Neste sentido, enfrentar a crise climática consiste, antes de tudo, em combater as desigualdades, ou seja, em utilizar os recursos de que dispomos sob a orientação gandhiana de que o mundo é capaz de satisfazer as necessidades humanas, mas não o luxo, o desperdício e a cobiça. Nosso bem-estar tem que depender, cada vez mais, de bens comuns, de solidariedade, de sentido comunitário, de empatia e de cooperação social.
Nesta dimensão coletiva do bem-estar se fundamenta o vínculo entre combate à crise climática e sentimento democrático. Sociedades que cultivam o individualismo e a ideia de que a ascensão social é um esforço que depende estritamente das pessoas e não de suas relações comunitárias dificilmente terão condições de enfrentar a crise climática.
A segunda condição para que possamos nos aproximar do que Cristiana Figueres chamou de “mudança drástica” é que tanto as políticas econômicas como as decisões empresariais passem a se nortear por uma pergunta central: como isso vai impactar a relação entre sociedade e natureza e, especialmente, as mudanças climáticas? A urgência atual não permite mais que este tema seja encarado como “externo” à vida econômica, como uma espécie de consequência não antecipada, não prevista de nossas atividades e que será corrigida em algum momento. A luta contra a crise climática tem que estar no cerne da gestão econômica pública e privada.
União Europeia, China, Estados Unidos, Japão, Índia e inúmeras organizações empresariais dão claros sinais de que estão ao menos iniciando medidas nesta direção. A distância entre esta agenda e a dos fanáticos fundamentalistas que estão no Palácio do Planalto e na Esplanada dos Ministérios não poderia ser maior. No centro da luta para superar as ameaças que pesam sobre a democracia brasileira agora e no ano que vem está a mudança radical que Cristiana Figueres preconiza e que exige uma vida econômica que regenere os tecidos sociais, e naturais que até aqui tem acompanhado sistematicamente nossa oferta de bens e serviços.
Nives Dolsak and Aseem Prakash – Aug 14, 2021,08:29pm EDT
The recent IPCC report is a grim reminder of the seriousness of the climate crisis. The wildfires in the Western United States and Canada, the zombie fires in Siberia, heatwaves in Southern Europe and the Pacific Northwest, and floods in Germany and China should motivate aggressive climate action.
Disasters are supposed to focus policy attention, which political scientist John Kingdon described as opening the “policy window.” As “focusing events,” drastic weather episodes could create opportunities to enact new climate policies. But, of course, a lot depends on the skill of policy entrepreneurs. As Rahm Immanuel had famously noted, politicians should not allow a serious crisis to go to waste.
And yet, climate policy seems to be losing steam. The U.S. Senate has substantially slashed Biden’s proposal for new climate spending. China continues to build coal-fired electricity plants. Brazil has announced a plan to support its coal industry.
And to top it all, Jake Sullivan, U.S. National Security Advisor, is imploring OPEC countries to pump more oil! The White House press release notes: “President Biden has made clear that he wants Americans to have access to affordable and reliable energy, including at the pump.” Yes, one can smell 2022 mid-term elections because Democrats do not want to be held responsible for high gas prices, a highly emotive pocketbook issue. However, these statements cause enormous policy confusion about Biden’s commitment to making tough choices on climate issues. If zero emissions are to be achieved by 2050, the White House should allow the prices to rise. Moreover, if Biden supports increasing oil supply abroad, why is he opposing it in the U.S., as Texas Governor Greg Abbott noted?
Models of Policy Change
There are different pathways to policy change. The “information deficit” model suggests that policy change is hampered when policy elites do not have sufficient information. Once these elites are “educated” and there is an “epistemic consensus,” policy change takes place. With easy accessibility to well-written and carefully crafted IPCC reports, it is difficult to accept that policy elites lack information about climate change. Perhaps, what is taking place is “motivated reasoning”: individuals seek information that coheres with their prior beliefs and leads them to their desired conclusions. This means that policy elites are not empty vessels waiting to be nourished by the nectar of new knowledge. Instead, they seek information that they want to hear. Information deficit explanations do not work well in highly polarized political contexts.
Political explanations begin with the premise that most policy institutions favor the status quo. This is partly due to the institutional design (such as the Senate Filibuster) that many democracies deliberately adopt to prevent concentration of power. But sometimes, dramatic events can shatter the status quo, as elites begin to rethink their priorities. If political entrepreneurs can stitch together a coalition, policy change can happen. And sometimes, even without policy windows opening up, these entrepreneurs can create policies that can appeal to multiple constituencies. After all, Baptists and Bootleggers came together to push for prohibition. Politics, rather than the lack of scientific information, is probably leading to policy sluggishness.
Why is Climate Policy Stalling?
Additional issues are also contributing to climate policy lethargy. Humans have a limited attention span. Climate issues are getting neglected because the policy space is getting crowded by new and sensational non-climate issues. Taliban’s rapid advance in Afghanistan is stunning, and its aftermath is most disturbing. Western countries are in a panic mode to evacuate embassies with “Saigon type” exit from Kabul. The Afghanistan crisis is creating a new wave of refugees seeking safety in Europe, abetting a nationalist backlash. The debate on “who lost Afghanistan” will probably dominate the U.S. policy discourse with the usual blame game.
Closer to home, the resurgence of COVID and the debate about masks and vaccines are igniting political passions. School and college reopening controversy will probably take a chunk of policy space and attention span.
Other dramatic issues will make demands on the attention span as well: crime waves in many cities (the top issue in the New York Mayoral race), the Cuomo scandal, and Newsom’s recall.
Is there Hope on the Climate Front?
The good news is that the renewable energy industry is growing despite COVID-induced recession. A key reason is that the prices of both solar and wind are now competitive with coal. This means that electric utilities will deploy their political muscle to get favorable renewable policies at the state level. For example, the legislature in a Red state such as Indiana has prohibited county governments from using zoning ordinances against renewable energy.
The automobile industry seems to be pushing EVs as well. Although the Senate’s $1.2 trillion infrastructure plan has provided only $7.5 billion for E.V. charging stations (as opposed to $15 billion Biden had asked for), the automobile industry and electric utilities (with their massive new investments in renewables) are now getting locked into a new technological trajectory . This means that they have strong incentives to create a national charging station network.
Although the federal government may be underperforming on climate issues, the private sector has embraced them. Wall Street also seems to be keeping pace with Main Street and the Silicon Valley. Of course, one might view industry’s newfound love for Environmental-Social-Governance (ESG) issues as hype, simply replacing Corporate Social Responsibility (CSR). It remains to be seen if climate leaders such as BlackRock can bring about measurable change in corporate policies on climate issues.
In sum, the climate policy optimism of the first 100 days of the Biden administration seems to be wearing off. This is disturbing because Republicans are expected to retake the House (and possibly the Senate as well) in the 2022 midterm elections. Thus, the window of opportunity to enact aggressive federal climate policy is slowly closing. Climate policy requires vigorous political entrepreneurship to bring about policy change in the next 12 months.
“A atividade humana está alterando o clima da Terra de maneira ‘sem precedentes’ em centenas de milhares de anos, com algumas mudanças já inevitáveis e ‘irreversíveis’, alertaram cientistas do clima.”
“Países atrasaram tanto a contenção de emissões de combustíveis fósseis que já não podem mais interromper a intensificação do aquecimento global pelos próximos 30 anos, ainda que exista uma janela para prevenir o futuro mais angustiante, concluiu um grande relatório científico da ONU.”
“Pela primeira vez, os cientistas do IPCC (sigla em inglês para Painel Intergovernamental de Mudança do Clima da ONU) quantificaram em um relatório o aumento da frequência e da intensidade dos eventos extremos ligados às mudanças climáticas.”
Se é pelo dedo que se conhece o gigante, os primeiros parágrafos do noticiário mais importante do ano sobre a crise do clima mostra como o assunto está longe de um senso comum. As três aberturas acima foram cometidas por, respectivamente, The Guardian, The New York Times e Folha. A diferença de tom não é pequena: o apocalipse está próximo para o diário britânico; políticos precisam acordar antes que seja tarde segundo o americano; a ciência mostra que algo ocorre, diz o brasileiro.
Carvall
O destaque da notícia nos três jornais também apresentou muitas diferenças. Valendo-se do fuso horário, o Times deu a notícia como manchete na edição impressa de segunda-feira (9) e manteve o assunto na capa no dia seguinte. O tratamento no site foi semelhante. O Guardian apurou o conteúdo do relatório com políticos e ONGs e adiantou que o tom do alerta seria grave já no domingo. Deu duas manchetes seguidas no impresso e 12 títulos em seu site apenas na segunda, além de um vídeo.
A Folha foi bem mais econômica. Resolveu a questão em três textos. No site, na segunda de manhã, o assunto não aparecia nem no primeiro scroll, a parte de cima da Home Page, mais nobre e de maior audiência. Onde estava, a chamada tinha peso parecido com o dado para uma nota sobre venda de Porsches no Brasil. O título principal dizia apenas que a “crise climática já agrava secas, tempestades e temperaturas”.
Em crítica interna. este ombudsman observou que o tratamento não condizia com o tamanho da notícia e que a comparação com a mídia internacional e até com concorrentes locais não era favorável. O destaque aumentou um pouco nas horas seguintes e a palavra “irreversível” foi acrescida ao enunciado original.
Na terça, em seu impresso, a Folha preferiu dar manchete para o desfile militar no bananal de Jair Bolsonaro. Clima virou um título, na parte debaixo da Primeira Página, em uma coluna. O Bolsa Família reloaded do presidente candidato mereceu duas colunas. Há, é claro, problemas em demasia no país, mas a opção da Folha restou entre as exceções em um dia importante.
Dos concorrentes diretos O Globo e O Estado de S.Paulo aos grandes jornais de Estados Unidos, Reino Unido e Europa, incluindo os econômicos The Wall Street Journal e Financial Times, todas as manchetes foram ocupadas pelo documento do IPCC. Com ou sem alarmismo, mas refletindo corretamente a amplitude do problema, a dimensão da notícia.
Leitores reclamaram. Alguns em tom ativista, cobrando da Folha comprometimento com a causa ambiental. Outros com pura preocupação, aquela que se sente diante do noticiário já quase diário de incêndios florestais, ondas de calor, inundações e secas pelo planeta. O temor que várias cidades brasileiras já sentem diante do racionamento de água. E o que vamos sentir todos daqui a pouco diante da falta de energia se o governo federal mantiver a incompetência de hábito.
No meio de tudo isso, surgiu um prenúncio de mudança. O jornal, na terça, padronizou que os eventos extremos devem ser tratados preferencialmente como “crise do clima”. Na quarta, porém, mais uma revolta se instalou na caixa de entrada. Leandro Narloch, de volta à Folha, repetiu argumentos negacionistas para falar de “aquecimento global” em sua coluna de reestreia.
Leitores furiosos listaram as polêmicas que cercam o jornalista conservador. Chamaram-no de homofóbico e racista. Pediram sua demissão, anunciaram o cancelamento de assinaturas do jornal e do UOL.
O episódio reforça as contradições da Folha na cobertura do clima. Sua brava equipe de Ciência faz excelente trabalho, tem bons analistas e cobertura consistente da Amazônia, mas isso é pouco para enfrentar um desafio multidisciplinar.
Crise climática precisa virar real prioridade, pauta que se impõe ao público pelo simples fato de que ela irá se impor de qualquer maneira. Não é mais questão de acreditar ou não em cientistas ou de pirralhas anunciando o fim do mundo.
O país está na berlinda na questão ambiental. A Folha não precisa ficar junto.
The latest landmark climate science report goes much further than previous ones in providing estimates of how bad things might get as the planet heats up, even if a lack of data may mean it underestimates the perils.
Scientists have used the seven years since the previous assessment report of the Intergovernmental Panel of Climate Change (IPCC) to narrow the uncertainties around major issues, such as how much the planet will warm if we double atmospheric levels of carbon dioxide and other greenhouse gases.
While temperatures have risen largely in lockstep with rising CO2, this IPCC report examines in much more detail the risks of so-called abrupt changes, when relatively stable systems abruptly and probably irreversibly shift to a new state.
Michael Mann, director of the Pennsylvania State University’s Earth System Science and one of the world’s most prominent climate researchers, says the models are not capturing all the risks as the climate heats up.
Running AMOC
Perhaps the most prominent of these threats is a possible stalling of the Atlantic Meridional Overturning Circulation (AMOC). Also known as the Gulf Stream, it brings tropic water north from the Caribbean, keeping northern Europe much warmer than its latitude might otherwise suggest, and threatening massive disruptions if it slows or stops.
“Where the models have underestimated the impact is with projections of ice melt, the AMOC, and – I argue in my own work – the uptick on extreme weather events,” Professor Mann tells the Herald and The Age.
Stefan Rahmstorf, head of research at the Potsdam Institute for Climate Impact Research, agrees that climate models have not done a good job of reproducing the so-called cold blob in the subpolar Atlantic that is forming where melting Greenland ice is cooling the subpolar Atlantic.
Breaking up: The US Coast Guard Icebreaker Healy on a research cruise in the Chukchi Sea of the Arctic Ocean. Credit:AP
If they are not picking that blob up, “should we trust those models on AMOC stability?” Professor Rahmstorf asks.
The IPCC’s language, too, doesn’t necessarily convey the nature of the threat, much of which will be detailed in the second AR6 report on the impacts of climate change, scheduled for release next February.
“Like just stating the AMOC collapse by 2100 is ‘very unlikely’ – that was in a previous report – it sounds reassuring,” Professor Rahmstorf said. “Now the IPCC says they have ‘medium confidence’ that it won’t happen by 2100, whatever that means.”
West Antarctica has enough ice to raise global sea levels by more than 3 metres if it melts.Credit:Ian Joughin
West Antarctic melt
Another potential tipping point is the possible disintegration of the West Antarctic ice sheet. Much of the sheet lies below sea level and as the Southern Ocean warms, it will melt causing it to “flow” towards the sea in a process that is expected to be self-sustaining.
This so-called marine ice sheet instability is identified in the IPCC report as likely resulting in ice mass loss under all emissions scenarios. There is also “deep uncertainty in projections for above 3 degrees of warming”, the report states.
Containing enough water to lift sea levels by 3.3 metres, it matters what happens to the ice sheet. As Andrew Mackintosh, an ice expert at Monash University, says, the understanding is limited: “We know more about the surface of Mars than the ice sheet bed under the ice.”
Permafrost not so permanent
Much has been made about the so-called “methane bomb” sitting under the permafrost in the northern hemisphere. As the Arctic has warmed at more than twice the pace of the globe overall, with heatwaves of increasing intensity and duration, it is not surprising that the IPCC has listed the release of so-called biogenic emissions from permafrost thaw as among potential tipping points.
These emissions could total up to 240 gigatonnes of CO2-equivalent which, if released, would add an unwanted warming boost.
The IPCC lists as “high” the probability of such releases during this century, adding there is “high confidence” that the process is irreversible at century scales.
“In some cases abrupt changes can occur in Earth System Models but don’t on the timescales of the projections (for example, an AMOC collapse),” said Peter Cox, a Professor of Climate System Dynamics at the UK’s University of Exeter. “In other cases the processes involved are not yet routinely included in ESMs [such as] CO2 and methane release from deep permafrost.”
“In the latter cases IPCC statements are made on the basis of the few studies available, and are necessarily less definitive,” he said.
Other risks
From the Amazon rainforest to the boreal forests of Russia and Canada, there is a risk of fire and pests that could trigger dieback and transform those regions.
Australia’s bush faces an increased risk of bad fire weather days right across the continent, the IPCC notes. How droughts, heatwaves and heavy rain and other extreme events will play out at a local level is also not well understood.
Ocean acidification and marine heatwaves also mean the world’s coral reefs will be much diminished at more than 1.5 degrees of warming. “You can kiss it goodbye as we know it,” says Sarah Perkins-Kirkpatrick, a climate researcher at the University of NSW, said.
Global monsoons, which affect billions of people including those on the Indian subcontinent, are likely to increase their rainfall in most parts of the world, the IPCC said.
Andy Pitman, director of the ARC Centre of Excellence for Climate Extremes, said policymakers need to understand that much is riding on these tipping points not being triggered as even one or two of them would have long-lasting and significant effects. “How lucky do you feel?” Professor Pitman says.
The Biggest uncertainty
Christian Jakob, a Monash University climate researcher, said that while there remain important uncertainties, science is honing most of those risks down.
Much harder to gauge, though, is which emissions path humans are going to take. Picking between the five scenarios ranging from low to high that we are going to choose is “much larger than the uncertainty we have in the science,” Professor Jakob said.
O impacto do aumento da temperatura média na Terra é planetário, com elevação do nível do mar e alteração de ecossistemas inteiros, entre outras mudanças.
Alterações regionais do clima, com maior frequência de eventos extremos, já são percebidas e se intensificarão nos próximos anos, com consequências diretas na saúde de todos.
No Brasil, alguns estados conviverão com mais dias de calorão, que podem ser prejudiciais à saúde a ponto de provocar a morte de idosos.
Em outros, chuvas intensas se tornarão mais recorrentes, ocasionando inundações que aumentam o risco de doenças, quando não destroem bairros e cidades.
Por fim, as secas também devem ficar mais intensas, o que pode agravar problemas respiratórios.
Além disso, tanto as chuvas intensas quanto as secas prejudicam lavouras, aumentando o preço dos alimentos.
Um exemplo prático de aumento de temperatura está no Sudeste e no Sul do Brasil. Segundo o cenário mais otimista do IPCC, até 2040 os dias com termômetros acima de 35°C passarão de 26 por ano (média de 1995 a 2014) para 32. Num cenário intermediário, até o final do século esse número pode chegar a 43, um aumento de mais de 65% em relação à situação recente.
No Centro-Oeste, o aumento do calorão é ainda mais severo. No cenário intermediário, do IPCC, a média de 53 dias por ano com termômetros acima de 35°C salta para cerca de 72 até 2040 e para 108 até o fim do século, ou pouco mais de um trimestre de temperatura extrema.
As consequências para a saúde são graves. Ondas de calor extremo podem causar hipertermia, que afeta os órgãos internos e provoca lesões no coração, nas células musculares e nos vasos sanguíneos. São danos que podem levar à morte.
Homem empurra carrinho com frutas em rua inundada em Manaus, que enfrentou, nos últimos meses, a maior cheia já registrada do rio Negro – Michael Dantas/AFP
Em junho, uma onda de calor nos estados de Oregon e Washington, nos Estados Unidos, custou a vida de centenas de pessoas. Segundo reportagem do jornal The New York Times, foram registrados cerca de 600 óbitos em excesso no período.
Além do calor, a crise do clima deve tornar mais frequentes os períodos de seca e os dias sem chuva em muitas regiões. É o caso da Amazônia.
Dados do IPCC apontam que, na região Norte, no período 1995-2014 eram em média 43 dias consecutivos sem chuva por ano, que podem aumentar para 51, com períodos 10% mais secos até 2040.
Situação similar deve ocorrer no Centro-Oeste, que tinha 69 dias consecutivos sem chuva por ano, que podem ir a 76, com períodos 13% mais secos.
Períodos mais secos nessas regiões preocupam por causa das queimadas. Na Amazônia, por exemplo, a época sem chuvas é associada à intensificação de processos de desmatamento e de incêndios.
As queimadas na região amazônica têm relação com piora da qualidade do ar e consequentes problemas respiratórios. A Fiocruz e a ONG WWF-Brasil estimam que estados amazônicos com índices elevados de queimadas tenham gastado, em dez anos, quase R$ 1 bilhão com hospitalizações por doenças respiratórias provavelmente relacionadas à fumaça dos incêndios.
No ano passado, o Pantanal passou por sua pior seca dos últimos 60 anos, estiagem que ainda pode continuar por até cinco anos, segundo afirmou à época a Secretaria Nacional de Proteção e Defesa Civil. A situação fez explodir o número de queimadas na região.
O IPCC também aponta aumento da frequência e da intensidade de chuvas extremas e enchentes em diversas regiões do Brasil.
Além dos danos óbvios na infraestrutura das cidades, as inundações provocam problemas de saúde. Hepatite A (transmitida de modo oral-fecal, ou seja, por alimentos e água contaminada) e leptospirose (com transmissão a partir do contato com urina de ratos) são suspeitos conhecidos, mas há também o risco de acidentes com animais peçonhentos, já que cobras e escorpiões podem procurar abrigos dentro das casas.
Manaus tornou-se exemplo recente desse tipo de situação. A cidade enfrentou uma cheia histórica, a maior desde o início das medições, há 119 anos. As águas do rio Negro provocaram inundações com duração superior a um mês na principal capital da região amazônica. Seis das dez maiores cheias já registradas no rio ocorreram no século 21, ou seja, nas últimas duas décadas.
Ruas da região do porto de Manaus tiveram que ser interditadas e foi necessária a construção de passarelas sobre as vias alagadas. Enquanto isso, comerciantes fizeram barreiras com sacos de areia e jogaram cal na água parada para tentar neutralizar o cheiro de fezes.
Em meio à inundação em igarapés, houve acúmulo de lixo, que chegou a cobrir toda a área superficial da água. Dentro das casas, moradores usaram plataformas de madeira (chamadas de marombas) para suspender móveis e eletrodomésticos.
As enchentes não são exclusividade amazônica. Elas também ocorrem na região Sudeste, em São Paulo e Rio de Janeiro, por exemplo.
Pouco tempo depois da cheia em Manaus, a Europa também viu chuvas intensas concentradas em um curto espaço de tempo causarem inundações severas, principalmente na Alemanha. Além da destruição de vias públicas e imóveis, houve mais de uma centena de mortes.
Também no mesmo período, a China teve que lidar com grandes precipitações e perda de vidas humanas pelas inundações, que chegaram a encher de água o metrô, deixando pessoas presas. Foram as piores chuvas em 60 anos em Zhengzhou, capital da província de Henan.
Em termos globais, um estudo recente apontou o aumento da população exposta a inundações. De 2000 a 2015, de 255 milhoes a 290 milhões de pessoas foram diretamente afetadas por enchentes.
Segundo Lincoln Alves, pesquisador do Inpe (Instituto Nacional de Pesquisas Espaciais) e autor-líder do Atlas do IPCC, a ferramenta pretende facilitar o acesso a informações normalmente complexas. “É visível a mudança do clima”, afirma o pesquisador.
A partir do Atlas, diz Alves, é possível que comunidades, empresas e até esferas do governo consigam olhar de forma mais regional para os efeitos da crise do clima.
A ferramenta permite ver a história climática da Terra e observar as projeções para diferentes variáveis em diferentes cenários de emissões —e de aquecimento, como 1,5°C e 2°C— apontados pelo IPCC.
PRINCIPAIS CONCLUSÕES DO RELATÓRIO DO IPCC
Aumento de temperatura provocada pelo ser humano desde 1850-1900 até 2010-2019: de 0,8°C a 1,21°C
Os anos de 2016 a 2020 foram o período de cinco anos mais quentes de 1850 a 2020
De 2021 a 2040, um aumento de temperatura de 1,5°C é, no mínimo, provável de acontecer em qualquer cenário de emissões
A estabilização da temperatura na Terra pode levar de 20 a 30 anos se houver redução forte e sustentada de emissões
O oceano está esquentando mais rápido —inclusive em profundidades maiores do que 2.000 m— do que em qualquer período anterior, desde pelo menos a última transição glacial. É extremamente provável que as atividades humanas sejam o principal fator para isso
O oceano continuará a aquecer por todo o século 21 e provavelmente até 2300, mesmo em cenários de baixas emissões
O aquecimento de áreas profundas do oceano e o derretimento de massas de gelo tende a elevar o nível do mar, o que tende a se manter por milhares de anos
Nos próximos 2.000 anos, o nível médio global do mar deve aumentar 2 a 3 metros, se o aumento da temperatura ficar contido em 1,5°C. Se o aquecimento global ficar contido a 2°C, o nível deve aumentar de 2 a 6 metros. No caso de 5°C de aumento de temperatura, o mar subirá de 19 a 22 metros
A crise climática é uma crise de direitos humanos, cujas emergências já estão afetando de maneira desproporcional os países mais vulneráveis e os grupos sociais mais discriminados e marginalizados, aprofundando desigualdades.
É isso o que indica o relatório “Parem de Queimar Nossos Direitos”, lançado nesta sexta-feira (13) globalmente pela Anistia Internacional.
O documento detalha como emergências climáticas têm consequências injustas entre países, entre diferentes populações e entre gerações e de que maneira elas comprometem a garantia de uma série de direitos fundamentais, como o direito à vida, à água, à alimentação, à moradia, à saúde, ao trabalho e à autodeterminação, entre outros.
O primeiro e mais elementar desses direitos é a face mais evidente e trágica da escalada de emergências climáticas que tomaram o noticiário ao longo do último ano. Tempestades devastadoras, recorde de furacões, ondas de calor e incêndios sem precedentes mataram pessoas da Austrália à Alemanha, passando por Bahamas, China e Canadá.
Segundo o documento, mais de 20 milhões de pessoas foram deslocadas internamente, em média, a cada ano entre 2008 e 2019 por causa de eventos relacionados ao clima. Parte desses eventos afetou a vida de milhões de pessoas ao destruir plantações e casas e queimar florestas e cidades inteiras, além de secar rios. O Brasil, por exemplo, vive a pior estiagem dos últimos 91 anos, o que compromete o abastecimento da população e o fornecimento de energia elétrica.
O Painel Intergovernamental sobre Mudanças Climáticas (IPCC) estimou que manter o aumento da temperatura média global em 1,5°C, e não em 2°C, resultaria na proteção de 420 milhões de pessoas em relação a ondas de calor extremas e na redução de 50% no número de pessoas expostas ao estresse hídrico induzido pelo clima, além de diminuir o risco de inundações costeiras.
“As autoridades públicas no Brasil têm contribuído para que haja um desmonte da agenda ambiental, mas não há mais espaço para o negacionismo. A vida de brasileiros e brasileiras deve vir em primeiro lugar”, explica Jurema Werneck, diretora executiva da Anistia Internacional Brasil.
Segundo Werneck, os Estados têm obrigações legais de enfrentar a crise do clima, de acordo com a normativa internacional dos direitos humanos. “Exigimos que o governo do presidente Jair Bolsonaro e o Congresso Nacional ajam para atenuar os efeitos das mudanças climáticas sobre a população brasileira e implementem políticas públicas de conservação da natureza e proteção dos direitos humanos.”
Para ela, o governo do Brasil não está fazendo o que é preciso para enfrentar a crise climática. “Muito pelo contrário, temos visto decisões equivocadas, perigosas e muita negligência. O governo não se coloca ao lado da proteção do ambiente natural nem dos sujeitos de grupos populacionais como indígenas, quilombolas e moradores das periferias das cidades para mitigar e superar os impactos da crise climática.”
Embora as mudanças climáticas sejam um fenômeno global, elas atingem países pobres e em desenvolvimento de maneira desproporcional, o que configura um aspecto injusto desse fenômeno.
O relatório afirma que os países e blocos que mais emitiram CO2 na história —EUA, União Europeia, China, Rússia e Japão— têm uma responsabilidade histórica e precisam agir em seu território e no exterior, mas não são os únicos que devem responder ao imperativo de mudanças.
“Para resolver essa crise, que é global, é preciso que a responsabilidade de agir seja compartilhada por todos e todas. Todos os países precisam fazer alguma coisa urgente, sejam os países mais ricos do mundo, sejam aqueles em desenvolvimento, como o Brasil, sejam os países mais pobres do mundo. Todo mundo tem o que fazer, todo mundo deve fazer. Se omitir nesse momento é extremamente violador dos direitos humanos”, afirma a diretora-executiva da Anistia no Brasil.
Neste sentido, o relatório da organização aponta que a omissão de países em tomar medidas audaciosas para enfrentar a crise do clima é, em si, uma violação de direitos humanos porque tem impactos concretos sobre direitos com um escopo ainda maior que outros tipos de violações.
Isso porque, além do desequilíbrio entre nações, os efeitos das emergências climáticas também estão ligados às desigualdades e privilégios de parcelas da população mundial.
De acordo com o relatório da Anistia, de 1990 a 2015, os 10% mais ricos da população mundial (cerca de 630 milhões de pessoas) foram responsáveis por mais da metade das emissões acumuladas de carbono, enquanto os 50% mais pobres (cerca de 3,1 bilhões de pessoas) foram responsáveis por apenas 7% das emissões acumuladas.
Estudos já identificaram que existem recortes étnicos, raciais e de gênero nas pessoas mais afetadas, entre elas, mulheres, pessoas negras e povos indígenas, além de outros grupos que vivem em moradias mais precárias, em localidades de risco ou em áreas mais expostas à poluição e menos servidas de saneamento, por exemplo.
Por isso, ao mesmo tempo que o relatório convoca os países a reduzir drasticamente a queima de combustíveis fósseis e a acelerarem suas transições para matrizes energéticas limpas, a Anistia chama a atenção para a necessidade de cuidar das pessoas mais vulneráveis. Para tanto, recomenda a criação de mecanismos de financiamento internacional para que se adote medidas de mitigação da crise e de adaptação das populações a emergências climáticas.
Além disso, de acordo com a ONG, esses projetos de mitigação e de adaptação muitas vezes ocorrem em contextos de violação de direitos, seja no campo do trabalho ou da alimentação, no caso das monoculturas de biocombustíveis.
“Há uma profunda injustiça permeando toda essa crise climática. Porque é uma minoria das pessoas do mundo e dos países do mundo que produzem um excesso de gases de efeito estufa, que estão na origem da crise climática. E são aqueles que são excluídos e marginalizados que já estão pagando o preço mais alto dessa crise”, avalia Werneck.
“Portanto, a resposta à crise precisa ser coordenada e ter enfoque em direitos humanos. Precisa garantir que as medidas de reparação e de correção de rota sejam rápidas, mas também sejam justas.”
Na sua opinião, o que aconteceu nos últimos cem anos com o número total de mortes causadas por furacões, inundações, secas, ondas de calor e outros desastres climáticos? Peço que escolha uma destas alternativas:
a) Aumentou mais de 800%
b) Aumentou cerca de 50%
c) Manteve-se constante
d) Diminuiu cerca de 50%
e) Diminuiu mais de 80%
Como a população mundial cresceu de 1,8 bilhão em 1921 para 8 bilhões em 2021, é razoável cravar as respostas B ou C, pois o fato de haver mais pessoas resultaria em mais vítimas. Muitos leitores devem ter escolhido a primeira opção, tendo em vista as notícias assustadoras do relatório do IPCC desta semana.
A alternativa correta, porém, é a última. As mortes por desastres naturais diminuíram 87% desde a década de 1920 até os anos 2010, segundo dados coletados pelo Our World in Data.
Passaram de 540 mil por ano para 68 mil. A taxa em relação à população teve picos de 63 mortes por 100 mil habitantes em 1921, e 176 em 1931. Hoje está em 0,15.
Esses números levam a dois paradoxos interessantes sobre a relação entre o homem e o clima. O primeiro lembra o Paradoxo de Spencer –referência a Herbert Spencer, para quem “o grau de preocupação pública sobre um problema ou fenômeno social varia inversamente a sua incidência”.
Assim como os ingleses se deram conta da pobreza quando ela começava a diminuir, durante a Revolução Industrial, a humanidade está apavorada com os infortúnios do clima justamente depois de conseguir sobreviver a eles.
O segundo paradoxo: ao mesmo tempo em que emitimos muito (mas muito mesmo) carbono na atmosfera e causamos um grave problema de efeito estufa, também nos tornamos menos vulneráveis à natureza. Na verdade, proteger-se do clima foi um dos principais motivos para termos poluído tanto.
Veja o caso da construção. Produzir cimento consiste grosseiramente em queimar calcário e liberar dióxido de carbono.
Se a indústria de cimento fosse um país, seria o terceiro maior emissor de gases do efeito estufa. Mas essa indústria poluidora permitiu que as pessoas deixassem casas de pau-a-pique ou madeira para dormirem abrigadas em estruturas mais seguras.
Já a fome originada pela seca, principal causa de morte por desastres naturais nos anos 1920, foi resolvida com a criação dos fertilizantes químicos, sistemas de irrigação e a construção de represas e redes de saneamento.
Todas essas atividades causaram aquecimento global –mas não deixam de ser grandes conquistas humanas, que merecem ser celebradas e difundidas entre os pobres que ainda vivem sob risco de morrer durante furacões, secas ou inundações.
Será que a queda histórica das mortes por desastres naturais vai se reverter nos próximos anos, tornando realidade os vaticínios apocalípticos de Greta Thunberg, para quem “bilhões de pessoas morrerão se não tomarmos medidas urgentes”?
O ativista climático Michael Shellenberger, autor do brilhante “Apocalipse Nunca”, que será lançado este mês no Brasil pela editora LVM, acha que não.
Pretendo falar mais sobre o livro de Shellenberger em outras colunas, mas já adianto um dos argumentos: o alarmismo ambiental despreza a capacidade humana de se adaptar e resolver problemas.
“Os Países Baixos, por exemplo, tornaram-se uma nação rica mesmo tendo um terço de suas terras abaixo do nível do mar, incluindo áreas que estão nada menos do que sete metros abaixo do mar”, diz ele.
A luta contra o aquecimento global não precisa de ativistas obcecados com o apocalipse (que geralmente desprezam soluções óbvias, como a energia nuclear). Precisa de tecnologia, de inovadores, de gente que dê mais conforto e segurança à humanidade interferindo na natureza cada vez menos.

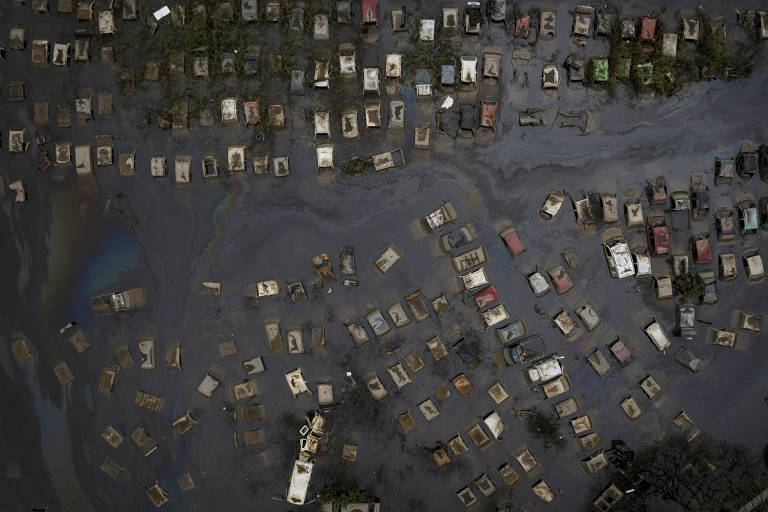
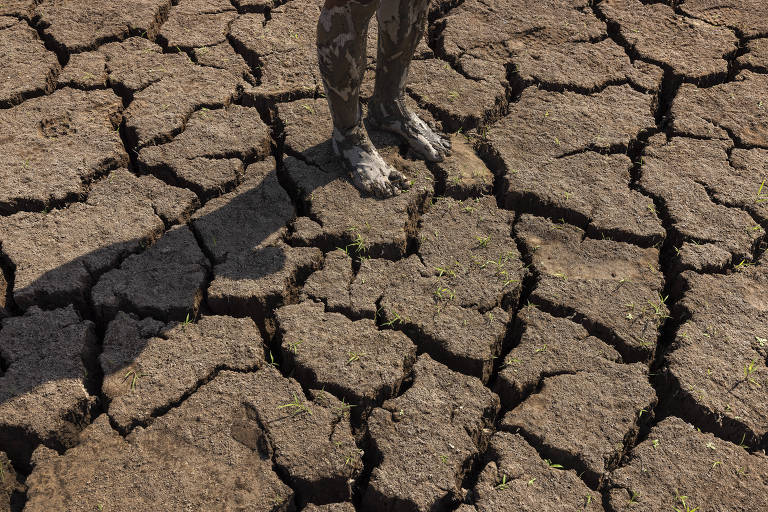

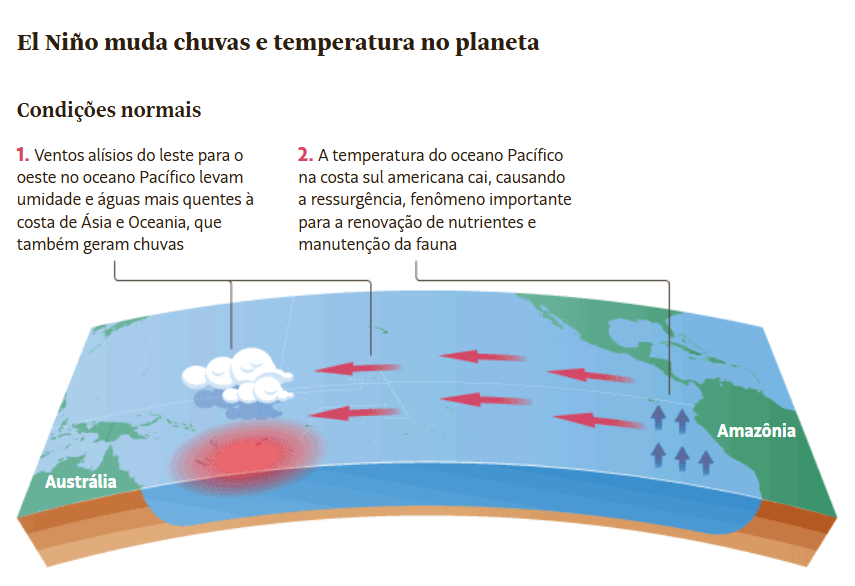
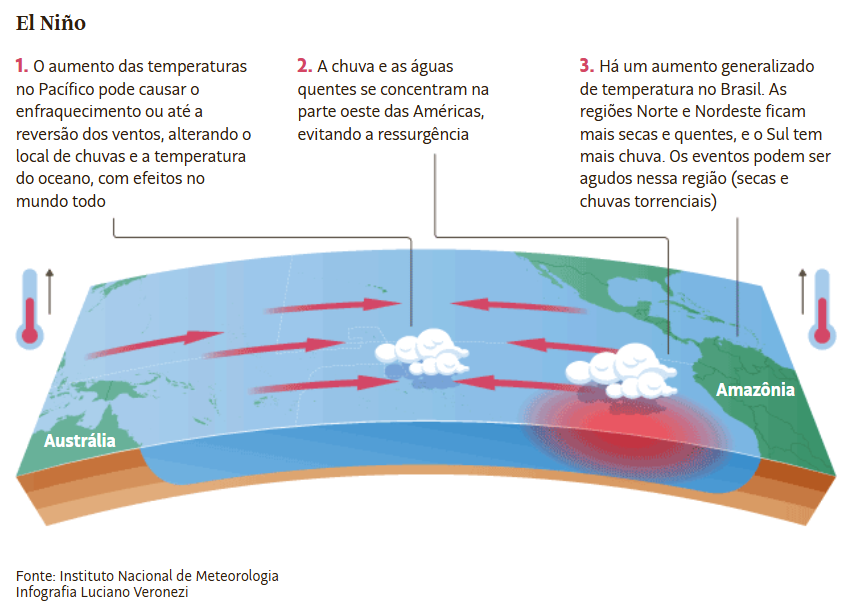
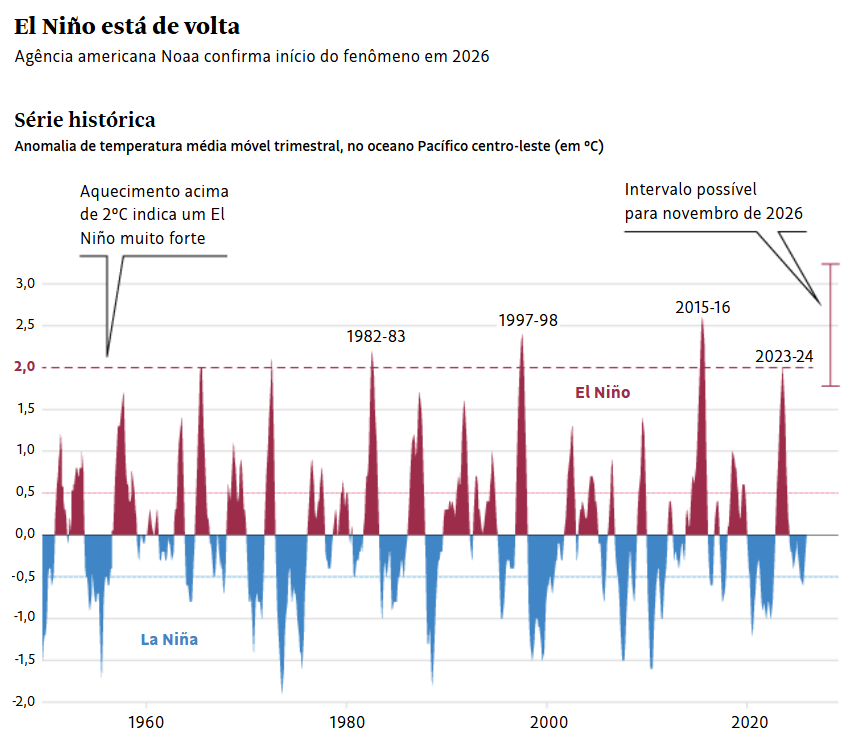
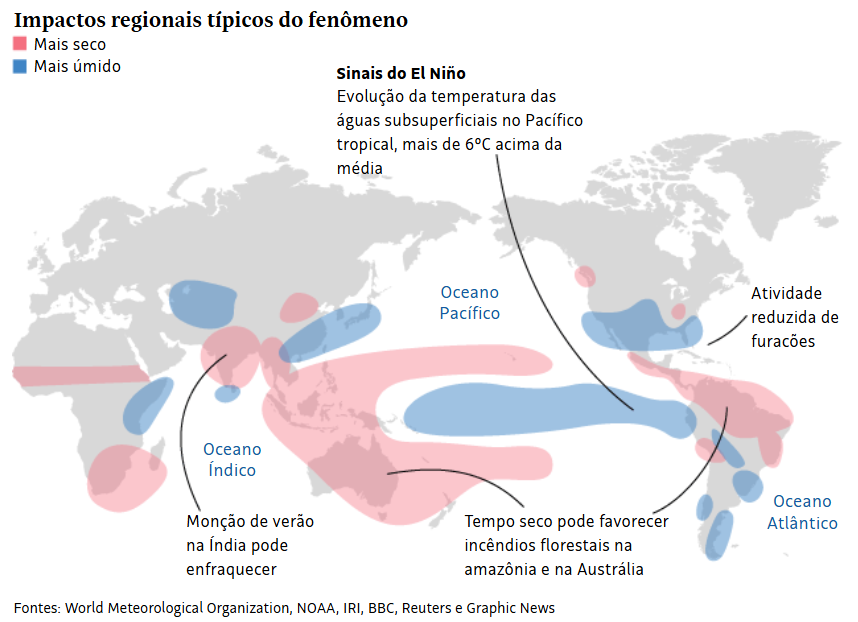

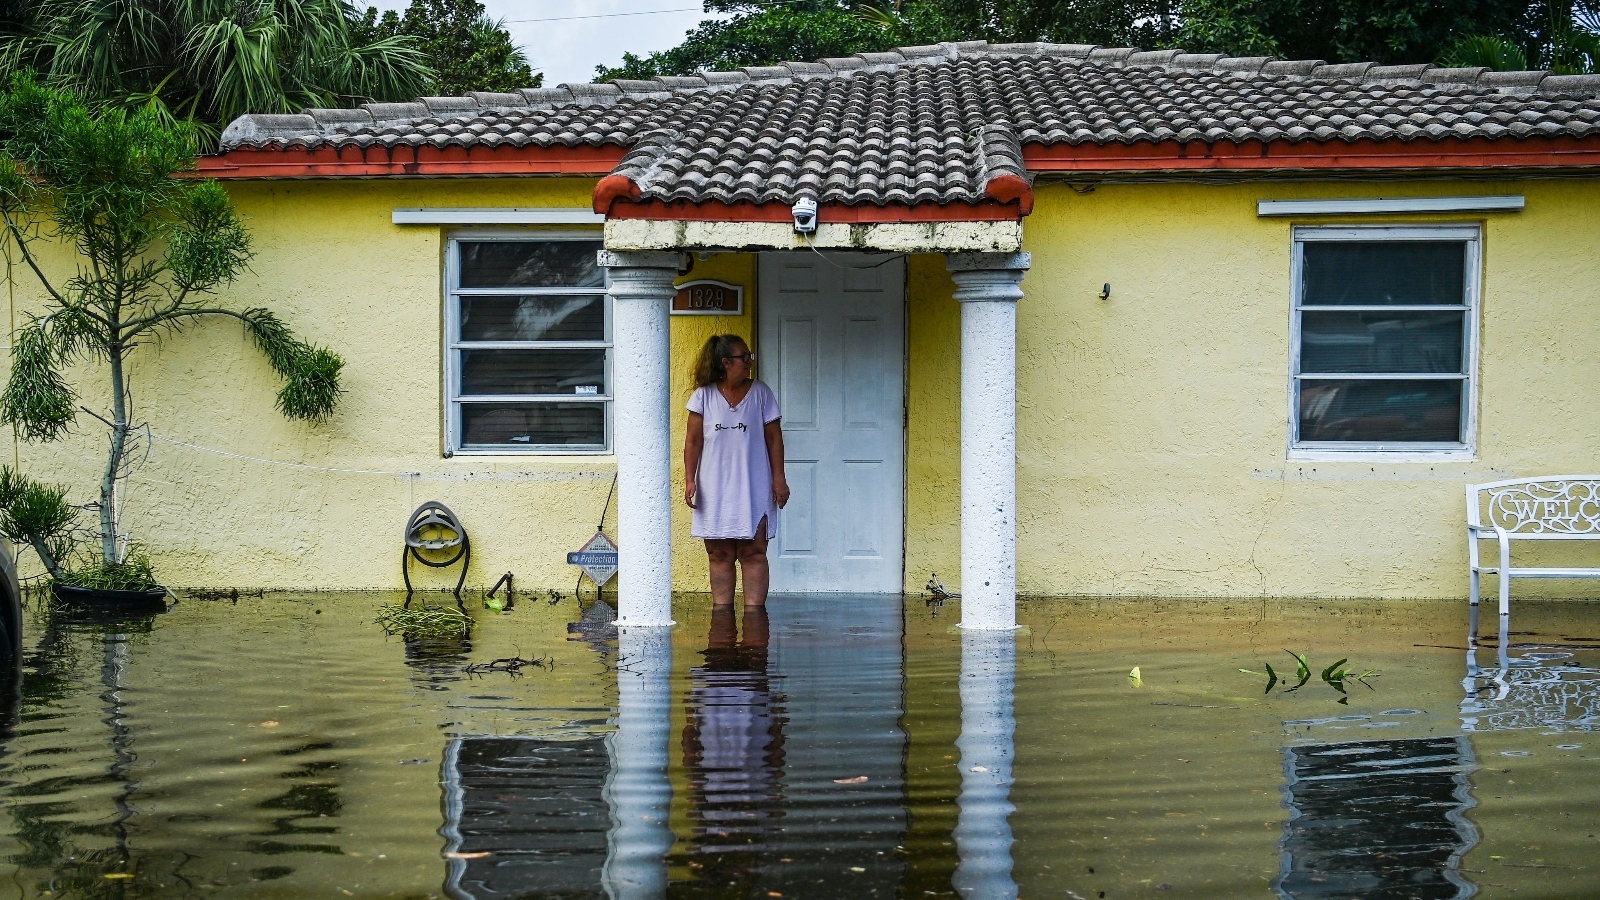
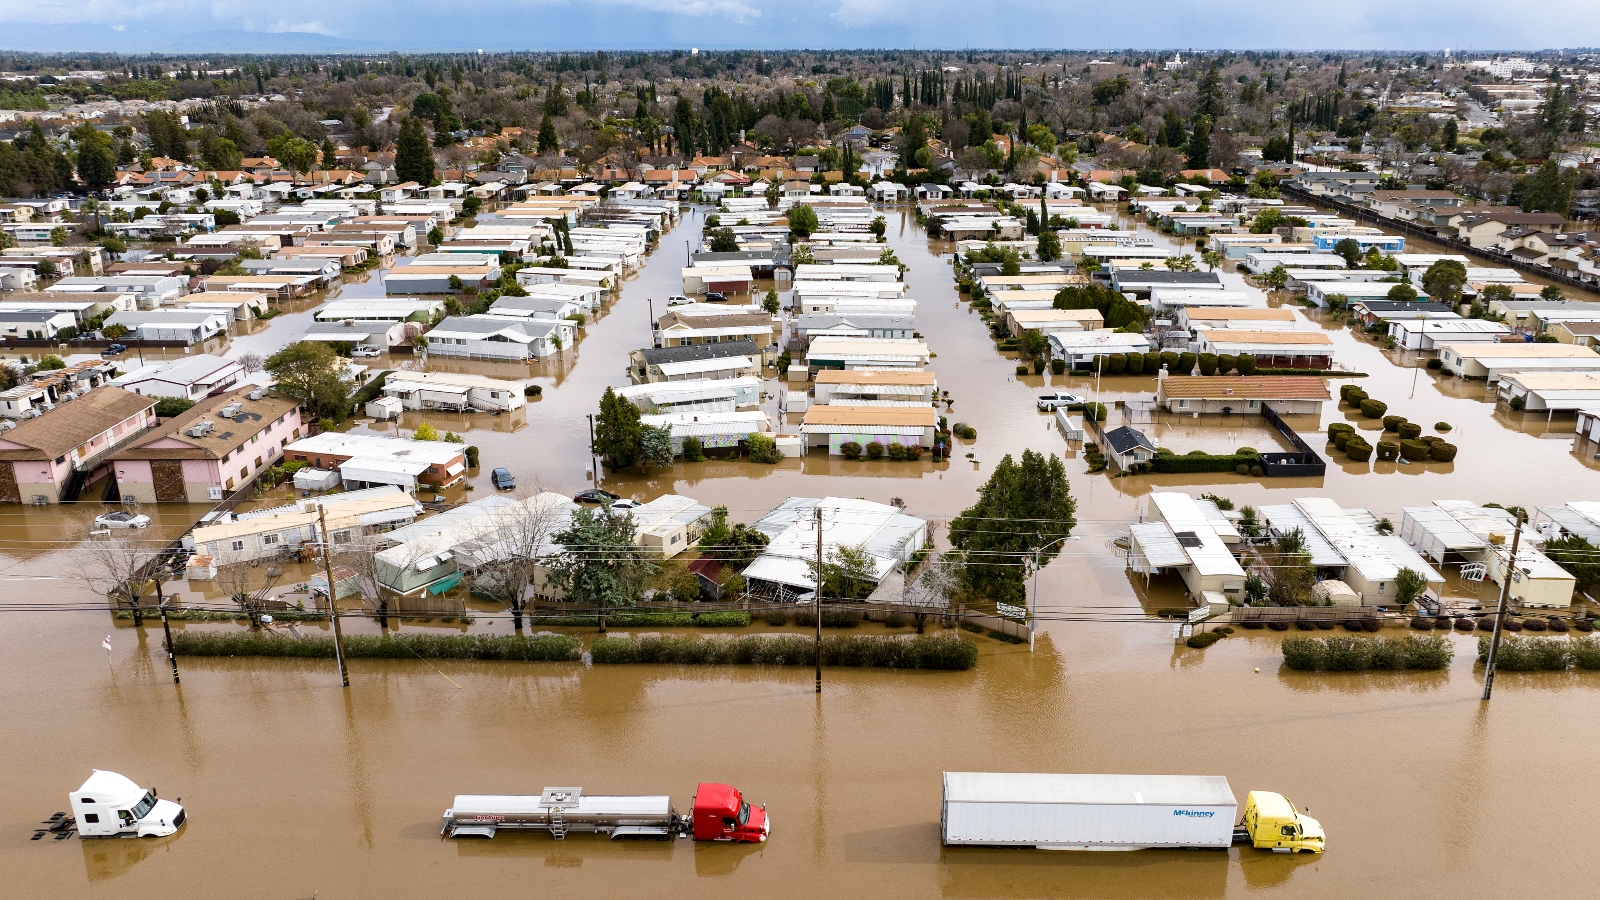
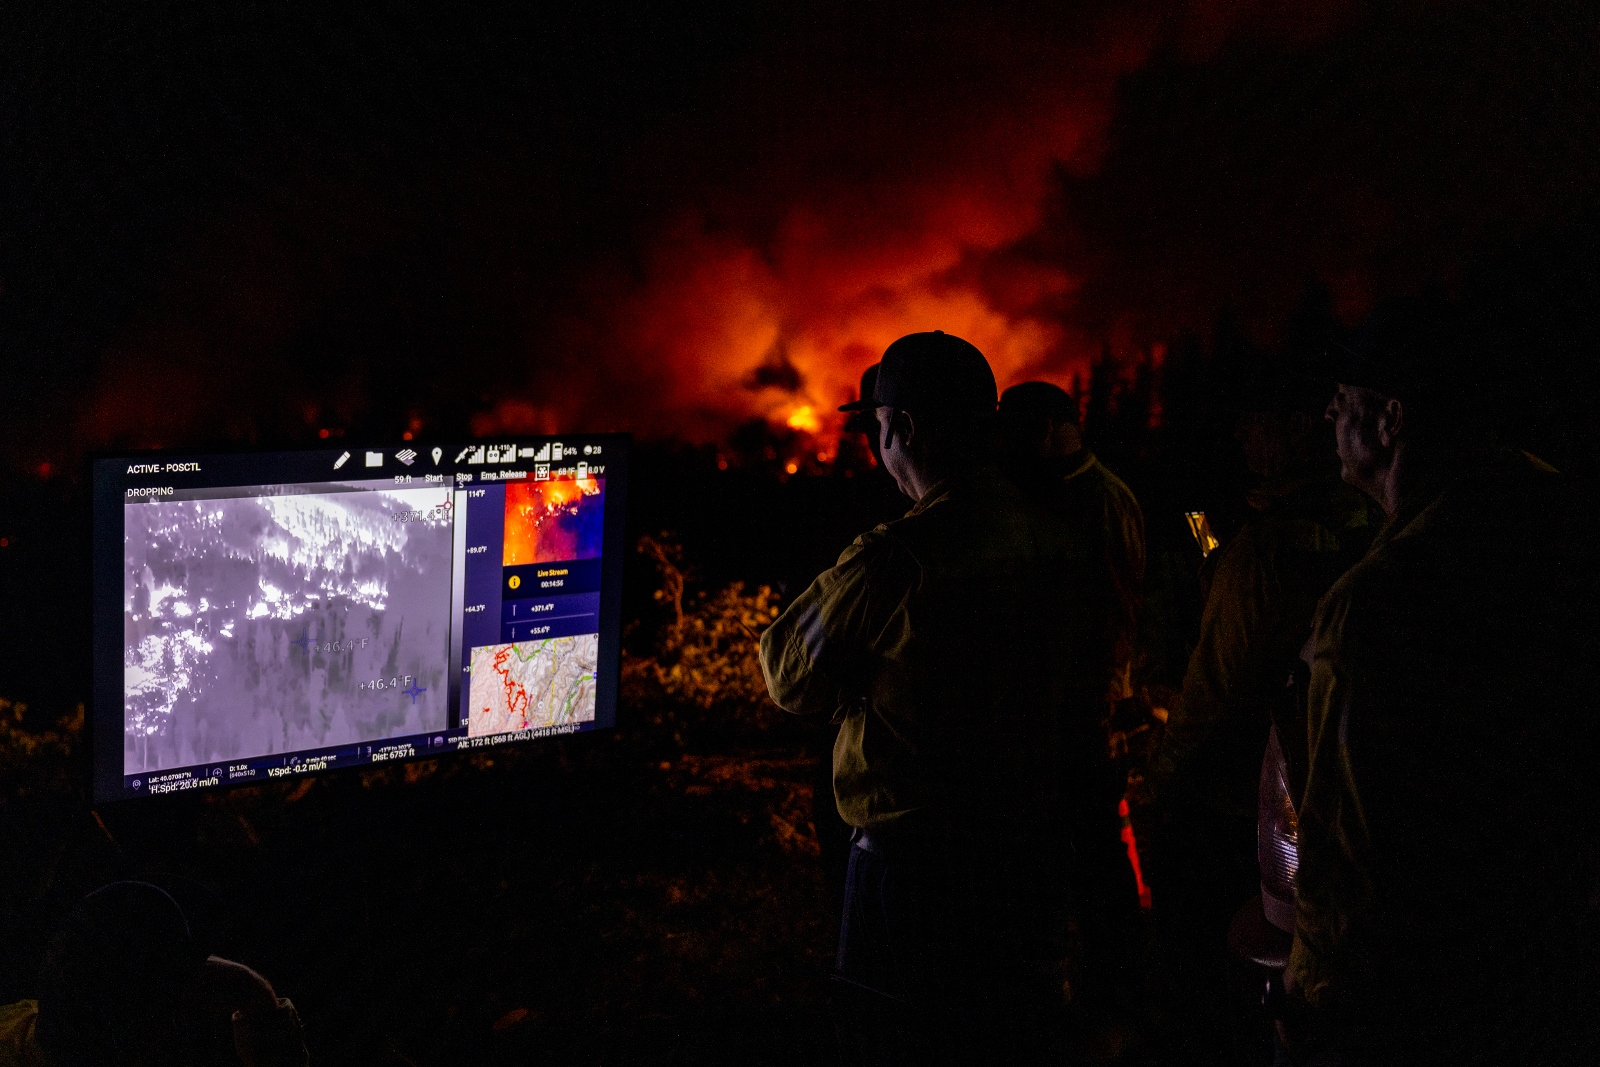
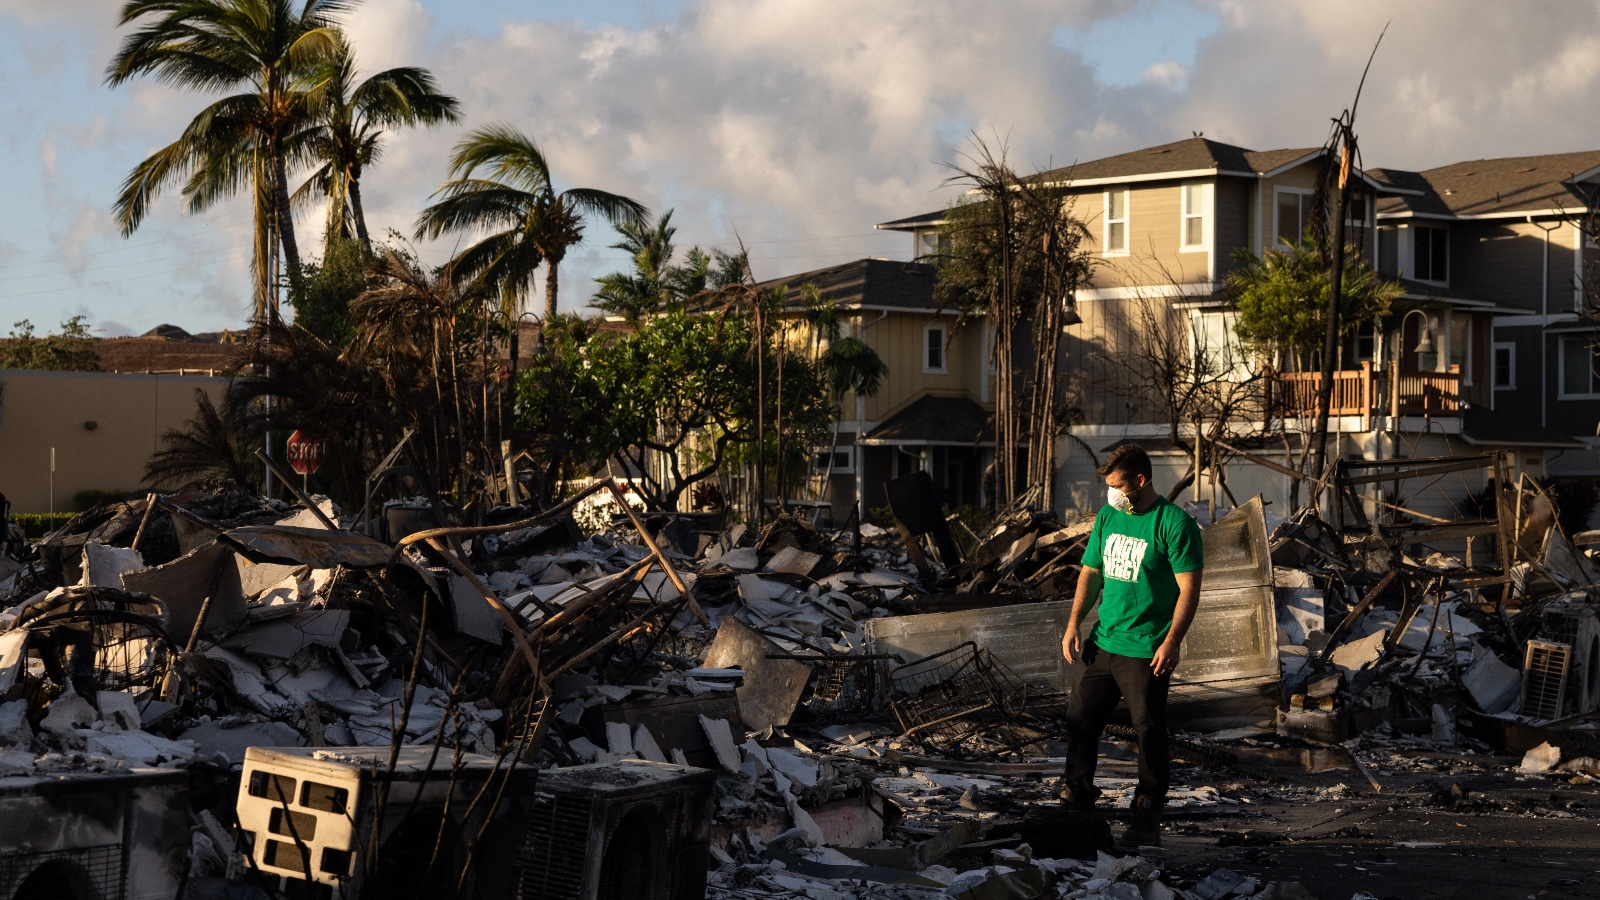
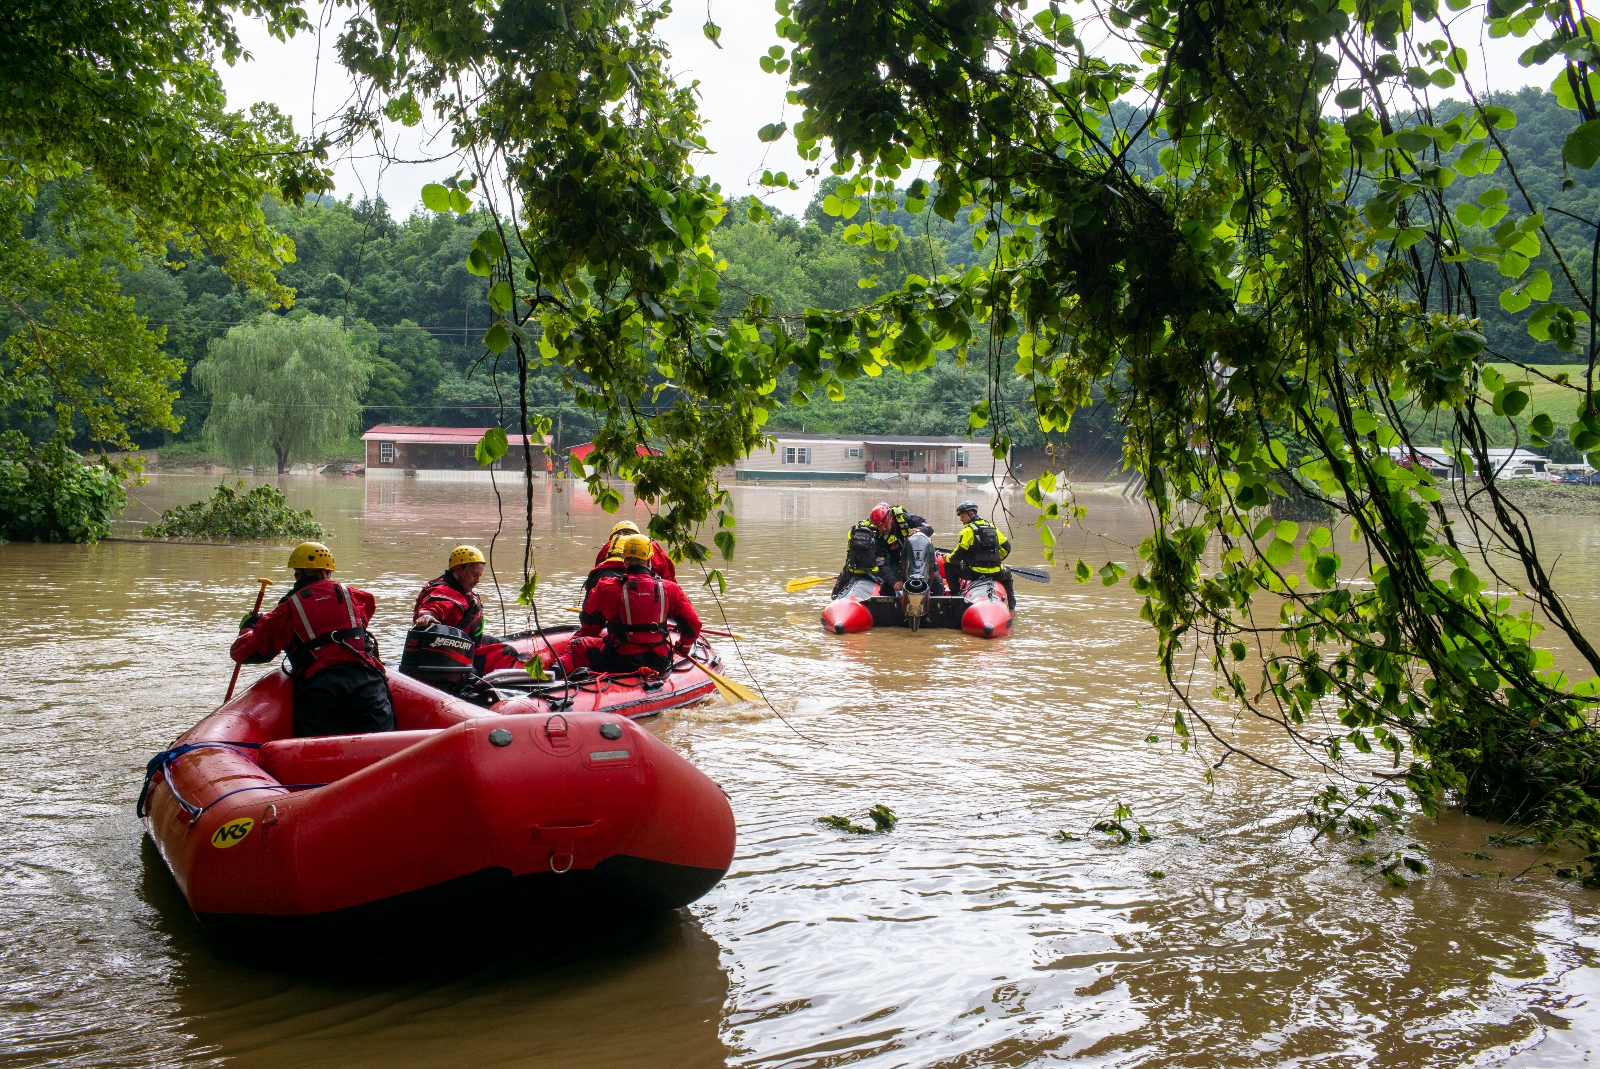
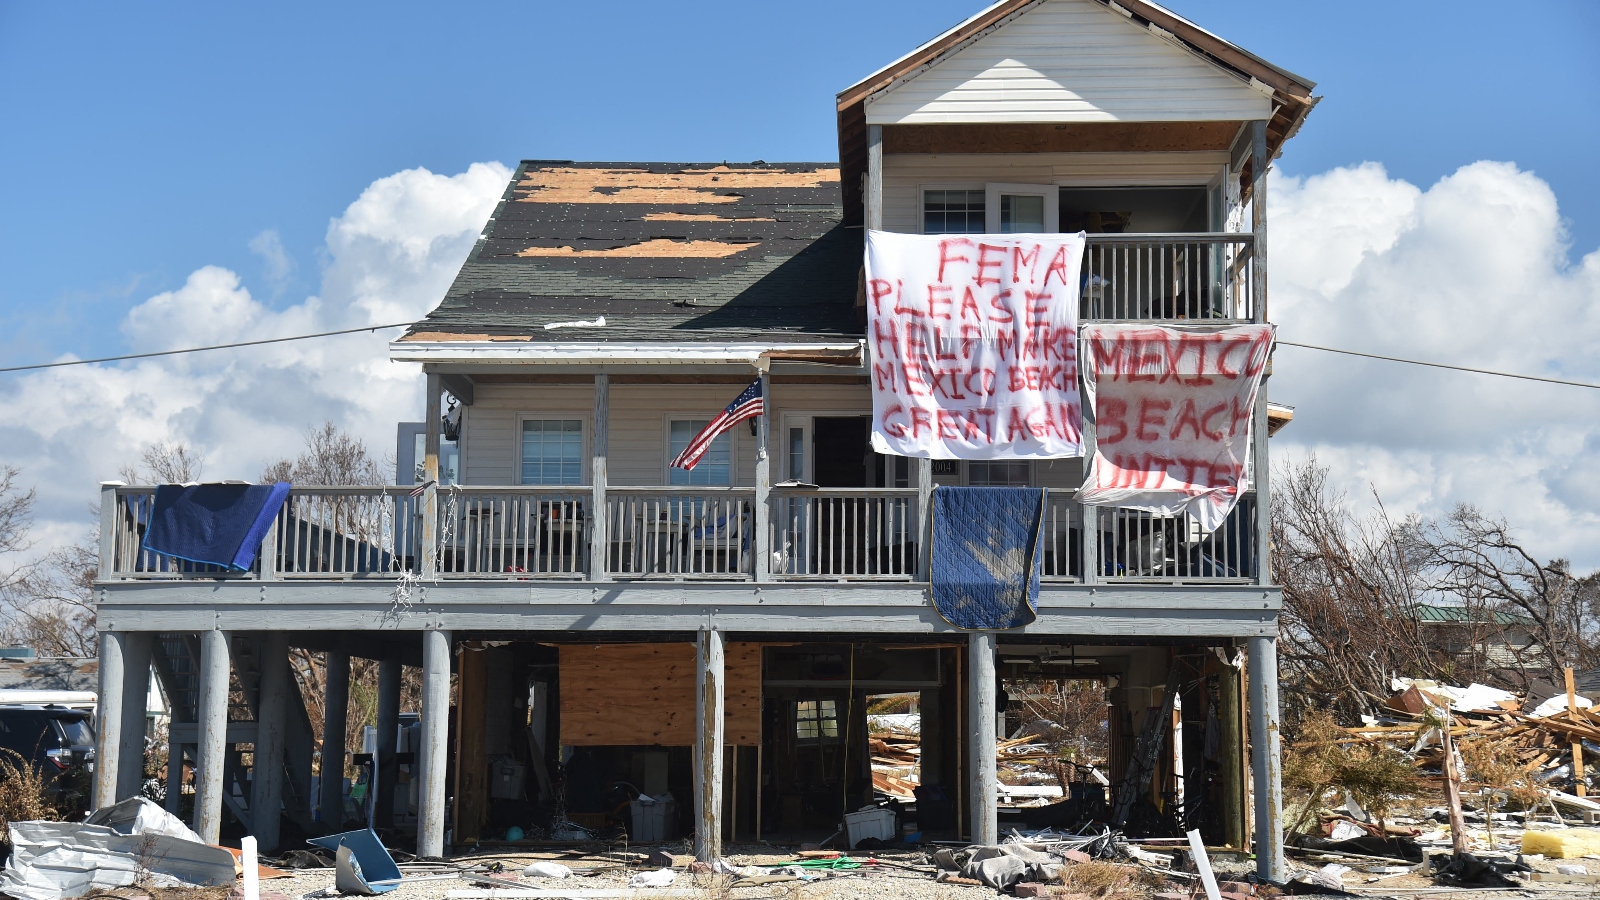
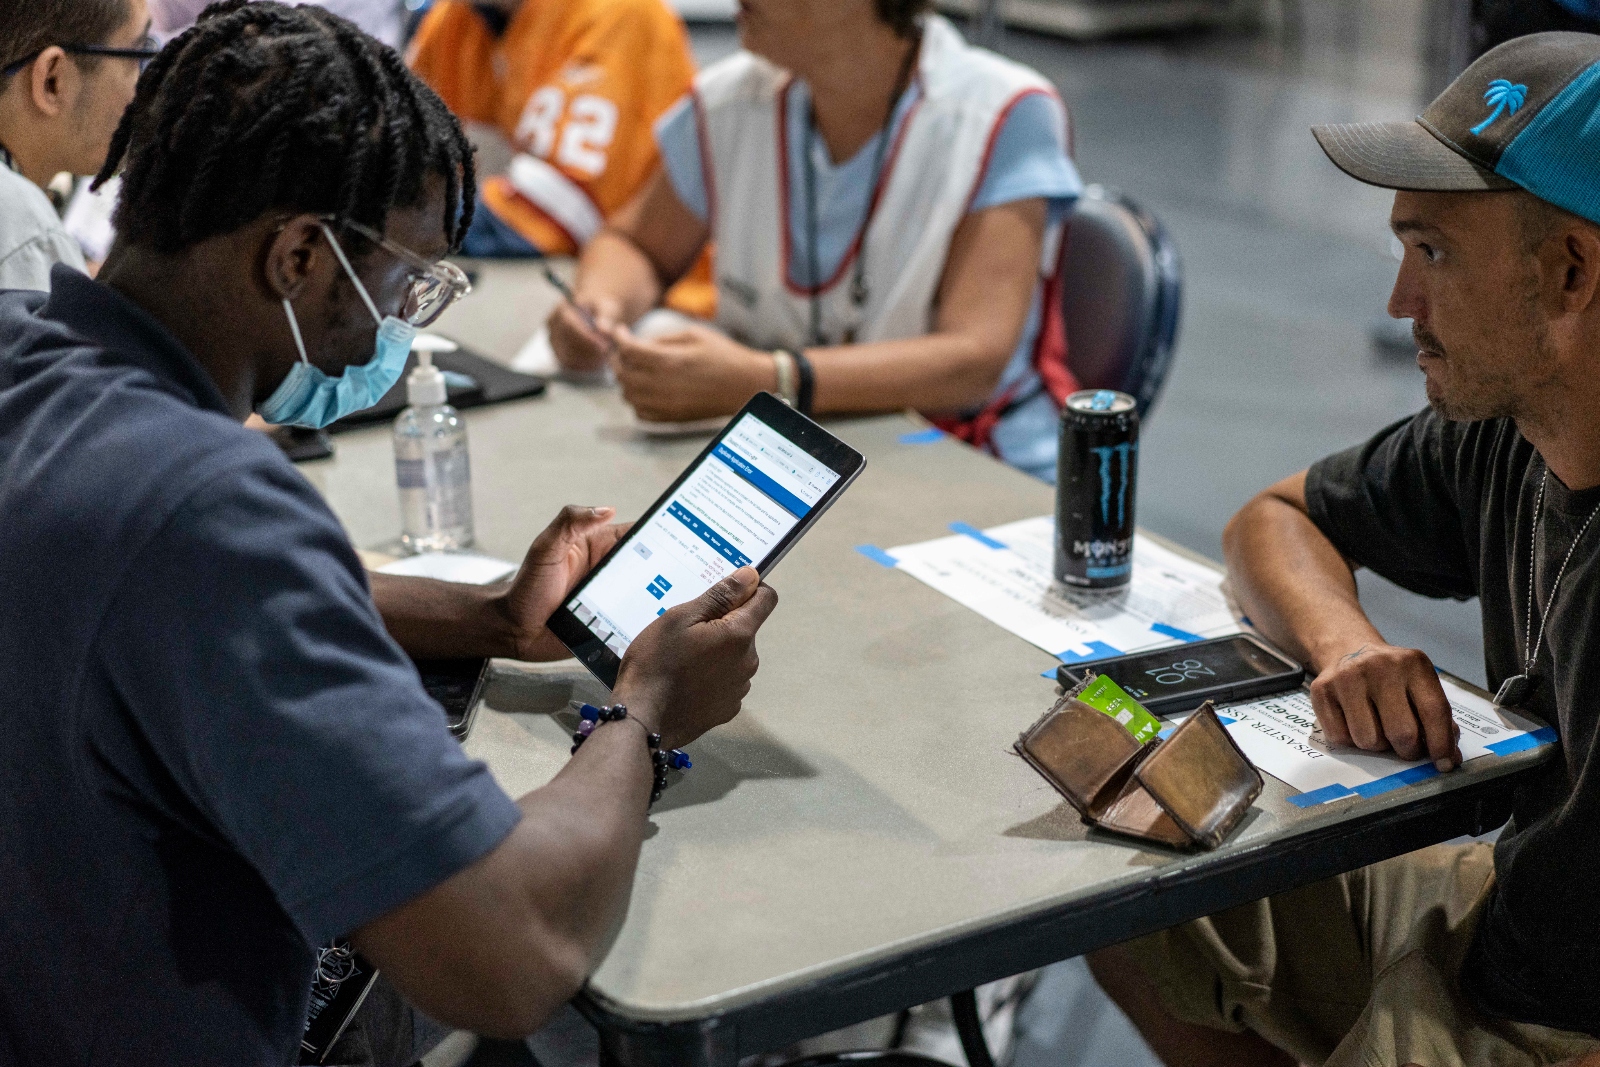
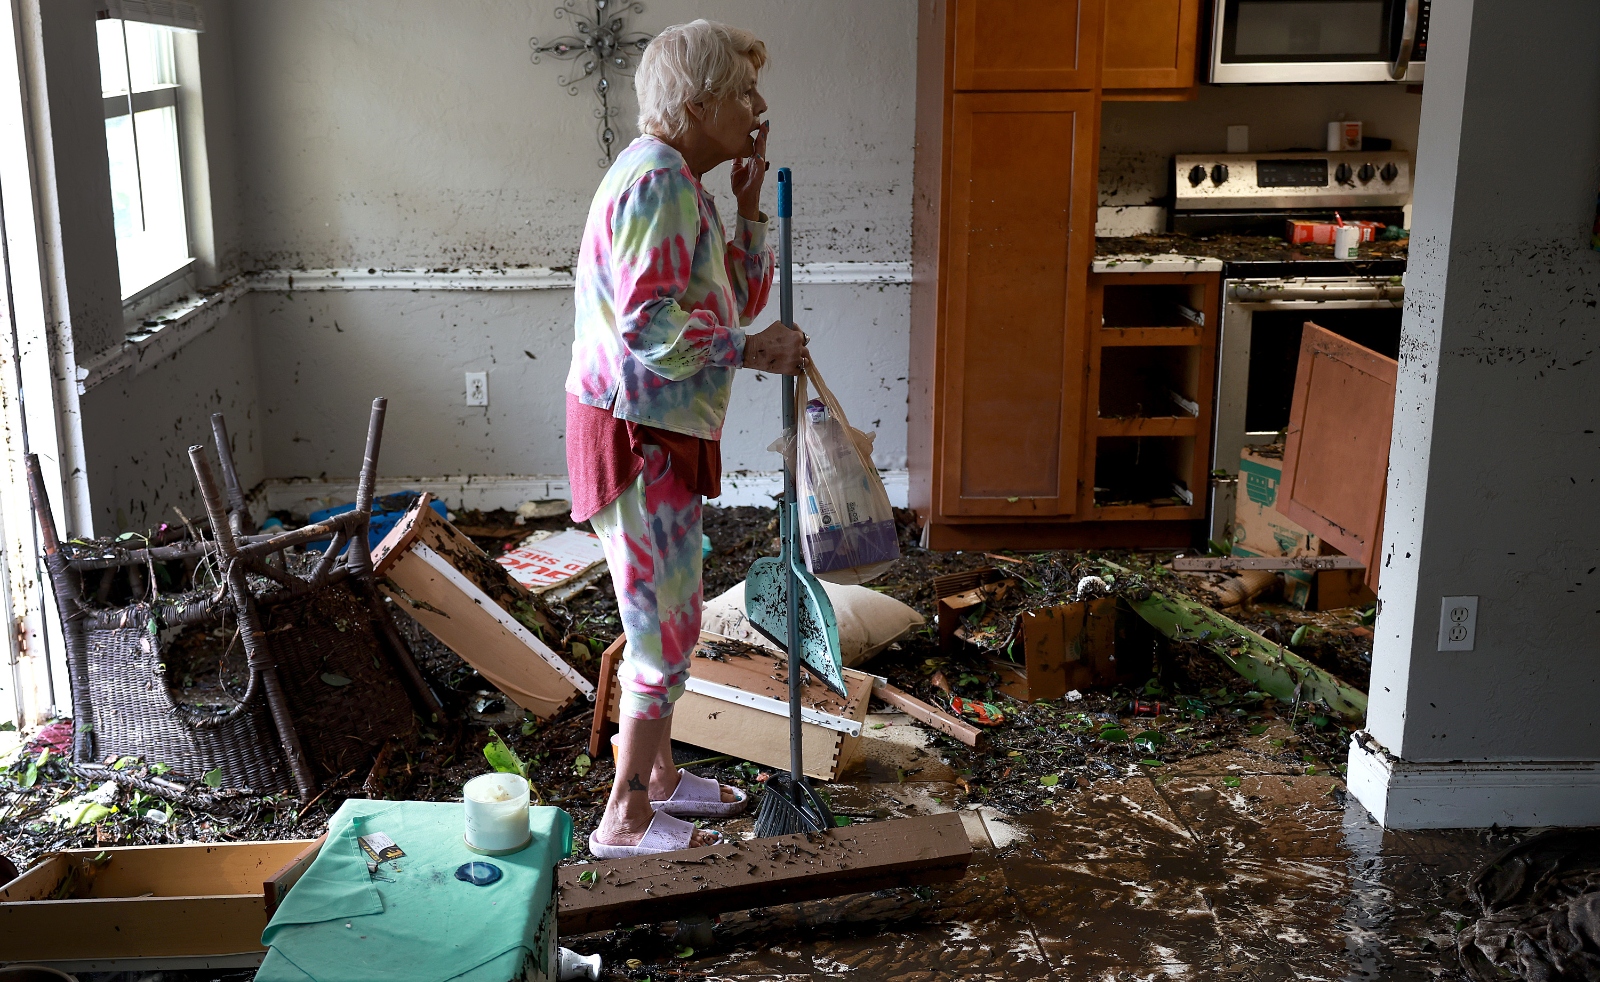
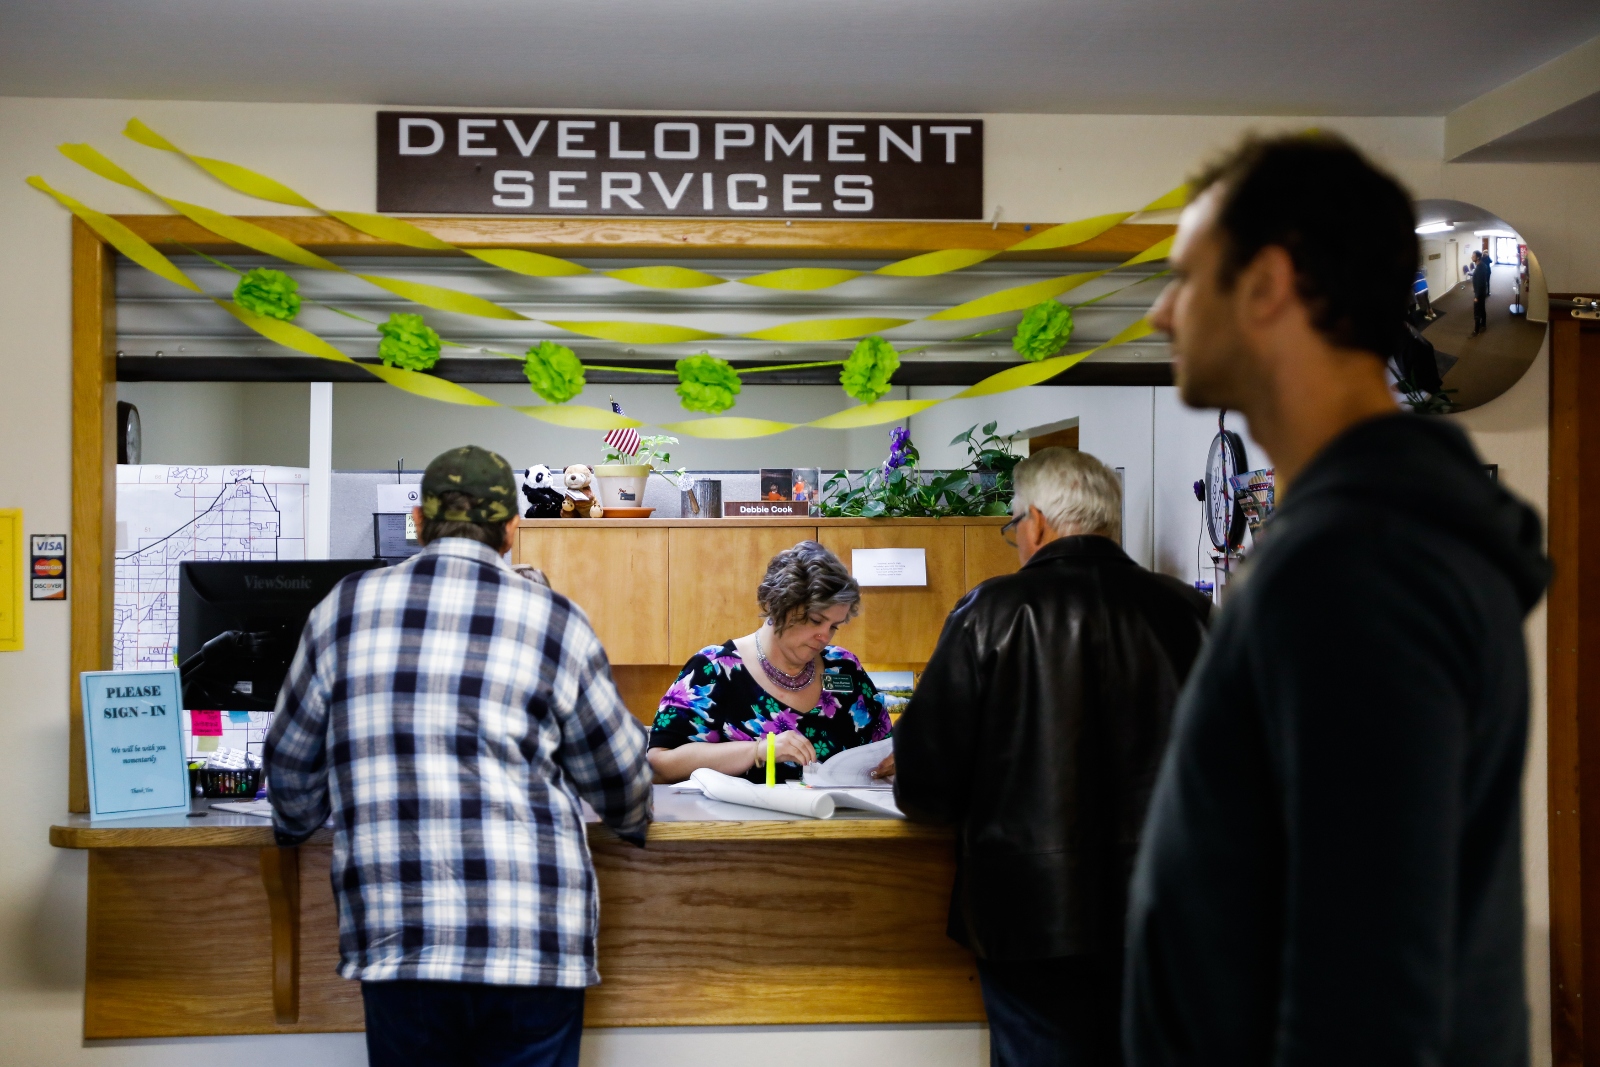
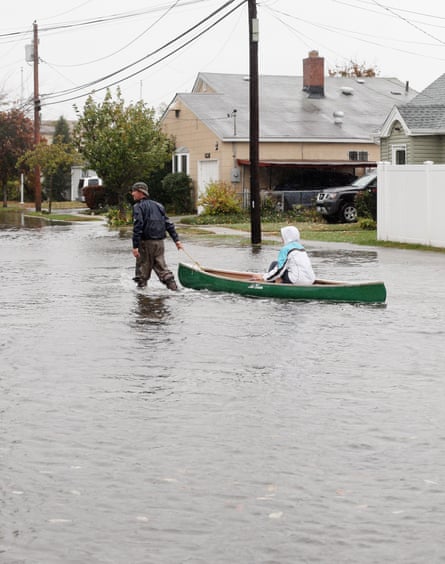
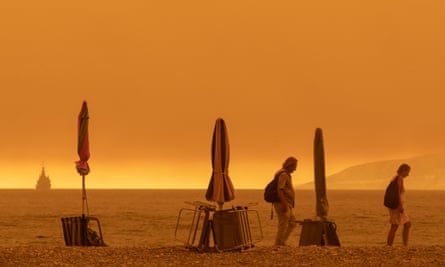
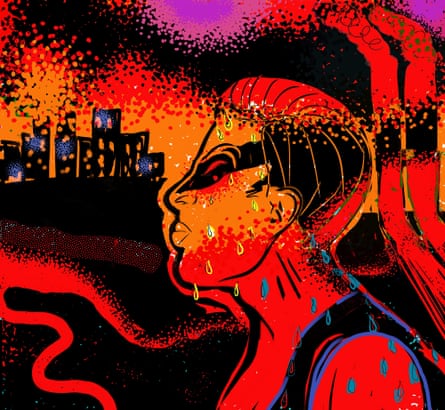
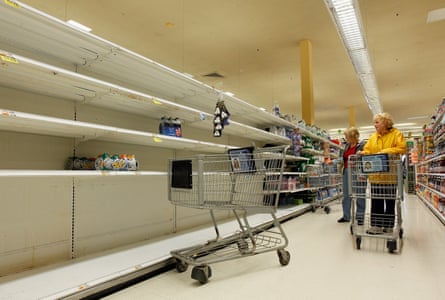
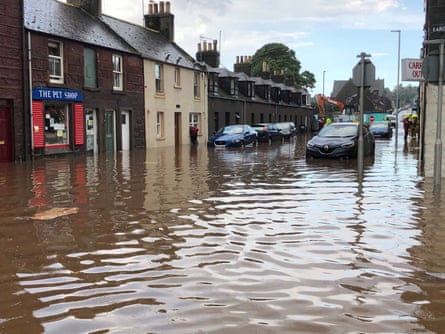
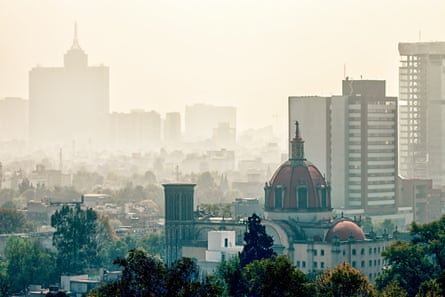
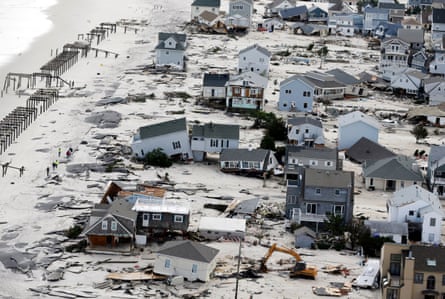


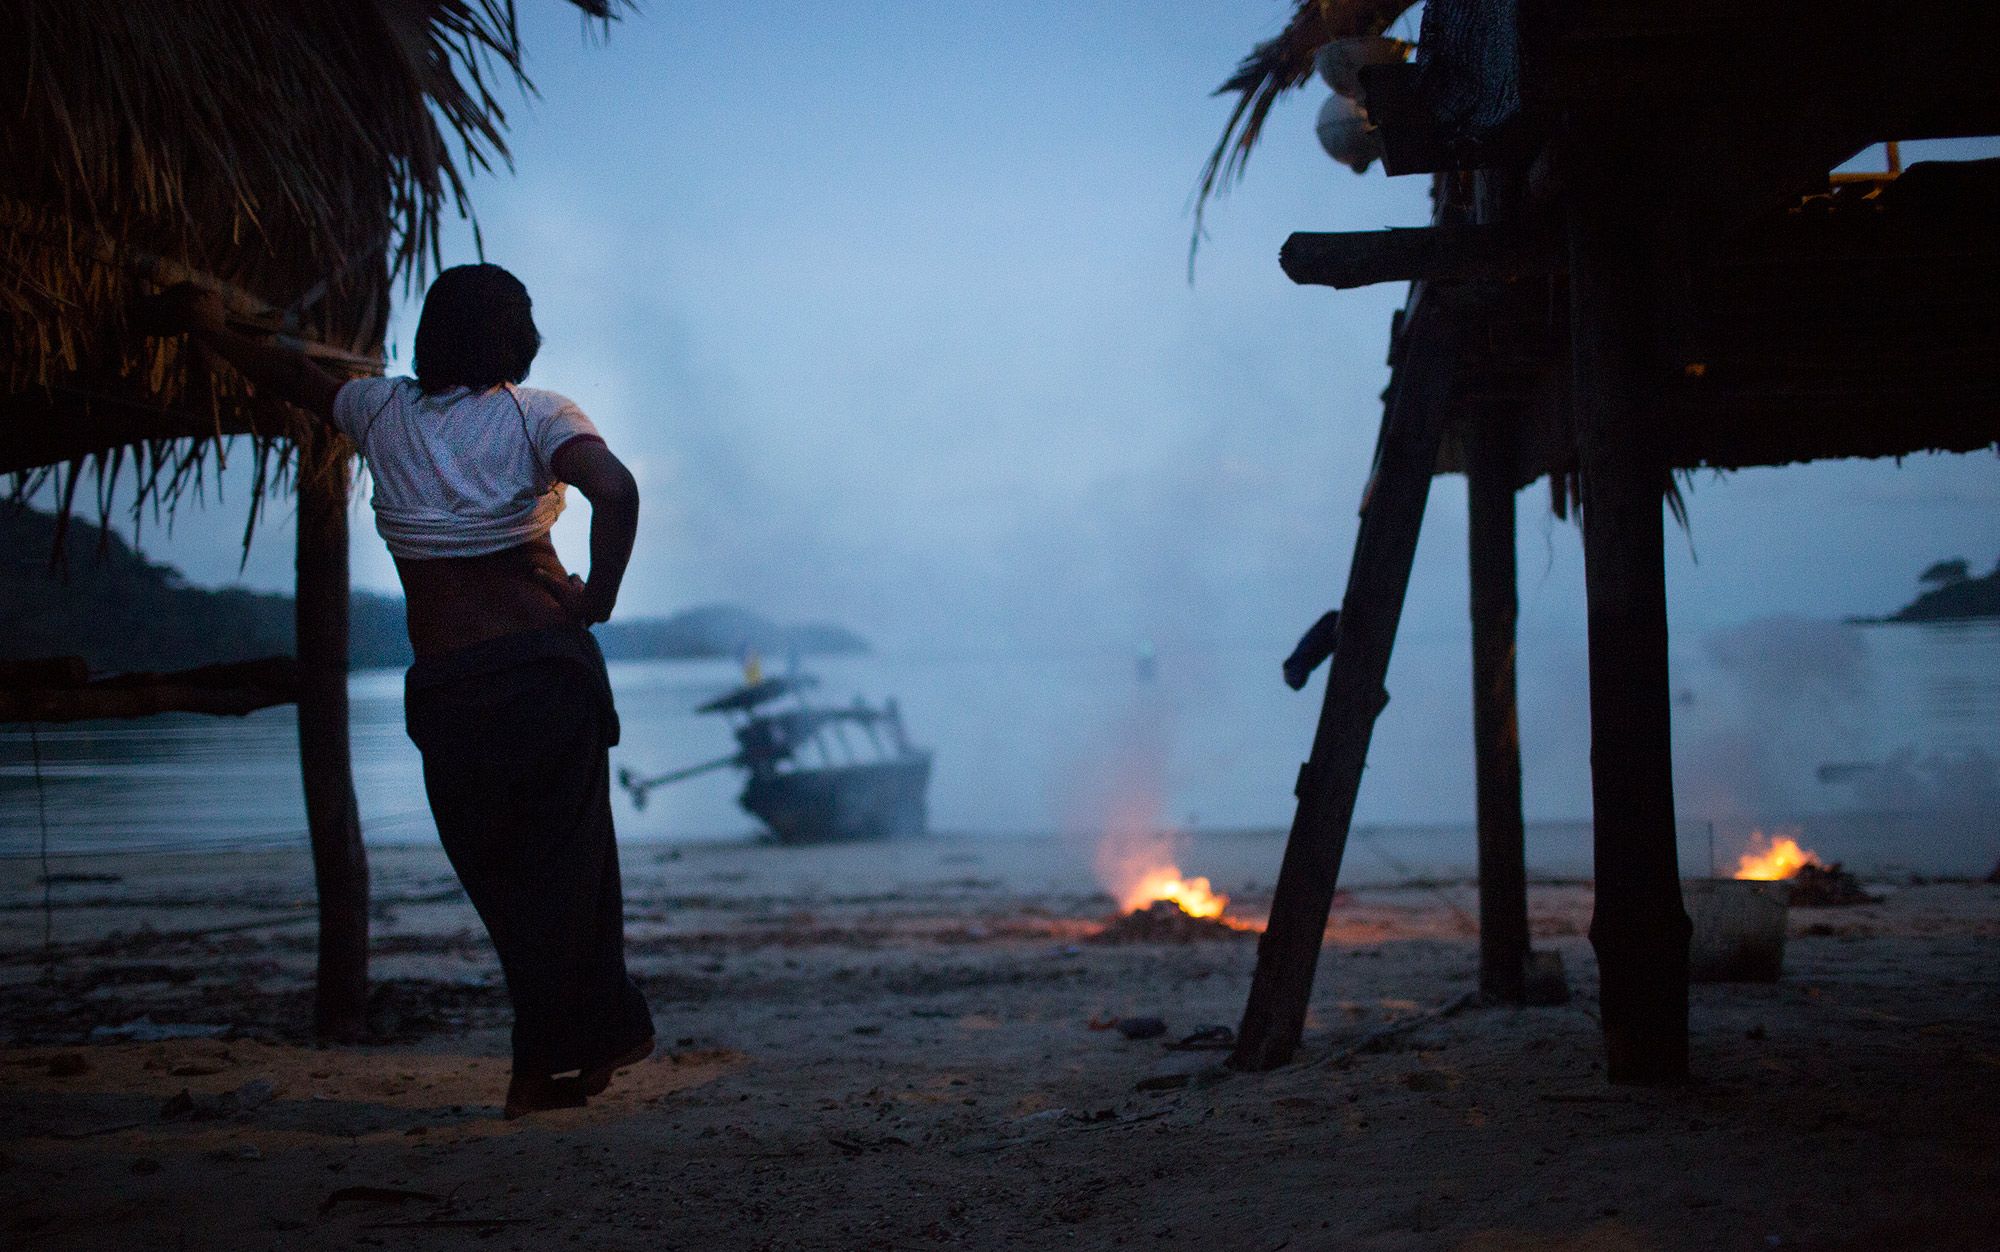
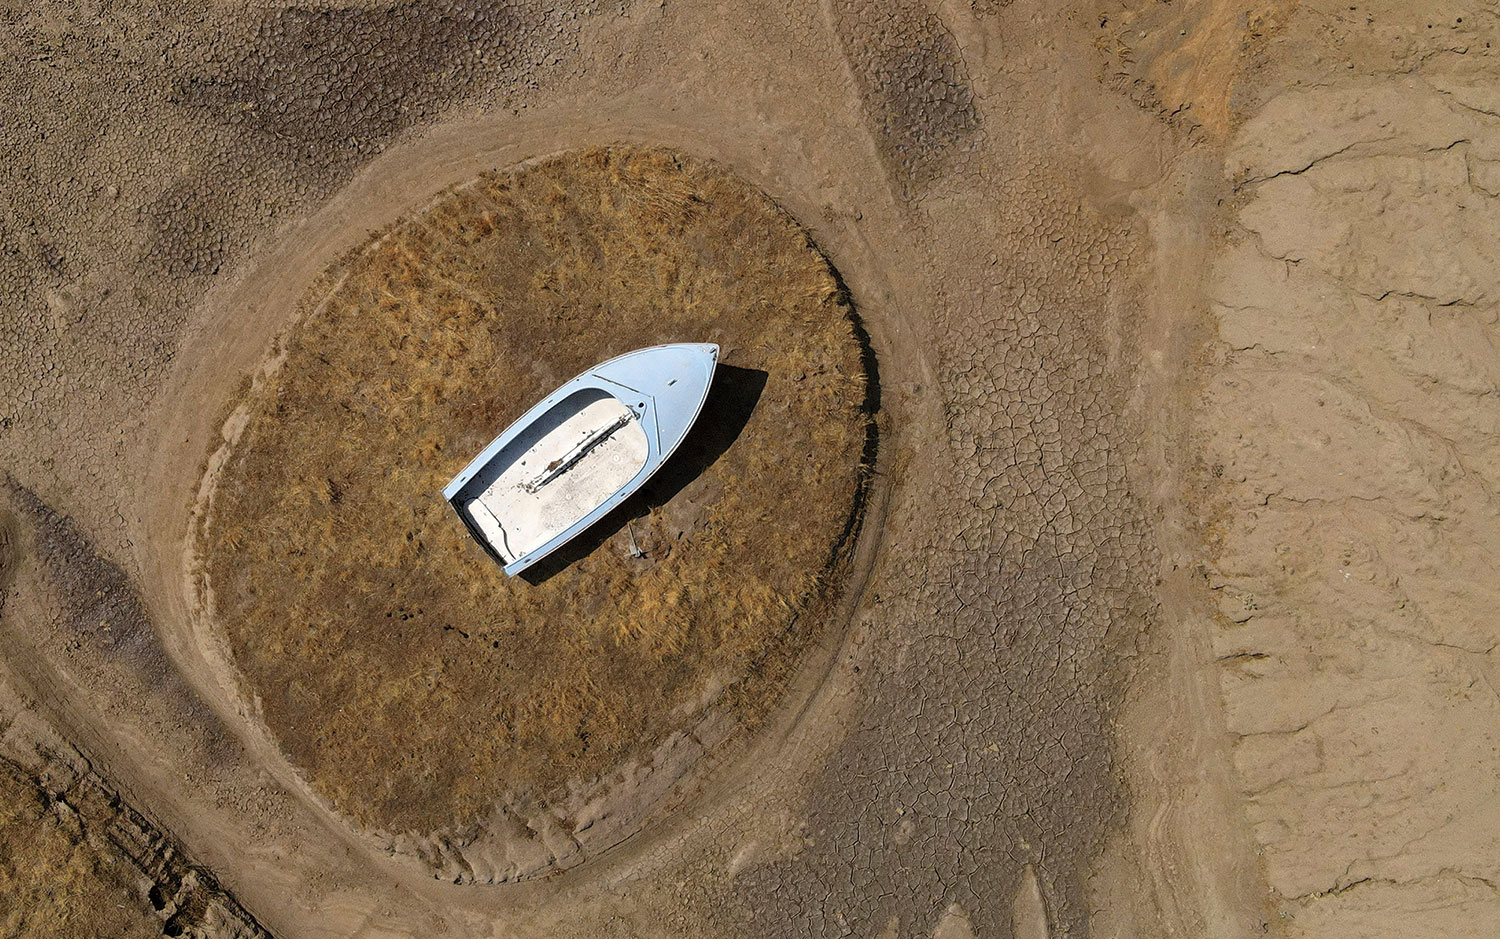
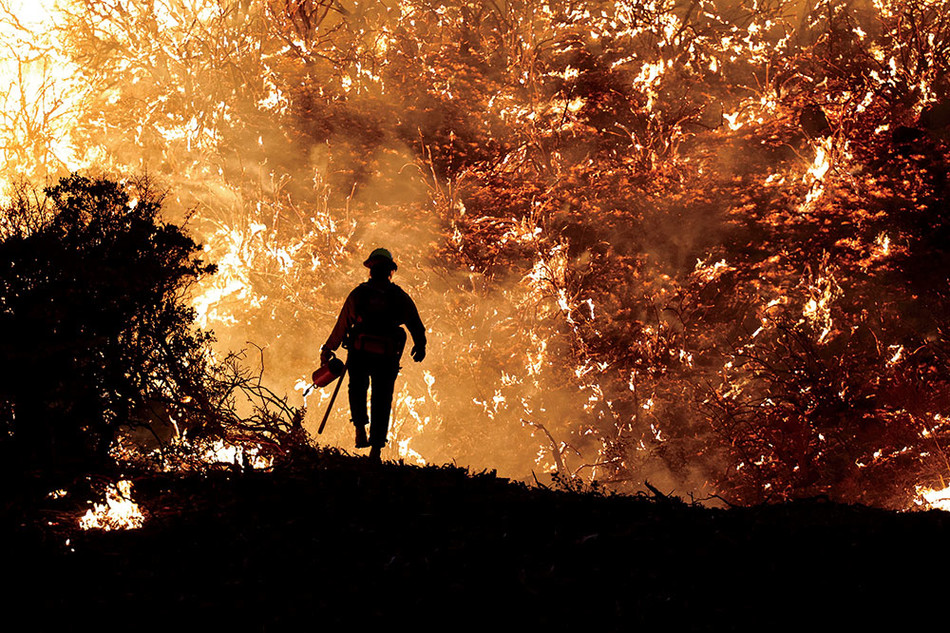
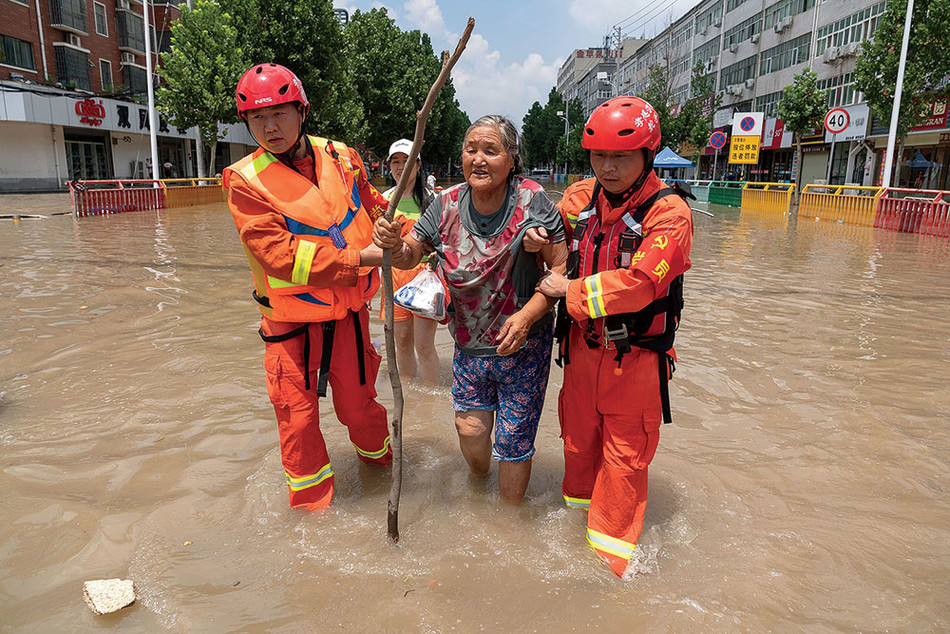

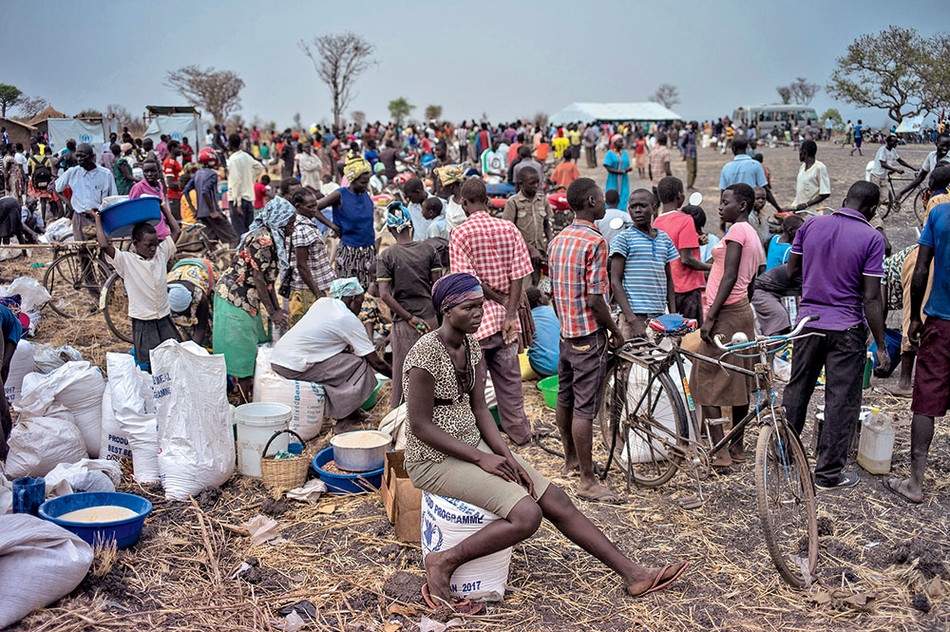

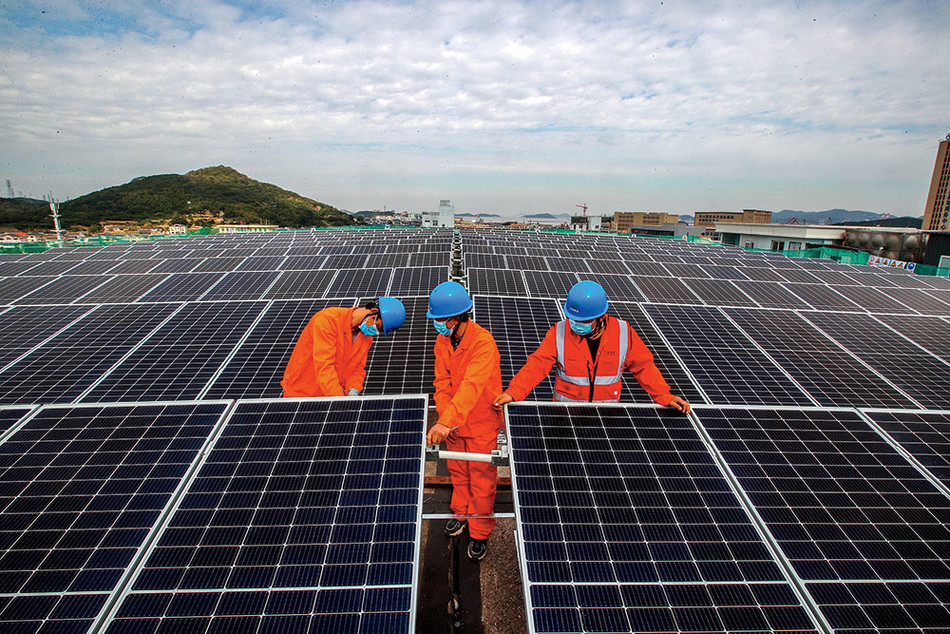
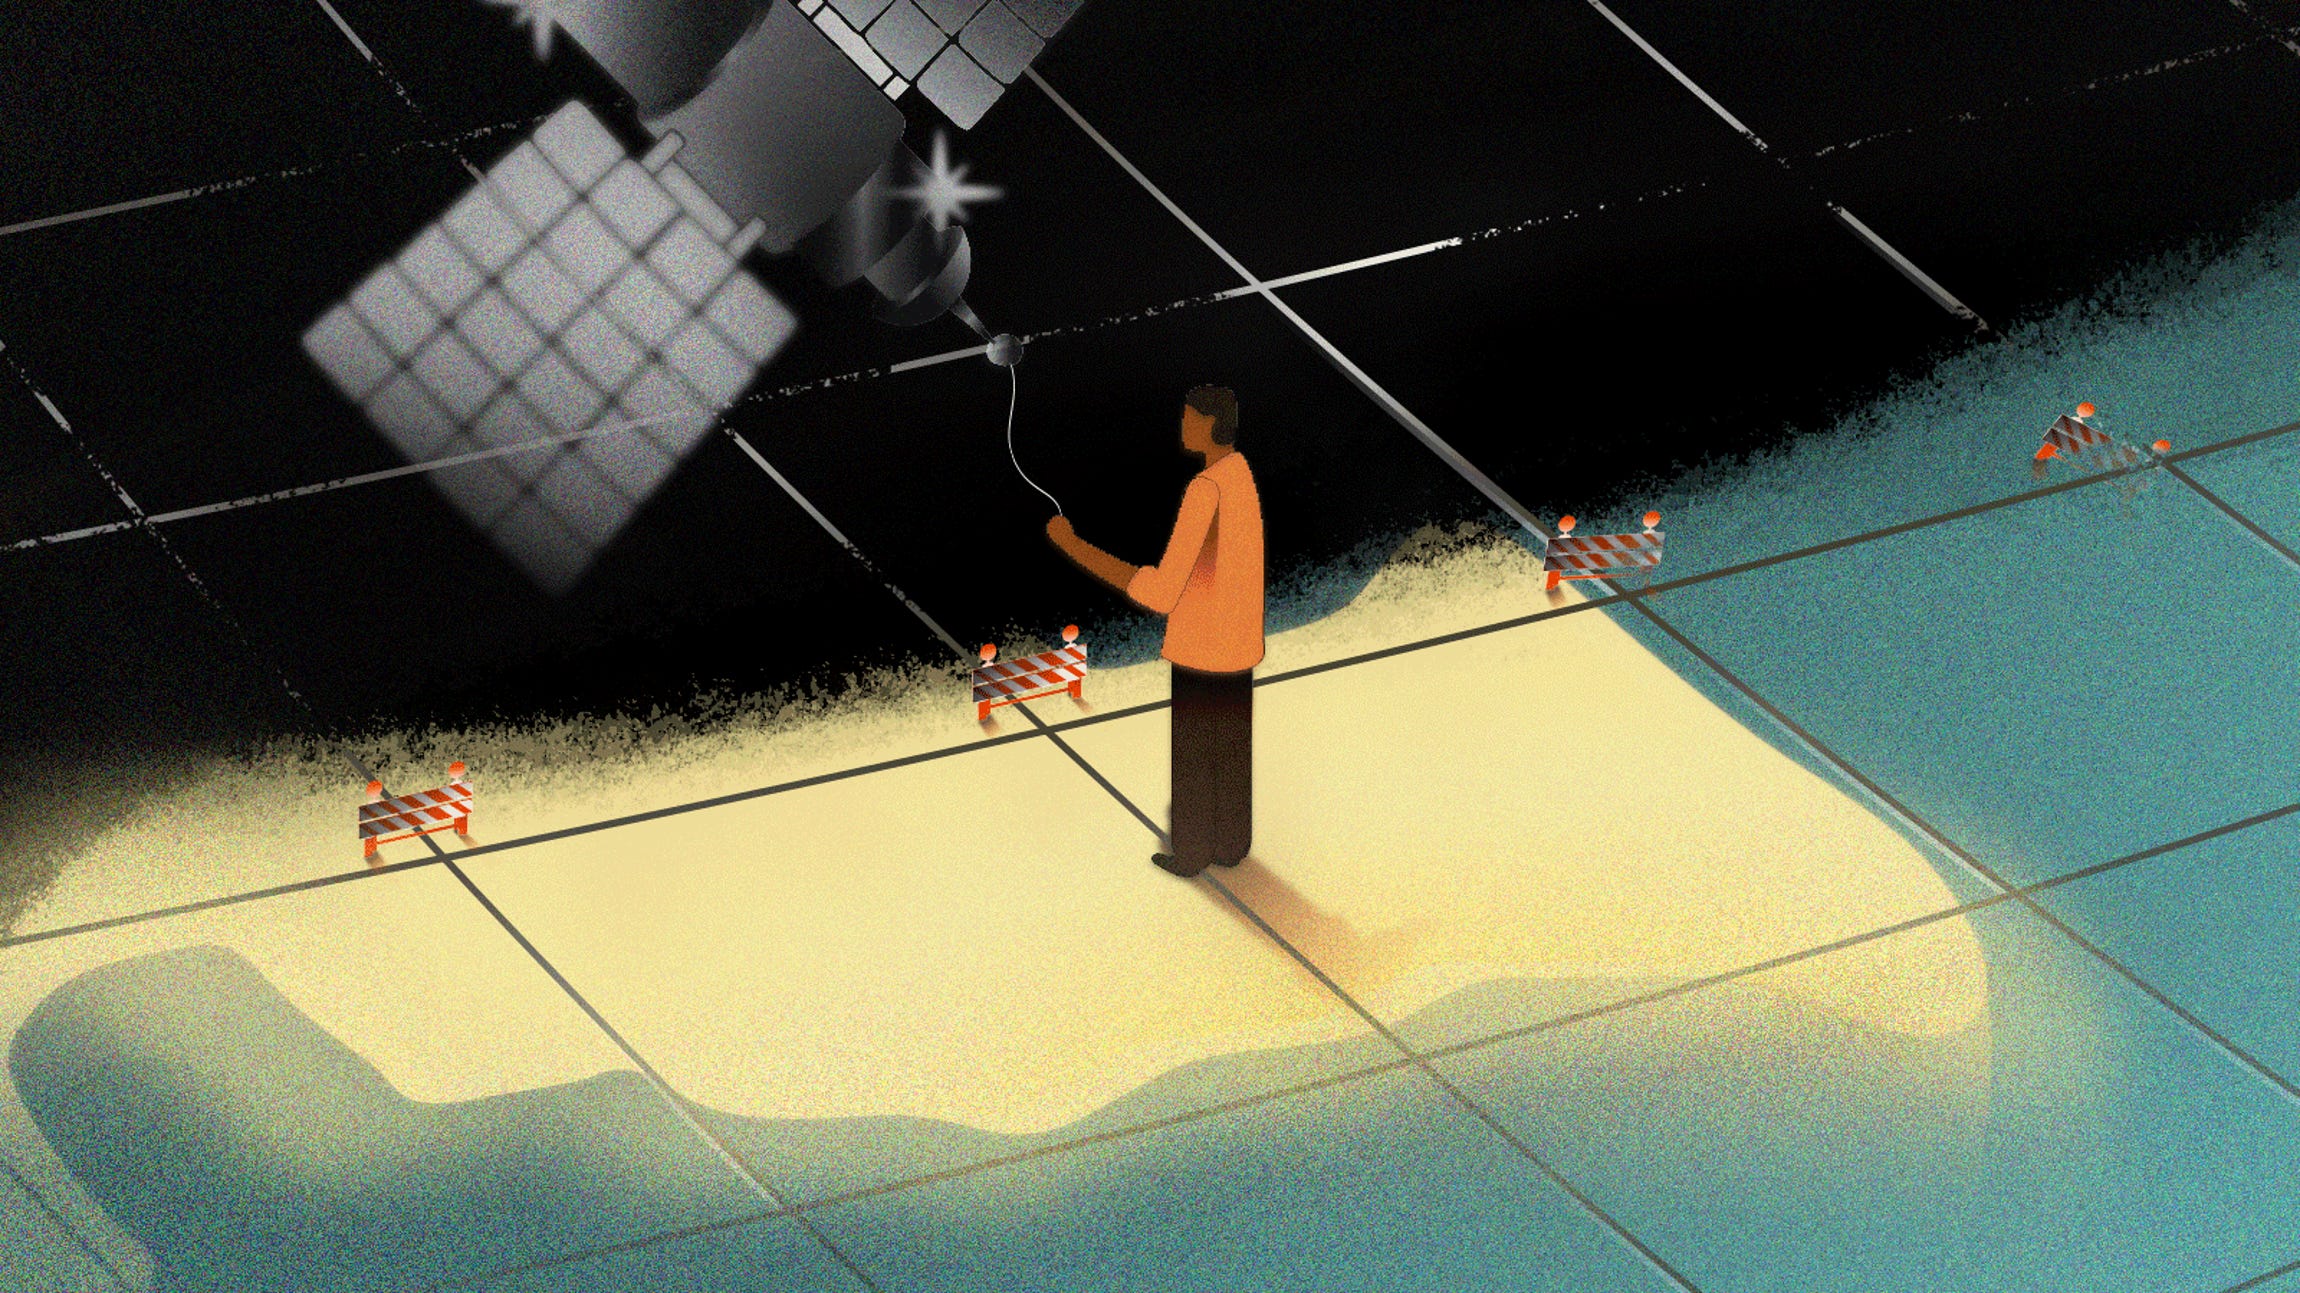


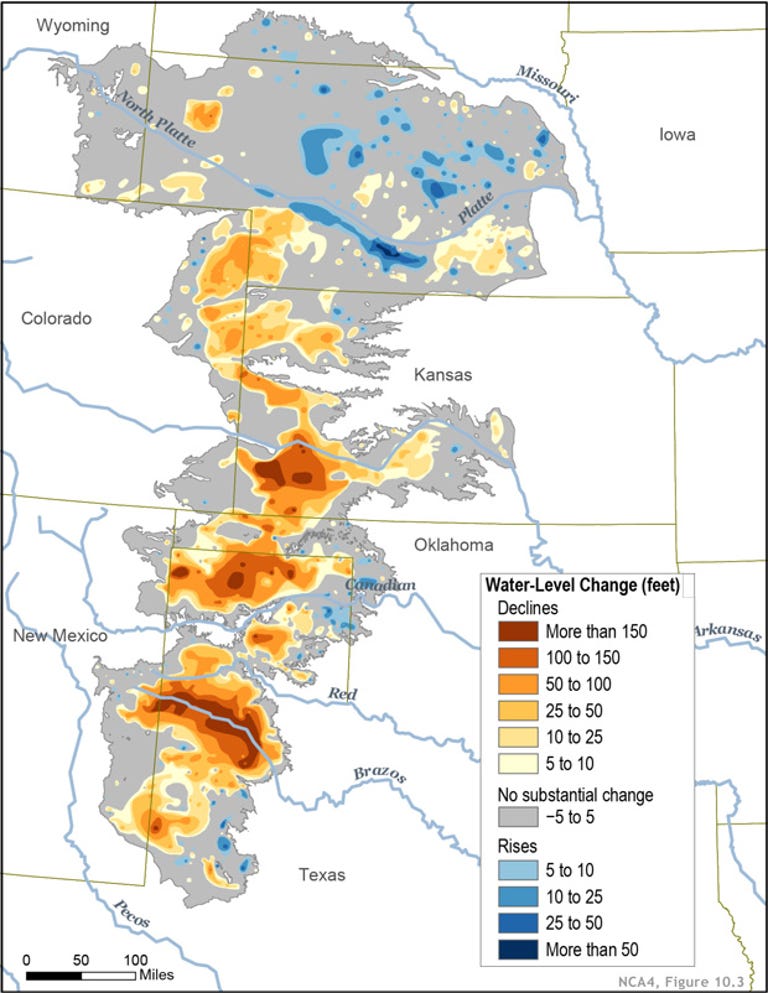


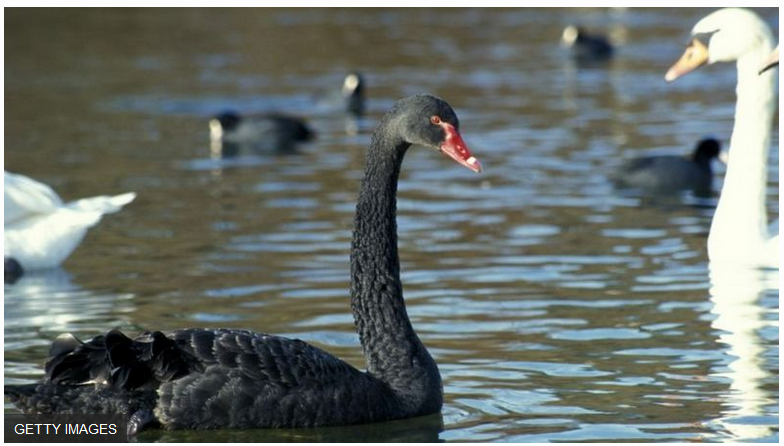


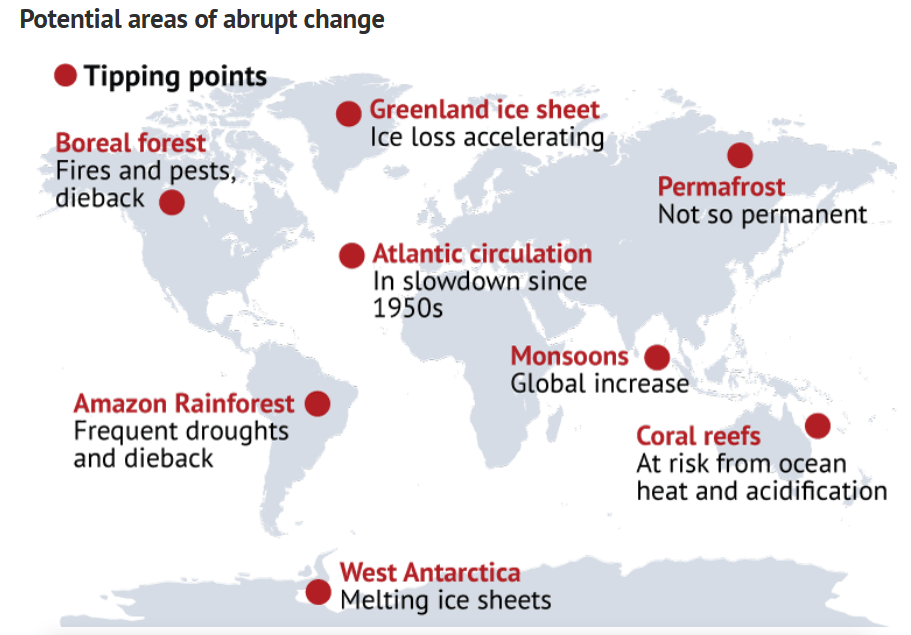
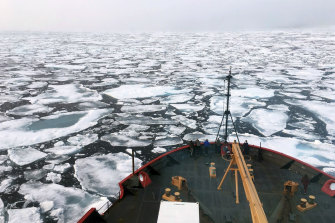

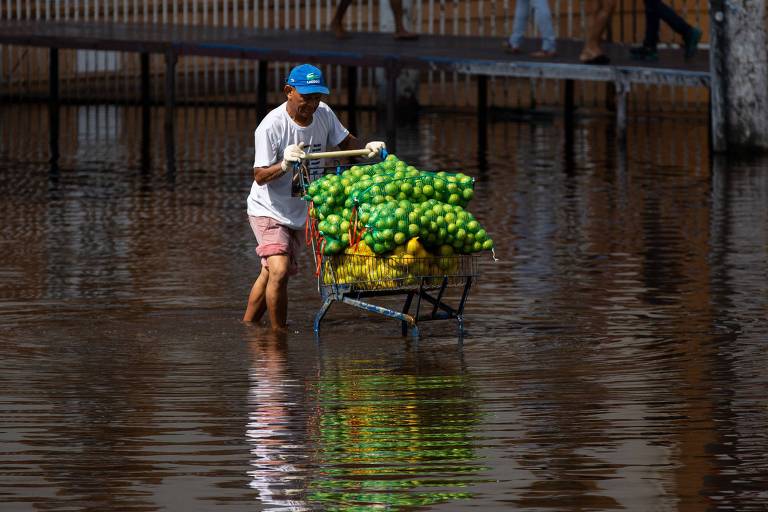


Você precisa fazer login para comentar.