Ian van Coller had scientists annotate his photos to show how climate change is warping geological time around the world.
Ian van Coller – June 30, 2021
Climate change is warping geological time, compressing the time scales of natural processes. In photographs taken around the world, Ian van Coller has documented these shifts, reflected in rocks, sediment, and the shrinking of glaciers. Van Coller collaborates with scientists who annotate his images, pointing out key geological features. He also uses historical photos to show changes, juxtaposing the black-and-white images taken by earlier expeditions with today’s landscapes; peaks once covered in snow are now bare rock.
A mud core from Fairy Lake in Montana, superimposed against the surrounding mountains, reveals thousands of years of vegetative history. Geographer James Benes annotated the photo.Quelccaya Glacier in Peru, seen here in 2017, is receding. The foreground rocks show signs of glacial erosion and were likely still covered 10 years ago. Each layer in the ice represents a year’s worth of snow. Annotated by geographer Carsten Braun.A photograph taken in 2020 shows just how little is left of the glacier at Mount Stanley in Uganda. The photo from a 1906 expedition shows the glacier below Elena Peak; today what’s left is dirty ice, a sign the glacier will soon be gone. (Carsten Braun)At nearby Mount Baker, also in Uganda, the story is similar. Dotted lines are an attempt to estimate the ice seen in earlier expeditions on Semper Peak, which is now bare rock. There is no sign of what the 1906 photo labels Moore Glacier. (Carsten Braun)
Le Mad Capper – by NASA’s Scientific Visualisation Studio. Using real data, this simulation’s volume-rendered clouds depict seven days in 2005 when a category-4 typhoon developed off the coast of China.
Com mais de 300 mil mortes confirmadas no mundo, espalhadas por todos os continentes, a covid-19 já é mais letal que desastres naturais, atentados terroristas e guerras
Renato Vasconcelos e Paulo Beraldo
15 de maio de 2020 | 05h00
Apandemia do novo coronavírus já tem envergadura de desastre. Com mais de 300 mil mortes confirmadas até esta quinta-feira, 14, a covid-19 já matou mais pessoas do que guerras, desastres naturais e atentados terroristas que marcaram a história. Apesar da letalidade da doença, uma grande quantidade de pessoas, incluindo líderes mundiais, continuam a minimizar ou negar a pandemia – que continua a fazer vítimas diárias em todos os continentes.
Para o professor de história da Universidade Federal de Santa Maria (UFSM), João Malaia, o quanto um evento trágico impressiona alguém depende de fatores como a duração, a proximidade de quem morre e a distância física do fenômeno em si. “Muitas mortes em um período curto também tendem a impressionar mais. No caso de uma pandemia, as mortes diárias vão diluindo o sentimento da tragédia, a não ser para aqueles que perdem pessoas próximas”, explica o pesquisador, que coordena um projeto de pesquisa sobre a gripe espanhola no Brasil, o ‘Mais História, por favor!’.
Segundo Malaia, a normalização da morte nos discursos de autoridades como o presidente da República acaba reforçando o sentimento de conformação de parte da população. Olhando para o passado, vê semelhanças na forma como o Brasil lidou com a gripe espanhola. “O governo brasileiro foi muito criticado na época por setores da imprensa por demorar a tomar medidas, principalmente no Rio de Janeiro, então capital federal, quando já se sabia dos casos”, diz.
Imagem aérea mostra o dano causado pelo tsunami na cidade turística de Phuket, na Tailândia, em 26 de dezembro de 2004Reuters
O número de mortes pelo mundo já ultrapassou qualquer desastre natural da história recente. O tsunami de 2004, que varreu países banhados pelo Oceano Índico e considerado o mais mortal da história, vitimou cerca de 230 mil pessoas. O cenário não é muito diferente se observados os contextos regionais e nacionais.
MAIS BAIXAS QUE OS CIVIS DO IRAQUE
Soldado americano observa a derrubada da estátua de Saddam Hussein no centro de Bagdá, em 9 de abril de 2003Goran Tomasevic/Reuters
Na Europa, continente com mais mortos até o momento, somados os quatro países mais afetados pela pandemia – Reino Unido, Itália, França e Espanha – o número de vítimas é maior do que o total de civis mortos nos últimos dez anos da Guerra do Iraque (2009-2019).
EUA
PIOR QUE O VIETNÃ
Corpos de soldados americanos mortos na Batalha do vale Ia Drang, primeira grande derrota do país no Vietnã, em 15 de novembro de 1965Neil Sheehan/The New York Times
Nos Estados Unidos, o número de vítimas do novo coronavírus entre fevereiro e maio – menos de 120 dias – já é maior do que o de militares americanos mortos na Guerra do Vietña (58 mil), que durou 20 anos.
QUASE 30 VEZES O 11 DE SETEMBRO
Equipe de resgate retira homem de uma das torres do World Trade Center, em Nova York, logo após o atentado de 11 de setembro de 2001Shannon Stapleton/Reuters
Seriam necessários mais de 28 atentados iguais aos de 11 de setembro de 2001, que destruiu as torres gêmeas do World Trade Center, para igualar o número de mortos pela covid-19 nos EUA. Já o Estado de Nova York, palco da catástrofe, precisaria presenciar mais de 9 atentados para igualar o número de mortos pela pandemia.
MAIS DE 100 GUERRAS
Parentes de soldados argentinos mortos na Guerra das Malvinas visitam cemitério na ilha pela primeira vez, em 19 de março de 1991Reuters
O Reino Unido, que tomou o posto da Itália de país mais afetado pela pandemia no continente, teria que lutar mais de 130 Guerras das Malvinas para ter o mesmo número de baixas provocadas pelo coronavírus. Se contarmos o número total de mortos na guerra (britânicos e argentinos), seriam necessários mais de 36 conflitos idênticos ao disputado no Atlântico sul.
CUSTO MAIOR QUE A INDEPENDÊNCIA
Quadro retrata a Batalha de San MartinoLuigi Norfini
A Segunda Guerra de Independência da Itália, iniciada em 1859, foi o último episódio no processo de unificação do país. Estima-se que mais de 12 mil vidas foram perdidas durante o conflito, o que equivale a menos da metade das vítimas da pandemia.
1500 ANOS DE TERRORISMO
Mascarados, guerrilheiros do ETA leem anúncio ao vivo na televisão espanhola em 18 de fevereiro de 2004Vincent West/Reuters
Na Espanha, as vítimas da covid-19 somam um número 30 vezes maior do que os mortos em atentados promovidos pela Pátria Basca e Liberdade (ETA). Em 50 anos de atividade, as ações do grupo terrorista vitimaram 584 pessoas. Caso ainda existisse e mantivesse a mesma média de letalidade, o ETA só conseguiria igualar o número de mortes provocadas pela pandemia em 1.586 anos de terrorismo.
ATENTADOS DO ISIS EM PARIS
Brigadistas prestam socorro a feridos perto da boate Bataclan, em 13 de novembro de 2015Christian Hartmann/Reuters
Comparativamente, os mortos pela covid-19 na França correspondem a, aproximadamente, 300 ataques terroristas iguais ao que ocorreu na boate Bataclan, em 25 de novembro de 2015, quando o grupo jihadista Estado Islâmico (ISIS) fez um de seus mais famosos atentados até então.
BRASIL E SÃO PAULO
No caso brasileiro, os mais de 13 mil mortos fazem desastres como o de Brumadinho ficarem pequenos. Teriam que ter ocorrido 52 acidentes iguais ao da cidade mineira para alcançar a mortalidade. O mesmo pode ser dito do massacre do Carandiru. Seriam precisas 122 chacinas para que o número de mortos se igualasse ao do país. Já São Paulo teria que lutar quatro Revoluções Constitucionalistas para igualar as baixas.
REVOLUÇÃO CONSTITUCIONALISTA DE 1932
Soldados paulistas combateram, com armamento precário, as poderosas colunas inimigas. Reprodução feita no dia 02 de junho de 2013, dos originais publicados pelo jornal ‘O Estado de S. Paulo’ durante a cobertura da Revolução Constitucionalista de 1932ARQUIVO/AE
Os corpos dos detentos mortos há dois dias são acondicionados de salas e corredores do IML (Instituto Médico Legal)EPITÁCIO PESSOA/ESTADÃO
Helicóptero do Corpo de Bombeiros e agentes da defesa civil trabalham no resgate dos corpos das vítimas encontrados em um ônibus de funcionários da VALE na região onde ficavam os escritórios da empresa em BrumadinhoWILTON JUNIOR/ ESTADÃO
REVOLUÇÃO TEOCRÁTICA DO IRÃ
Apoiadores do aiatolá Khomeini mostra sua imagem em Teerã, no Irã, durante a revolução islâmica de 1979REUTERS
Na Ásia, onde a pandemia começou, a mortalidade também alcançou níveis históricos. O número de mortos no Irã é duas vezes superior ao número de mortos da Revolução Teocrática que mudou o regime do país em 1979.
EXÉRCITO DE TERRACOTA
Imagem de parte do Exército de Soldados de Terracota de Xian, na ChinaLudovic Marin/ AFP
Na China, o número de mortos sepultados no país já é o equivalente a metade das estátuas do Exército de Terracota, enterradas no túmulo do imperador Qin Shi Huang.
Expediente
Editor executivo multimídia Fabio Sales / Editora de infografia multimídia Regina Elisabeth Silva / Editores assistentes multimídia Adriano Araujo, Carlos Marin, Glauco Lara e William Marioto / Editor de Internacional Cristiano Dias / Reportagem Renato Vasconcelos, Rodrigo Turrer e Paulo Beraldo / Edição de fotografia Sérgio Neves / Foto da capa Juan Carlos Ulate/Reuters / SEO Brenda Zacharias / Designer multimídia Lucas Almeida
Seca em SP revela carros, construções antigas e lixo
19.fev.2015 – As chuvas que têm atingido São Paulo em fevereiro estão recuperando o nível do sistema Cantareira, que fornece água para 6,5 milhões de pessoas na Grande São Paulo. Na montagem, a imagem onde aparece menos água foi feita em dezembro de 2014. Já a foto que mostra a represa mais cheia é deste mês. Com a elevação, carros que surgiram com a seca e não foram retirados voltam a ser encobertos pelas águas Leia mais Estadão Conteúdo
A carcaça de um carro que se tornou uma espécie de símbolo da falta de água no Cantareira, sistema que abastece um terço da população da Grande São Paulo(6,5 milhões de pessoas), foi furtado há 20 anos.
Segundo a SSP (Secretaria de Segurança Pública), após averiguar o número do chassi, a polícia descobriu que o veículo foi furtado em 1995 na cidade de São Paulo.
O caso é investigado pela delegacia de Nazaré Paulista (a 64 km de São Paulo). A polícia ainda não identificou os suspeitos pelo crime.
A carcaça passou a chamar a atenção de quem passava pela região da represa Atibainha, que faz parte do sistema Cantareira, depois que foi grafitada em 2014 pelo artista Mundano. No carro, foi escrito “Bem-vindo ao deserto da Cantareira”, um protesto contra a crise de falta de água.
Os primeiros começaram a aparecer em meados de agosto de 2014, à medida que foram caindo os níveis de água das represas de São Paulo por causa da falta de chuva.
Evelson de Freitas/Agência Estado
Grafite em pilastra na represa Atibainha reproduz carro que virou símbolo da seca
Uma nova animação divulgada pela Nasa mostra como os gases de efeito estufa se comportam ao longo de um ano.
O modelo evidencia que a concentração do gás carbônico ocorre na América do Norte, Europa e norte da Ásia.
Cerca de metade do dióxido de carbono emitido pela queima de combustíveis fósseis permanece na atmosfera; a outra metade é absorvida por plantas e pelos oceanos.
A animação permite ver ainda que os gases não ficam parados, mas se dispersam seguindo padrões climáticos.
A presença dos gases diminui na primavera e no verão do hemisfério norte, quando as plantas absorvem gás carbônico no processo de fotossíntese.
O vídeo usa imagens de 2006. Segundo a agência espacial americana, as concentrações de gás carbônico na atmosfera aumentam ano a ano – o que contribui para o aumento das temperaturas globais.
Objetivo é sensibilizar sobre os impactos locais do aquecimento global; primeiro episódio prevê o tempo no Brasil no ano de 2050
05/09/2014
Agência FAPESP – A Organização Mundial de Meteorologia (OMM) lançou os primeiros episódios de uma série de vídeos com previsões do tempo projetadas para o ano de 2050. A primeira edição traz a previsão para o dia 8 de junho daquele ano no Brasil, apresentada por Claudia Celli, da RPC-TV, afiliada da TV Globo no Paraná.
O objetivo da iniciativa é sensibilizar as pessoas sobre os impactos locais das mudanças climáticas globais. Os vídeos trazem sempre apresentadores de televisão conhecidos em um determinado país – e os cenários são compatíveis com os projetados no quinto relatório do Painel Intergovernamental de Mudanças Climáticas (IPCC).
No caso do Brasil, a previsão é de muita chuva no sul do país e no oeste da Amazônia. A expectativa é que os níveis de chuva para o mês sejam superados em apenas alguns dias, aumentando o risco de inundações e deslizamentos. Para o Nordeste e o leste da Amazônia, a previsão é de seca.
O lançamento dos vídeos pela OMM ocorre em apoio ao pedido do secretário-geral da Organização das Nações Unidas (ONU), Ban Ki-moon, para que governos, empresários e líderes da sociedade civil concordem em agir para lidar com a mudança climática durante a cúpula climática da ONU, marcada para 23 de setembro, a fim de evitar que se concretizem as previsões dos piores cenários.
“A mudança climática está afetando o tempo em todo lugar. Isso torna o clima mais extremo e modifica os padrões estabelecidos. Isso significa mais desastres; mais incerteza”, diz Ban Ki-moon em uma mensagem no vídeo.
A edição sobre o Brasil traz ainda uma entrevista de Celli com José Marengo, pesquisador do Instituto Nacional de Pesquisas Espaciais (Inpe) e membro do Programa FAPESP de Pesquisa sobre Mudanças Climáticas Globais (PFPMCG).
“Nas regiões tropicais, em basicamente todo o Brasil, os aumentos de temperatura no fim do século poderão ultrapassar os 4º C. Em termos de chuva, o padrão muda um pouco. As previsões mostram reduções de chuva no leste da Amazônia e na região Nordeste e aumento de chuva no oeste da Amazônia e no extremo sul do Brasil”, afirma Marengo no vídeo.
“A resposta tem que ser imediata [às mudanças climáticas globais]. Nas próximas décadas tem que se chegar a um acordo internacional, tipo o Protocolo de Kyoto, para reduzir as emissões de gases de efeito estufa, porque reduzir essas emissões é a única forma de poder reduzir o aquecimento e reduzir os impactos à população”, acrescenta o pesquisador.
O vídeo com a previsão para o Japão também já está no ar. Nesta sexta-feira (05/09), será divulgado o boletim meteorológico para a Dinamarca.
Os outros países que terão vídeos sobre a previsão do tempo em 2050 são: Zâmbia, Burkina Faso, Estados Unidos, Bulgária, Filipinas, Bélgica, África do Sul, Islândia, Alemanha e Tanzânia.
Climate change not only means warmer temperatures. It means a tremendous churning of natural processes that human beings rely upon.
Climate change is likely to have a range of complicated impacts affecting all kinds of human activity–from new water patterns that produce more flooding, to lower crop yields that exacerbate hunger in poor places.
The maps here trace the complicated “human dynamics of climate change.” They were developed by the U.K. Met Office (the official British weather forecast service), together with the U.K. Foreign Office and several universities.
They start with a “present-day” picture map, which shows trade in various commodities (wheat, maize, etc), important areas for fishing, routes for shipping and air freight, and regions with high degrees of water stress and political fragility.
Then the maps get into specific issues, based on “business as usual” climate forecasts for 2100, i.e. what will happen if society does nothing to stop global warming from its current track. You can see, for example, how higher temperatures could increase demand for irrigation water; how parts of the world could see increases and decreases in water run-off into rivers; how different areas (like 70% of Asia) are set for more flooding; and how the warmest days in Europe, parts of Asia, and North America are projected to be 6°C warmer.
The poster also has summaries for each region of the world. North Africa, for instance, “is projected to see some of the largest increases in the number of drought days and decreases in average annual water run-off.” North America, meanwhile, is forecast to see an increase in the number of drought days, increasing temperatures on its warmest days, and, depending on the region, both increases and decreases in river flooding.
The overall impression is one of flux. Climate change not only means warmer temperatures. It means a tremendous churning of natural processes that human beings rely on.
* * *
Human dynamics of climate change (UK MetOffice)
The impacts of climate change will not be experienced in isolation, but will affect humans in the context of the way we live
The ‘Human dynamics of climate change’ map aims to illustrate some of the impacts of climate and population change in the context of a globalised world. You can download the map and the supplementary information below:
There are two types of information included in the map – present-day human dynamics, and projected future changes in climate and population between a present day baseline (1981-2010) and the end of the 21st century (2071-2100).
The climate projections shown do not include any assumptions about adaptation or adaptive capacity. They represent the potential long-term influence of climate change on human activity, and may be thought of as a driver of change. This map shows a ‘business as usual’ greenhouse gas concentration scenario ( RCP8.5) that contains no explicit greenhouse gas emissions mitigation, with a ‘middle of the road’ socio-economic scenario ( SSP2) for population change.
To illustrate how the information on the map can be interpreted, an overview of the global picture is included in the supplementary information, and a number of regional case studies are explored on the map itself; these are also included in the link below. However, the different impacts (both positive and negative), and the different contexts in which these impacts occur, interact in multiple, complex ways. We invite you to explore the information and discover the links that mean the most to you.
Summary: A new map, which shows the impact climate change could have on the whole planet by the end of the century if carbon emissions continue to increase, has been developed by scientists. Temperatures on the warmest days of the year are rising by 6°C or more across Europe, parts of Asia and part of North America, it shows. Also an increase in risk of flooding across 70 per cent of Asia, and the number of days of drought increasing in parts of South America, Australia and Southern Africa are illuminated by the new map.
Scientists from the University of Southampton have helped to create a new map, which shows the impact climate change could have on the whole planet by the end of the century, if carbon emissions continue to increase.
The Human Dynamics of Climate Change map, launched at the Foreign and Commonwealth Office was developed by the Met Office Hadley Centre with specific contributions from universities, Government and science organisations.
The map shows a range of potential impacts:
Temperatures on the warmest days of the year rising by 6°C or more across Europe, parts of Asia and part of North America
An increase in risk of flooding across 70 per cent of Asia
The number of days of drought going up by more than 20 per cent in parts of South America, Australia and Southern Africa
Maize yields falling by up to 12 per cent in Central America
Sea temperatures rising by up to 4°C in some parts of the world
Millions of people flooded due to sea level rise, particularly in East, Southeast and South Asia
The map illustrates how climate change could affect the global economy as regions connected by trade are affected by changes in crop yield, droughts, flooding and high temperatures. It also shows how many already water-stressed regions of the world could face an increase in the frequency and duration of droughts, at the same time as an increase in demand for water for agriculture and for the consumption of a growing population.
Professor Robert Nicholls and Dr Sally Brown, from Engineering and the Environment at the University of Southampton, contributed data and research which shows the number of people in coastal regions around the world that could potentially be flooded in the future as sea levels rise.
Dr Brown says: “We know that rising sea levels are already having profound impacts in many parts of the world. We hope that this tool will help scientists, policy makers and governments better understand the threat that climate change poses to our collective future prosperity and security and what actions are needed.”
Foreign Office Minister, Mark Simmonds said: “This map shows how the impacts of climate change on one part of the world will affect countries in other parts of the world, particularly through the global trade in food. This reinforces the point that climate change is a global problem: no country is immune, and we all need to work together to reduce the risks to our shared prosperity and security.”
Dame Julia Slingo, the Met Office Chief Scientist, said: “We’ve used the latest science to assess how potential changes in our climate will impact people around the world. This map presents that information together for the first time. While we see both positive and negative impacts, the risks vastly outweigh any potential opportunities.”
Em editorial, a Folha de São Paulo faz uma leitura sobre as mudanças climáticas no Planeta
O ano de 2015 poderá assistir a uma mudança de sinal na questão da mudança climática planetária. Há indícios de que ela já deixa o terreno estéril das polêmicas ao estilo Fla-Flu para se tornar, cada vez mais, uma preocupação crescente entre empresários e governantes de todos os matizes.
Não têm faltado manifestações nesse sentido. Elas aparecem bem sumarizadas na entrevista de Achim Steiner, diretor-executivo do Programa das Nações Unidas para o Meio Ambiente (Pnuma) ao jornal “Valor Econômico”.
Steiner aposta num bom acordo internacional em Paris, no final de 2015, decisiva reunião de cúpula sobre o clima. Um tratado abrangente e ambicioso reverteria o fiasco de Copenhague (2009), que deveria ter produzido um documento para substituir o Protocolo de Kyoto (1997), extinto em 2012.
Para o diretor do Pnuma, a poluição do carbono –que agrava o efeito estufa e leva ao aquecimento global– não é o preço inevitável do desenvolvimento. Seus argumentos são essencialmente econômicos, e não ideológicos.
Ele aponta a distorção dos subsídios concedidos mundialmente aos combustíveis fósseis (carvão, petróleo e gás natural), principal fonte do carbono lançado na atmosfera por atividades humanas. A conta fica entre US$ 600 bilhões e US$ 700 bilhões anuais e correspondente a cerca de dez vezes os incentivos para energias renováveis, como a eólica (ventos).
Seu exemplo é o Quênia, país que planeja incluir em cinco anos os 75% da população hoje sem acesso à eletricidade –e o fará com 95% de fontes limpas. Poderia ter citado o Brasil, que tem 80% de sua matriz com geração renovável e, nos últimos anos, descobriu os atrativos da energia eólica.
E Achim Steiner não está só. No contexto da opinião pública dos EUA, talvez a mais refratária ao tema do aquecimento global, líderes da política e da economia –democratas e republicanos– também vieram a público para defender que a inação diante dos problemas do clima, hoje, custará caro no futuro cada vez menos distante.
A manifestação apareceu no relatório “Risky Business” (negócio arriscado), com o endosso de pesos pesados como os ex-secretários do Tesouro dos EUA Henry Paulson, Robert Rubin e George Shultz, além de Michael Bloomberg, ex-prefeito de Nova York.
Seu raciocínio é cristalino: por remoto que seja o perigo, faz-se seguro contra incêndio; que sentido haveria, então, em ignorar os riscos do aquecimento global? A resposta será dada, ou não, em Paris.
Summary: NASA successfully launched its first spacecraft dedicated to studying atmospheric carbon dioxide on July 1, 2014. OCO-2 soon will begin a minimum two-year mission to locate Earth’s sources of and storage places for atmospheric carbon dioxide, the leading human-produced greenhouse gas responsible for warming our world, and a critical component of the planet’s carbon cycle.
The Orbiting Carbon Observatory-2, NASA’s first mission dedicated to studying carbon dioxide in Earth’s atmosphere, lifts off from Vandenberg Air Force Base, California, at 2:56 a.m. Pacific Time, July 2, 2014. The two-year mission will help scientists unravel key mysteries about carbon dioxide.
Credit: NASA/Bill Ingalls
NASA successfully launched its first spacecraft dedicated to studying atmospheric carbon dioxide at 2:56 a.m. PDT (5:56 a.m. EDT) Tuesday (July 1, 2014).
The Orbiting Carbon Observatory-2 (OCO-2) raced skyward from Vandenberg Air Force Base, California, on a United Launch Alliance Delta II rocket. Approximately 56 minutes after the launch, the observatory separated from the rocket’s second stage into an initial 429-mile (690-kilometer) orbit. The spacecraft then performed a series of activation procedures, established communications with ground controllers and unfurled its twin sets of solar arrays. Initial telemetry shows the spacecraft is in excellent condition.
OCO-2 soon will begin a minimum two-year mission to locate Earth’s sources of and storage places for atmospheric carbon dioxide, the leading human-produced greenhouse gas responsible for warming our world, and a critical component of the planet’s carbon cycle.
“Climate change is the challenge of our generation,” said NASA Administrator Charles Bolden. “With OCO-2 and our existing fleet of satellites, NASA is uniquely qualified to take on the challenge of documenting and understanding these changes, predicting the ramifications, and sharing information about these changes for the benefit of society.”
OCO-2 will take NASA’s studies of carbon dioxide and the global carbon cycle to new heights. The mission will produce the most detailed picture to date of natural sources of carbon dioxide, as well as their “sinks” — places on Earth’s surface where carbon dioxide is removed from the atmosphere. The observatory will study how these sources and sinks are distributed around the globe and how they change over time.
“This challenging mission is both timely and important,” said Michael Freilich, director of the Earth Science Division of NASA’s Science Mission Directorate in Washington. “OCO-2 will produce exquisitely precise measurements of atmospheric carbon dioxide concentrations near Earth’s surface, laying the foundation for informed policy decisions on how to adapt to and reduce future climate change.”
Carbon dioxide sinks are at the heart of a longstanding scientific puzzle that has made it difficult for scientists to accurately predict how carbon dioxide levels will change in the future and how those changing concentrations will affect Earth’s climate.
“Scientists currently don’t know exactly where and how Earth’s oceans and plants have absorbed more than half the carbon dioxide that human activities have emitted into our atmosphere since the beginning of the industrial era,” said David Crisp, OCO-2 science team leader at NASA’s Jet Propulsion Laboratory in Pasadena, California. “Because of this, we cannot predict precisely how these processes will operate in the future as climate changes. For society to better manage carbon dioxide levels in our atmosphere, we need to be able to measure the natural source and sink processes.”
Precise measurements of the concentration of atmospheric carbon dioxide are needed because background levels vary by less than two percent on regional to continental scales. Typical changes can be as small as one-third of one percent. OCO-2 measurements are designed to measure these small changes clearly.
During the next 10 days, the spacecraft will go through a checkout process and then begin three weeks of maneuvers that will place it in its final 438-mile (705-kilometer), near-polar operational orbit at the head of the international Afternoon Constellation, or “A-Train,” of Earth-observing satellites. The A-Train, the first multi-satellite, formation flying “super observatory” to record the health of Earth’s atmosphere and surface environment, collects an unprecedented quantity of nearly simultaneous climate and weather measurements.
OCO-2 science operations will begin about 45 days after launch. Scientists expect to begin archiving calibrated mission data in about six months and plan to release their first initial estimates of atmospheric carbon dioxide concentrations in early 2015.
The observatory will uniformly sample the atmosphere above Earth’s land and waters, collecting more than 100,000 precise individual measurements of carbon dioxide over Earth’s entire sunlit hemisphere every day. Scientists will use these data in computer models to generate maps of carbon dioxide emission and uptake at Earth’s surface on scales comparable in size to the state of Colorado. These regional-scale maps will provide new tools for locating and identifying carbon dioxide sources and sinks.
OCO-2 also will measure a phenomenon called solar-induced fluorescence, an indicator of plant growth and health. As plants photosynthesize and take up carbon dioxide, they fluoresce and give off a tiny amount of light that is invisible to the naked eye. Because more photosynthesis translates into more fluorescence, fluorescence data from OCO-2 will help shed new light on the uptake of carbon dioxide by plants
OCO-2 is a NASA Earth System Science Pathfinder Program mission managed by JPL for NASA’s Science Mission Directorate in Washington. Orbital Sciences Corporation in Dulles, Virginia, built the spacecraft bus and provides mission operations under JPL’s leadership. The science instrument was built by JPL, based on the instrument design co-developed for the original OCO mission by Hamilton Sundstrand in Pomona, California. NASA’s Launch Services Program at NASA’s Kennedy Space Center in Florida is responsible for launch management. JPL is managed for NASA by the California Institute of Technology in Pasadena.
OCO-2 is the second of five NASA Earth science missions scheduled to launch into space this year, the most new Earth-observing mission launches in one year in more than a decade. NASA monitors Earth’s vital signs from land, air and space with a fleet of satellites and ambitious airborne and ground-based observation campaigns. NASA develops new ways to observe and study Earth’s interconnected natural systems with long-term data records and computer analysis tools to better see how our planet is changing. The agency shares this unique knowledge with the global community and works with institutions in the United States and around the world that contribute to understanding and protecting our home planet.
Aaron Carapella, a self-taught mapmaker in Warner, Okla., has designed a map of Native American tribes showing their locations before first contact with Europeans.
Hansi Lo Wang/NPR
Finding an address on a map can be taken for granted in the age of GPS and smartphones. But centuries of forced relocation, disease and genocide have made it difficult to find where many Native American tribes once lived.
Aaron Carapella, a self-taught mapmaker in Warner, Okla., has pinpointed the locations and original names of hundreds of American Indian nations before their first contact with Europeans.
As a teenager, Carapella says he could never get his hands on a continental U.S. map like this, depicting more than 600 tribes — many now forgotten and lost to history. Now, the 34-year-old designs and sells maps as large as 3 by 4 feet with the names of tribes hovering over land they once occupied.
Carapella has designed maps of Canada and the continental U.S. showing the original locations and names of Native American tribes. View the full map (PDF).
Courtesy of Aaron Carapella
“I think a lot of people get blown away by, ‘Wow, there were a lot of tribes, and they covered the whole country!’ You know, this is Indian land,” says Carapella, who calls himself a “mixed-blood Cherokee” and lives in a ranch house within the jurisdiction of the Cherokee Nation.
For more than a decade, he consulted history books and library archives, called up tribal members and visited reservations as part of research for his map project, which began as pencil-marked poster boards on his bedroom wall. So far, he has designed maps of the continental U.S., Canada and Mexico. A map of Alaska is currently in the works.
What makes Carapella’s maps distinctive is their display of both the original and commonly known names of Native American tribes, according to Doug Herman, senior geographer at the Smithsonian National Museum of the American Indian in Washington, D.C.
This map of Mexico features both the original and commonly known names of some indigenous nations. View the full map (PDF).
Courtesy of Aaron Carapella
“You can look at [Carapella’s] map, and you can sort of get it immediately,” Herman says. “This is Indian Country, and it’s not the Indian Country that I thought it was because all these names are different.”
He adds that some Native American groups got stuck with names chosen arbitrarily by European settlers. They were often derogatory names other tribes used to describe their rivals. For example, “Comanche” is derived from a word in Ute meaning “anyone who wants to fight me all the time,” according to the Encyclopaedia Britannica.
“It’s like having a map of North America where the United States is labeled ‘gringos’ and Mexico is labeled ‘wetbacks,’ ” Herman says. “Naming is an exercise in power. Whether you’re naming places or naming peoples, you are therefore asserting a power of sort of establishing what is reality and what is not.”
Look at a map of Native American territory today, and you’ll see tiny islands of reservation and trust land engulfed by acres upon acres ceded by treaty or taken by force. Carapella’s maps serve as a reminder that the population of the American countryside stretches back long before 1776 and 1492.
Carapella describes himself as a former “radical youngster” who used to lead protests against Columbus Day observances and supported other Native American causes. He says he now sees his mapmaking as another way to change perceptions in the U.S.
“This isn’t really a protest,” he explains. “But it’s a way to convey the truth in a different way.”
Na Argentina, elas foram reprimidas por baionetas quando indagaram, em 1977, pelos filhos presos. Os generais golpistas debocharam: “son las locas de Plaza de Mayo“. Obstinadas, não desistiram. Desafiaram o terror e continuaram ocupando a Praça de Maio, desfilando o seu protesto semanal diante da Casa Rosada e da catedral até que, finamente, reconhecidas pela sociedade, contribuíram para o fim da ditadura e a prisão dos torturadores.
No Brasil, vários movimentos nos fizeram ouvir a voz de quem foi silenciado. No entanto, como ninguém entende línguas indígenas, nem se interessa por aprendê-las, não se escuta o clamor dos índios, seja de mães indígenas por seus filhos ou de índios por seus pais desaparecidos. Desta forma, os índios, sempre invisíveis na historia do Brasil, ficaram de fora das narrativas e não figuram nas estatísticas dos desaparecidos políticos. Na floresta, não há praças de maio.
Mas agora isso começa a mudar. Relatório do Comitê Estadual da Verdade do Amazonas, que será em breve publicado pela Editora Curt Nimuendajú, de Campinas (SP), dá voz aos índios e mapeia os estragos, comprovando que na Amazônia, mais do que militantes de esquerda, a ditadura eliminou índios, entre outros, Cinta-Larga e Surui (RO/MT), Krenhakarore na rodovia Cuiabá-Santarém, Kanê ou Beiços-de-Pau do Rio Arinos (MT), Avá-Canoeiro (GO), Parakanã e Arara (PA), Kaxinawa e Madiha (AC), Juma, Yanomami e Waimiri-Atroari (AM/RR).
O foco do primeiro relatório, de 92 páginas, já encaminhado à Comissão Nacional da Verdade (CNV), incide sobre os Kiña, denominados também como Waimiri-Atroari, cujos desaparecidos são conhecidos hoje por seus nomes, graças a um trabalho cuidadoso que ouviu índios em suas línguas, consultou pesquisadores e indigenistas, fuçou arquivos e examinou documentos, incluindo desenhos que mostram índios metralhados por homens armados com revólver, fuzil, rifles, granadas e cartucheira, jogando bombas sobre malocas incendiadas.
Os desaparecidos
De noite, nas malocas, os sobreviventes narram a história da violência sofrida, que começou a ser escrita e desenhada por crianças, jovens e adultos alfabetizados na língua Kiña pelos professores Egydio e Doroti Schwade com o método Paulo Freire. Toda a aldeia Yawará, no sul de Roraima, participou do processo, em 1985 e 1986, até mesmo crianças de colo. A comunicação foi facilitada pelo fato de o casal morar lá com seus quatro filhos pequenos, antes de ser expulso pelo então presidente da Funai, Romero Jucá, lacaio subserviente das empresas mineradoras.
Todo o processo de alfabetização ocorreu num clima que iniciou com a narração oral das historias e continuou com a criação dos desenhos, a leitura dos desenhos, a discussão sobre eles e, finalmente, com a escrita alfabética.
Durante esse período, Egydio registrou, com ajuda de Doroti, as narrativas contadas por quem testemunhou os fatos ou por quem ouviu falar sobre eles. Os primeiros textos escritos por recém-alfabetizados, ilustrados por desenhos, revelaram “o método e as armas usadas para dizimá-los: aviões, helicópteros, bombas, metralhadoras, fios elétricos e estranhas doenças. Comunidades inteiras desapareceram depois que helicópteros com soldados sobrevoaram ou pousaram em suas aldeias” – diz o relatório.
Com a abertura da rodovia BR-174 e a entrada das empresas mineradoras, muitas outras aldeias foram varridas do mapa. “Pais, mães e filhos mortos, aldeias destruídas pelo fogo e por bombas. Gente resistindo e correndo pelos varadouros à procura de refúgio em aldeia amiga. A floresta rasgada e os rios ocupados por gente agressiva e inimiga. Esta foi a geografia política e social vivenciada pelo povo Kiña desde o início da construção da BR-174, em 1967, até sua inauguração em 1977” – segundo o relatório.
Alguns sobreviventes refugiados na aldeia Yawará conviveram durante dois anos com Egydio e Doroti. Lá, todas as pessoas acima de dez anos eram órfãs, exceto duas irmãs, cuja mãe sobreviveu ao massacre. O relatório transcreve a descrição feita pelo índio Panaxi:
“Civilizado matou com bomba” – escreve Panaxi ao lado do desenho, identificando um a um os mortos com seus nomes: Sere, Podanî, Mani, Priwixi, Akamamî, Txire, Tarpiya.
A eles se somaram outros de uma lista feita por Yaba: Mawé, Xiwya, Mayede – marido de Wada, Eriwixi, Waiba, Samyamî – mãe de Xeree, Pikibda, a pequena Pitxenme, Maderê, Wairá – mulher de Amiko, Pautxi – marido de Woxkî, Arpaxi – marido de Sidé, Wepînî – filho de Elsa, Kixii e seu marido Maiká, Paruwá e sua filha Ida, Waheri, Suá – pai de Warkaxi, sua esposa e um filho, Kwida – pai de Comprido, Tarakña e tantos outros.
Quem matou
A lista é longa, os mortos têm nomes, mas às vezes são identificados pelo laço de parentesco: “a filha de Sabe que mora no Mrebsna Mudî, dois tios de Mário Paruwé, o pai de Wome, uma filha de Antônio”, etc. O relatório se refere ao“desaparecimento de mais de 2.000 Waimiri-Atroari em apenas dez anos”. Na área onde se localiza hoje a Mineradora Taboca (Paranapanema) desapareceram pelo menos nove aldeias aerofotografadas pelo padre Calleri, em 1968, em sobrevoos a serviço da FUNAI. Os alunos da aldeia Yawará desenharam casas e escreveram ao lado frases como:
– Apapa takweme apapeme batkwapa kamña nohmepa [o meu pai foi atirado com espingarda por civilizado e morreu] – escreveu Pikida, ao lado do desenho que ilustra o fato.
– Taboka ikame Tikiriya yitohpa. Apiyamyake, apiyemiyekî? [Taboca chegou, Tikiria sumiu, por que? Por que?]
A resposta pode ser encontrada no ofício 042-E2-CONF. do Comando Militar da Amazônia, de 21/11/1974, assinado pelo General Gentil Nogueira, que recomendava o uso da violência armada contra os índios, segundo o relatório encaminhado à Comissão Nacional da Verdade. Era uma política de Estado a serviço de interesses privados, implementada com métodos de bandidagem.
Um mês e meio depois, o sertanista Sebastião Amâncio da Costa, nomeado chefe de Frente de Atração Waimiri-Atroari (FAWA), em entrevista ao jornal O Globo (06/01/1975), assumiu de público as determinações do general Gentil, declarando que faria “uma demonstração de força dos civilizados que incluiria a utilização de dinamite, granadas, bombas de gás lacrimogêneo e rajadas de metralhadoras e o confinamento dos chefes índios em outras regiões do País”.
O resultado de toda essa lambança é descrito por Womé Atroari, em entrevista à TV Brasil, relatando um ataque aéreo a uma aldeia e outros fatos que presenciou:
– Foi assim tipo bomba, lá na aldeia. O índio que estava na aldeia não escapou ninguém. Ele veio no avião e de repente esquentou tudinho, aí morreu muita gente. Foi muita maldade na construção da BR-174. Aí veio muita gente e pessoal armado, assim, pessoal do Exército, isso eu vi. Eu sei que me lembro bem assim, tinha um avião assim um pouco de folha, assim, desenho de folha, assim, um pouco vermelho por baixo, só isso. Passou isso aí, morria rapidinho pessoa. Desse aí que nós via.
Os tratores que abriam a estrada eram vistos pelos índios como tanques de guerra. “Muitas vezes os tratores amanheciam amarrados com cipós.Essa era uma maneira clara de dizer que não queriam que as obras continuassem. Como essa resistência ficou muito forte, o Departamento Estadual de Estradas de Rodagem do Amazonas-DER-AM, inicialmente responsável pela construção, começou a usar armas de fogo contra os indígenas”.
Sacopã e Parasar
O relatório informa que “as festas que reuniam periodicamente os Waimiri-Atroari foram aproveitadas pelo PARASAR para o aniquilamento dos índios”. Conta detalhes. Registra ainda o desaparecimento de índios que se aproximaram, em agosto de 1985, do canteiro de obras da hidrelétrica do Pitinga, então em construção:
“É muito provável que tenham sido mortos pela Sacopã, uma empresa de jagunços, comandada por dois ex-oficiais do Exército e um da ativa, subordinado ao Comando Militar da Amazônia, empresa muito bem equipada, que oferecia na época serviços de “limpeza” na floresta à Paranapanema no entorno de seus projetos minerais. Os responsáveis pela empresa foram autorizados pelo Comando Militar da Amazônia a manter ao seu serviço 400 homens equipados com cartucheiras 20 milímetros, rifle 38, revolveres de variado calibre e cães amestrados”.
Os autores do relatório dão nomes aos bois, esclarecendo que quem comandava a Sacopã no trabalho de segurança da Mineração Taboca/Paranapanema e no controle de todo acesso à terra indígena eram dois militares da reserva: o tenente Tadeu Abraão Fernandes e o coronel reformado Antônio Fernandes, além de um coronel da ativa, João Batista de Toledo Camargo, então chefe de polícia do Comando Militar da Amazônia.
É Rondon de cabeça pra baixo: “Matar ainda que não seja preciso; morrer nunca”, num processo iniciado com o colonizador e ainda não concluído. Na Amazônia, o cônego Manoel Teixeira, irmão do governador Pedro Teixeira, em carta ao rei de Portugal, em 5 de janeiro de 1654, escrita no leito da morte, na hora da verdade, declara que “no espaço de trinta e dois anos, são extintos a trabalho e a ferro, segundo a conta dos que ouviram, mais de dois milhões de índios de mais de quatrocentas aldeias”.
O relatório é um bom começo, porque evidencia que os índios precisam de uma Comissão da Verdade não apenas para os 21 anos de ditadura militar, mas para os 514 anos de História em que crimes foram e continuam sendo cometidos contra eles. Assim, podem surgir praças de maio dentro das malocas para que o Brasil generoso e solidário cobre mudanças radicais na política indigenista do país, impedindo que o Estado continue a serviço de interesses privados escusos.
The other day, as she was priming her re-election campaign, Brazilian President Dilma Rousseff hit a speed bump. There she was, racing across the country to launch shiny public-works projects ahead of the World Cup, and the only thing those annoying journalists wanted to know was if the airports would be renovated on time and up to “FIFA standards.” The reference, of course, was to the rigorous Switzerland-based global soccer authority. “The airports will not be FIFA-standard,” she shot back. “They will be Brazil-standard airports.”
And there it was, in a sound bite, the official spin on Brazil’s complicated moment in the sun, a candid take on the rolling public-relations disaster that has been this country’s relationship with the wider world and its international gatekeepers. Rousseff’s prickly riposte might have been calculated. With presidential elections scheduled for October, she has been struggling in the polls. Hardly a week passes without some angry klatsch or another taking the streets — not least because of Brasilia’s perceived weak hand in dealing with those overweening bean counters from Zurich. A mini-genre of anti-FIFA articles has bloomed here and abroad. It’s about time the Brazilians kicked back, she said.
It’s an odd moment to circle the wagons. Brazil is days away from the curtain call for the crown event of the most popular sport on the planet. Two years from now, Rio de Janeiro will stage the Summer Olympics, drawing hundreds of thousands of athletes and tourists, plus billions of television viewers. And yet nationalism and resentment have flared, and with them memories of times that Brazilians had imagined were behind them. “FIFA go home,” says a message stenciled in white on the pavement of Copacabana, Rio’s signature beachfront neighborhood.
Squint a little and you can see the faded graffiti of another cranky time, some three decades ago, when international creditors were banging on Brazil’s door for their due and the International Monetary Fund was their policeman. FIFA Go Home! is the direct heir to IMF Go Home!
This is passing strange. Brazil, with the world’s seventh-largest economy, traffics in a globalized world and its signifiers and acronyms, from the Gini coefficient, which measures economic inequality, to the International Organization for Standardization, which sets proprietary, industrial and commercial standards. When the country excels, Brasilia trumpets the achievement. The nation’s traditionally skewed income inequality score has improved since the beginning of the last decade, even as most fast-growing developing nations become more lopsided. When the country flops, such as in the PISA — the Organization for Economic Cooperation and Development’s yardstick for 15-year-olds, measured by standardized scholastic tests (Brazil is a lowly 58th on a scale of 65 nations) — the official handlers rush to print disclaimers. Then there’s the mother of all acronyms, the WTO. Not only does a Brazilian, Roberto Azevedo, head the World Trade Organization, few countries have been as aggressive as his in wielding its authority, taking protectionists to task 26 times since 1995.
That’s one of the big reasons that Brazilians revere soccer. Roberto DaMatta, the brilliant anthropologist, nailed it when he said that futebol isn’t some opiate for the witless. Brazilians love the game because it is fair, has transparent rules and is played on a level playing field. What counts on the pitch is how you play, not who you know. It’s a scale model of a better world. The current World Cup anger notwithstanding, Brazilians have always been proud of their FIFA standing (currently fourth), and they will remind visitors that they got there the proper way: by beating the best.
More than an ankle kick at Brazil’s intrusive outsiders, Rousseff’s FIFA outburst was essentially the declaration of an era. To her predecessor, Luiz Inacio Lula da Silva, Brazil was destined for glory. He pushed for a seat on the United Nations Security Council and a nuclear energy deal with Iran. He opened 40 new embassies abroad. Bagging the World Cup was part of the package. Brazil “will now with great pride do its homework,” he promised the FIFA brass in Zurich. That was then.
To contact the writer of this article: Mac Margolis at macmargolis@terra.com.br.
To contact the editor responsible for this article: James Gibney at jgibney5@bloomberg.net.
Las imágenes de esta semana difieren radicalmente del mensaje oficial respecto del Mundial.
Tres imágenes de Brasil esta semana parecieron convertir en un abismo la distancia que separa la realidad de algunos mensajes oficiales sobre el Mundial que comienza en 13 días.
Una de ellas mostró a un grupo de profesores en huelga rodeando el autobús de la selección brasileña en Río de Janeiro el lunes, reclamando por los costos astronómicos de la Copa. Otra imagen salió de Brasilia cuando policías a caballo lanzaron gas lacrimógeno a activistas anti-Mundial e indígenas con arcos y flechas cerca del moderno estadio mundialista.
La tercera apareció en las redes sociales: un texto compartido por la directora ejecutiva del Comité Organizador Local (COL) de la Copa diciendo que “lo que había de ser gastado, robado, ya fue”.
¿Qué dicen estas imágenes acerca del Mundial que llega a Brasil?
1. Falla de seguridad
El cerco de manifestantes al bus de la selección brasileña fue considerado una falla de seguridad
De pronto, decenas de manifestantes rodearon el vehículo, lo tapizaron de adhesivos con reclamos gremiales y algunos llegaron a golpearlo. La situación demoró varios minutos el avance del bus.
La protesta buscó mostrar “el tamaño de la crisis que existe en Brasil en relación a la educación”, declaró allí Vera Nepomuceno, miembro del sindicato de profesores de Río. Uno de los gritos de los manifestantes decía que “un educador vale más que Neymar”.
Pero la escena también expuso fallas en el operativo de seguridad montado para proteger a las estrellas verde-amarelas, que fue fácilmente vulnerado por los docentes.
“El sistema de seguridad no esperaba semejante osadía por parte de los manifestantes”, dijo Paulo Storani, experto en seguridad pública y exdirector del Batallón de Operaciones Especiales (BOPE) de Río, a BBC Mundo.
Este hecho llevó al gobierno de Dilma Rousseff a pedir al Ejército que asuma la seguridad de aeropuertos, hoteles y calles donde pasarán las 32 selecciones del Mundial, informó el jueves el diario O Globo.
Los ministros de Rousseff insisten en que los extranjeros que vengan a la Copa estarán seguros.
Pero Storiani sostuvo que la imagen de esta semana fue preocupante. “Si hubiera alguna manifestación que pueda llegar a algo próximo o peor de lo que ocurrió el lunes, hay posibilidades de crear una crisis en la Copa, porque es lógico que cualquier delegación extranjera va a exigir un mínimo de seguridad”, indicó.
2. Gases, arcos y flechas
Una imagen impensable a días del Mundial en Brasil
Cuando Brasil fue elegido en 2007 como sede del Mundial de este año, sus autoridades esperaban que el evento proyectase al planeta la imagen de un país pujante y en desarrollo.
Pero la foto que salió el martes de Brasilia, con policías montados lanzando gases lacrimógenos a activistas anti-Copa e indígenas apuntando con arcos y flechas a los uniformados, muestra otra cosa.
Fue una de las tantas protestas de grupos sociales en Brasil por los US$11.000 millones que costó organizar el Mundial. Y los indígenas, que estaban en la capital para oponerse a un proyecto que cambia las reglas de demarcación de sus tierras, se unieron en el momento a la marcha.
La confrontación ocurrió cuando más de 1.000 manifestantes intentaron acercarse al Estadio Nacional de Brasilia y la policía lo impidió con gases lacrimógenos.
En medio de la confusión, algunos indígenas llegaron a lanzar flechas, una de las cuales hirió levemente a un policía.
Los incidentes obligaron a cancelar la exhibición de la Copa del Mundo en el estadio, el cual tendrá un costo cercano a US$850 millones, cerca del triple de lo proyectado inicialmente.
“Brasil fue muy ingenuo con el Mundial: se creía que sólo iba a ganar”, dijo Renzo Taddei, un antropólogo de la Universidad Federal de São Paulo especializado en conflictos sociales.
Pero agregó que imágenes como las del martes en Brasilia muestran otra cosa y, respecto a los indígenas, exponen un viejo conflicto acerca de sus derechos “que nunca se resolvió”.
3. Copa y corrupción
Este mensaje en Instagram desató un debate.
Esta imagen de un texto contra las protestas en el Mundial apareció en la red social Instagram y rápidamente se volvió viral y polémica.
Quien la publicó en su cuenta personal el martes fue Joana Havelange, directora ejecutiva del COL del Mundial, nieta del expresidente de la FIFA Joao Havelange e hija del expresidente de la Confederación Brasileña de Fútbol (CBF), Ricardo Teixeira.
“Lo que había de ser gastado, robado, ya fue. Si era para protestar, tenía que haberse hecho antes”, se lee en un pasaje del texto.
La controversia por la referencia a robos llevó a un diputado estatal de Río, Marcelo Freixo, a solicitar al Ministerio Público que exija explicaciones a Havelange.
El COL indicó luego que la autoría de la carta no habría sido de su directora y ésta negó vía internet que haya prestado atención a la frase sobre los robos, que negó compartir y retiró del texto.
Pero la imagen del texto inicial rozó un nervio sensible en un país donde muchos creen que el Mundial fue aprovechado por corruptos y descreen del discurso oficial sobre el “legado” del evento.
“Cualquiera que haya acompañado la Copa sabe que la probabilidad de tener mucho robo de recursos públicos en esas obras de infraestructura y demás es muy alta”, dijo Claudio Abramo, director ejecutivo de Transparencia Brasil.
Abramo señaló que el COL no manejó dinero público para el Mundial, pero dijo que “por la posición que ocupa tal vez (Havelange) sepa cosas que sería bueno que explicase”.
Paulo Ito’s artwork in São Paulo has been shared thousands of times online.
BY VINCENT BEVINS May 27, 2014, 10:30 a.m.
A work of graffiti here has become an overnight global symbol, subverting official representations of Brazil and placing street artist Paulo Ito unexpectedly in the middle of the battle to define the country’s image during next month’s World Cup.
In the untitled work on the fence of a local elementary school, a black child sits down to eat, only to be presented with a soccer ball on a plate. It went around the world quickly, Ito thinks, because it “brought together what a lot of people are thinking.”
From just two Facebook posts, the spray paint and latex image was shared more than 96,000 times, even before being subsequently reported on in numerous countries.
The simple message was obvious, even if it is metaphorical. Brazil’s poorest already receive monthly stipends for basic goods, and few of the thousands of World Cup protesters who have been on the streets ever mention food, instead focusing on cost overruns at stadiums and a shortage of quality education, healthcare and housing.
But like much else during the turbulent time before the games start, Ito’s image has taken on a different scale abroad than it has at home. Here it has even been used by those whose politics Ito considers unscrupulous, underlining the difficulty of nailing down a clear aesthetic message for the world’s cameras, which will arrive all too soon.
“Everything tends to be taken as from one side or the other, which doesn’t make sense. Right now, even the protesters don’t know what their actions will lead to, since the situation is so complex,” says Ito, 36, who’s been active in the street art scene here for 14 years. “I want the World Cup to be a failure for FIFA but a victory for the Brazilian people.”
The clash of ideas and representation over the World Cup is complex as about half the country currently thinks it will be bad overall for Brazil. At the moment, some insist that “there will be no World Cup,” saying a corrupted event should be disrupted in the name of other progressive social causes. Others have extensive complaints but are worried about linking them to the World Cup and how Brazil could look if things go the wrong way.
Still others, those in the right-leaning political opposition, may generally want to present a strong Brazil to the world but know that a poorly executed competition boosts their electoral chances in October. In the protest movement, literal fights have broken out over flags and images raised in the streets.
Then there is FIFA, soccer’s governing body, which last week presented the official World Cup video, featuring Pitbull and Jennifer Lopez and shot in Miami, alongside a gaggle of old-school Brazil Carnaval stereotypes that were widely condemned here.
Artistically, Ito’s work is firmly grounded in the tradition of São Paulo street art, which is as well-known here as it is underappreciated abroad. Its colors and fine features remind the viewer of Os Gemeos, a São Paulo graffiti duo who have garnered some international success and have worked with Ito.
But Ito says his main inspiration is pixação, the black latex paint spelling out tag names aggressively and illegally across the city in an extraterrestrial-meets-Druidic-runes script.
“People think they are representing Brazil because they do something very tropical, with some Indians. … but that’s not what we are,” says Ito. In fact, São Paulo, South America’s largest city and host of the opening match on June 12, “is chaos in concrete.”
But the viral image may already be more famous abroad than it is here. It took on a life of its own largely because a right-wing Brazilian Facebook page called TV Revolta used it to highlight its message.
“They think that everything that happens in the country is the fault of [Worker’s Party President] Dilma Rousseff. I find that type of thinking stupid,” says Ito, who says it’s important to praise the real advances made in the country while also pointing out misplaced priorities. “But we’re still very far from perfection … let’s show the world what we are, and not what some want to show or what others wish we looked like.”
Courtesy Survival International. Davi Kopenawa, a Yanomami shaman, who has been fighting for his peoples rights for more than 20 years will be in California in April to speak about protecting the rainforest and his spiritual life. Kopenawa is seen here surrounded by Yanomami children.
“It’s very important to talk to everybody here. We don’t want what happened 500 years ago to happen again. We, the Yanomami people, don’t want to die again,” said Davi Kopenawa in an interview with ICTMN at the end of April.
Kopenawa, an internationally known advocate for the Yanomami people of Brazil and the rainforest, was in San Francisco at the end of April to meet with activists, scholars and political officials to alert them to an escalating crisis involving gold miners in Yanomami territory and to speak about his book “The Falling Sky.”
For the interview on April 25th, Kopenawa sat down with ICTMN along with his interpreter and friend, Fiona Watson, Research Director for Survival Internationaland longtime ally of the Yanomami and other indigenous peoples of Brazil.
During the 35 minute conversation Kopenawa began by asserting how dangerous the gold mining operations have been for the people and the environment in their territory.
“The gold miners are people with lots of vices. They bring alcohol, they bring illnesses. They couldn’t find jobs in the cities and got no help from the government and the only thing they want to do is get gold from Indigenous Peoples territories. They have spread all over our land.
“The gold miners (garimpeiros) only work in the rivers,” he explained. “They use mercury to clean and separate the gold from the sand. When they wash the gold with mercury, the mercury sinks to the bottom of the river bed. The communities who live downstream use this water for drinking, washing and bathing. The fish also swallow mercury when they are eating which in turn affects the people who eat the fish. So the Yanomami get ill from mercury poisoning. That’s how the mercury contaminates our place.”
Kopenawa also emphasized that there are laws currently being proposed in Brazil that would make it easier for miners and others to invade indigenous territories. Watson noted that the indigenous communities and their allies such as SI are very worried about three potential laws in particular: PEC 215 is a constitutional amendment that would allow congress, which has members influenced by a strong anti-indigenous lobby, to be involved with demarcation of land; Portaria 303 which would prohibit extending any indigenous territory and that indigenous rights to use their resources would not extend to preventing large scale hydro-electric and mining projects; and Law Project 1610 would open up all indigenous territories to large scale mining (and there were already hundreds of petitions to start mining in Yanomani territory).
“I will talk about these things,” Kopenawa said in regards to his then upcoming presentations (he later spoke with California Governor Jerry Brown about the mining issues).
“I want to talk about the concerns of the Yanomami people. We are beginning to get nervous and sad because the government is preparing to invade our territory even though it is demarcated and recognized by law.”
He stated that his book, “The Falling Sky,” explains those concerns and how the Yanomami are guardians of their region of the earth.
“It is important to explain this to the city people who know about their land and mountains and places but we Yanomami needed a book to explain things to white people so they would know our story. We are guardians of the knowledge of our region of earth, of the mountains and the rivers. For us, the forest is a thing of great beauty and it is our story. Some white people think that the Yanomami know nothing, so for this reason I thought about writing a book about the traditional knowledge of the Yanomami, my people.”
At the end of the interview, Kopenawa re-iterated his principal message to the people of the United States.
“All we Indigenous Peoples in Brazil are very worried because of the project to mine in the Yanomami’s territory and in the territories of other indigenous brothers and sisters. We Yanomami people don’t want mining because we don’t want to suffer and die of the white peoples’ diseases. Mining will not bring positive benefits to the Indigenous Peoples. It will only bring a lot of diseases and problems and fights with the indigenous people. For this reason all we Indigenous Peoples are against mining.
“I, Davi Kopenawa Yanomami, an indigenous leader, ask for support from the American people not to allow mining to start in the Yanomami territory. I would like you to help to defend the lungs of the earth. I thank you for your strength. Thank you very much.”
Capital in the Twenty-First Centuryby Thomas Piketty, translated from the French by Arthur GoldhammerBelknap Press/Harvard University Press, 685 pp., $39.95
Thomas Piketty in his office at the Paris School of Economics, 2013. Emmanuelle Marchadour
Thomas Piketty, professor at the Paris School of Economics, isn’t a household name, although that may change with the English-language publication of his magnificent, sweeping meditation on inequality, Capital in the Twenty-First Century. Yet his influence runs deep. It has become a commonplace to say that we are living in a second Gilded Age—or, as Piketty likes to put it, a second Belle Époque—defined by the incredible rise of the “one percent.” But it has only become a commonplace thanks to Piketty’s work. In particular, he and a few colleagues (notably Anthony Atkinson at Oxford and Emmanuel Saez at Berkeley) have pioneered statistical techniques that make it possible to track the concentration of income and wealth deep into the past—back to the early twentieth century for America and Britain, and all the way to the late eighteenth century for France.
The result has been a revolution in our understanding of long-term trends in inequality. Before this revolution, most discussions of economic disparity more or less ignored the very rich. Some economists (not to mention politicians) tried to shout down any mention of inequality at all: “Of the tendencies that are harmful to sound economics, the most seductive, and in my opinion the most poisonous, is to focus on questions of distribution,” declared Robert Lucas Jr. of the University of Chicago, the most influential macroeconomist of his generation, in 2004. But even those willing to discuss inequality generally focused on the gap between the poor or the working class and the merely well-off, not the truly rich—on college graduates whose wage gains outpaced those of less-educated workers, or on the comparative good fortune of the top fifth of the population compared with the bottom four fifths, not on the rapidly rising incomes of executives and bankers.
It therefore came as a revelation when Piketty and his colleagues showed that incomes of the now famous “one percent,” and of even narrower groups, are actually the big story in rising inequality. And this discovery came with a second revelation: talk of a second Gilded Age, which might have seemed like hyperbole, was nothing of the kind. In America in particular the share of national income going to the top one percent has followed a great U-shaped arc. Before World War I the one percent received around a fifth of total income in both Britain and the United States. By 1950 that share had been cut by more than half. But since 1980 the one percent has seen its income share surge again—and in the United States it’s back to what it was a century ago.
Still, today’s economic elite is very different from that of the nineteenth century, isn’t it? Back then, great wealth tended to be inherited; aren’t today’s economic elite people who earned their position? Well, Piketty tells us that this isn’t as true as you think, and that in any case this state of affairs may prove no more durable than the middle-class society that flourished for a generation after World War II. The big idea of Capital in the Twenty-First Century is that we haven’t just gone back to nineteenth-century levels of income inequality, we’re also on a path back to “patrimonial capitalism,” in which the commanding heights of the economy are controlled not by talented individuals but by family dynasties.
It’s a remarkable claim—and precisely because it’s so remarkable, it needs to be examined carefully and critically. Before I get into that, however, let me say right away that Piketty has written a truly superb book. It’s a work that melds grand historical sweep—when was the last time you heard an economist invoke Jane Austen and Balzac?—with painstaking data analysis. And even though Piketty mocks the economics profession for its “childish passion for mathematics,” underlying his discussion is a tour de force of economic modeling, an approach that integrates the analysis of economic growth with that of the distribution of income and wealth. This is a book that will change both the way we think about society and the way we do economics.
1.
What do we know about economic inequality, and about when do we know it? Until the Piketty revolution swept through the field, most of what we knew about income and wealth inequality came from surveys, in which randomly chosen households are asked to fill in a questionnaire, and their answers are tallied up to produce a statistical portrait of the whole. The international gold standard for such surveys is the annual survey conducted once a year by the Census Bureau. The Federal Reserve also conducts a triennial survey of the distribution of wealth.
These two surveys are an essential guide to the changing shape of American society. Among other things, they have long pointed to a dramatic shift in the process of US economic growth, one that started around 1980. Before then, families at all levels saw their incomes grow more or less in tandem with the growth of the economy as a whole. After 1980, however, the lion’s share of gains went to the top end of the income distribution, with families in the bottom half lagging far behind.
Historically, other countries haven’t been equally good at keeping track of who gets what; but this situation has improved over time, in large part thanks to the efforts of the Luxembourg Income Study (with which I will soon be affiliated). And the growing availability of survey data that can be compared across nations has led to further important insights. In particular, we now know both that the United States has a much more unequal distribution of income than other advanced countries and that much of this difference in outcomes can be attributed directly to government action. European nations in general have highly unequal incomes from market activity, just like the United States, although possibly not to the same extent. But they do far more redistribution through taxes and transfers than America does, leading to much less inequality in disposable incomes.
Yet for all their usefulness, survey data have important limitations. They tend to undercount or miss entirely the income that accrues to the handful of individuals at the very top of the income scale. They also have limited historical depth. Even US survey data only take us to 1947.
Enter Piketty and his colleagues, who have turned to an entirely different source of information: tax records. This isn’t a new idea. Indeed, early analyses of income distribution relied on tax data because they had little else to go on. Piketty et al. have, however, found ways to merge tax data with other sources to produce information that crucially complements survey evidence. In particular, tax data tell us a great deal about the elite. And tax-based estimates can reach much further into the past: the United States has had an income tax since 1913, Britain since 1909. France, thanks to elaborate estate tax collection and record-keeping, has wealth data reaching back to the late eighteenth century.
Exploiting these data isn’t simple. But by using all the tricks of the trade, plus some educated guesswork, Piketty is able to produce a summary of the fall and rise of extreme inequality over the course of the past century. It looks like Table 1 on this page.
As I said, describing our current era as a new Gilded Age or Belle Époque isn’t hyperbole; it’s the simple truth. But how did this happen?
2.
Piketty throws down the intellectual gauntlet right away, with his book’s very title:Capital in the Twenty-First Century. Are economists still allowed to talk like that?
It’s not just the obvious allusion to Marx that makes this title so startling. By invoking capital right from the beginning, Piketty breaks ranks with most modern discussions of inequality, and hearkens back to an older tradition.
The general presumption of most inequality researchers has been that earned income, usually salaries, is where all the action is, and that income from capital is neither important nor interesting. Piketty shows, however, that even today income from capital, not earnings, predominates at the top of the income distribution. He also shows that in the past—during Europe’s Belle Époque and, to a lesser extent, America’s Gilded Age—unequal ownership of assets, not unequal pay, was the prime driver of income disparities. And he argues that we’re on our way back to that kind of society. Nor is this casual speculation on his part. For all that Capital in the Twenty-First Century is a work of principled empiricism, it is very much driven by a theoretical frame that attempts to unify discussion of economic growth and the distribution of both income and wealth. Basically, Piketty sees economic history as the story of a race between capital accumulation and other factors driving growth, mainly population growth and technological progress.
To be sure, this is a race that can have no permanent victor: over the very long run, the stock of capital and total income must grow at roughly the same rate. But one side or the other can pull ahead for decades at a time. On the eve of World War I, Europe had accumulated capital worth six or seven times national income. Over the next four decades, however, a combination of physical destruction and the diversion of savings into war efforts cut that ratio in half. Capital accumulation resumed after World War II, but this was a period of spectacular economic growth—the Trente Glorieuses, or “Glorious Thirty” years; so the ratio of capital to income remained low. Since the 1970s, however, slowing growth has meant a rising capital ratio, so capital and wealth have been trending steadily back toward Belle Époque levels. And this accumulation of capital, says Piketty, will eventually recreate Belle Époque–style inequality unless opposed by progressive taxation.
Why? It’s all about r versus g—the rate of return on capital versus the rate of economic growth.
Just about all economic models tell us that if g falls—which it has since 1970, a decline that is likely to continue due to slower growth in the working-age population and slower technological progress—r will fall too. But Piketty asserts that r will fall less than g. This doesn’t have to be true. However, if it’s sufficiently easy to replace workers with machines—if, to use the technical jargon, the elasticity of substitution between capital and labor is greater than one—slow growth, and the resulting rise in the ratio of capital to income, will indeed widen the gap between r and g. And Piketty argues that this is what the historical record shows will happen.
If he’s right, one immediate consequence will be a redistribution of income away from labor and toward holders of capital. The conventional wisdom has long been that we needn’t worry about that happening, that the shares of capital and labor respectively in total income are highly stable over time. Over the very long run, however, this hasn’t been true. In Britain, for example, capital’s share of income—whether in the form of corporate profits, dividends, rents, or sales of property, for example—fell from around 40 percent before World War I to barely 20 percent circa 1970, and has since bounced roughly halfway back. The historical arc is less clear-cut in the United States, but here, too, there is a redistribution in favor of capital underway. Notably, corporate profits have soared since the financial crisis began, while wages—including the wages of the highly educated—have stagnated.
A rising share of capital, in turn, directly increases inequality, because ownership of capital is always much more unequally distributed than labor income. But the effects don’t stop there, because when the rate of return on capital greatly exceeds the rate of economic growth, “the past tends to devour the future”: society inexorably tends toward dominance by inherited wealth.
Consider how this worked in Belle Époque Europe. At the time, owners of capital could expect to earn 4–5 percent on their investments, with minimal taxation; meanwhile economic growth was only around one percent. So wealthy individuals could easily reinvest enough of their income to ensure that their wealth and hence their incomes were growing faster than the economy, reinforcing their economic dominance, even while skimming enough off to live lives of great luxury.
And what happened when these wealthy individuals died? They passed their wealth on—again, with minimal taxation—to their heirs. Money passed on to the next generation accounted for 20 to 25 percent of annual income; the great bulk of wealth, around 90 percent, was inherited rather than saved out of earned income. And this inherited wealth was concentrated in the hands of a very small minority: in 1910 the richest one percent controlled 60 percent of the wealth in France; in Britain, 70 percent.
No wonder, then, that nineteenth-century novelists were obsessed with inheritance. Piketty discusses at length the lecture that the scoundrel Vautrin gives to Rastignac in Balzac’s Père Goriot, whose gist is that a most successful career could not possibly deliver more than a fraction of the wealth Rastignac could acquire at a stroke by marrying a rich man’s daughter. And it turns out that Vautrin was right: being in the top one percent of nineteenth-century heirs and simply living off your inherited wealth gave you around two and a half times the standard of living you could achieve by clawing your way into the top one percent of paid workers.
You might be tempted to say that modern society is nothing like that. In fact, however, both capital income and inherited wealth, though less important than they were in the Belle Époque, are still powerful drivers of inequality—and their importance is growing. In France, Piketty shows, the inherited share of total wealth dropped sharply during the era of wars and postwar fast growth; circa 1970 it was less than 50 percent. But it’s now back up to 70 percent, and rising. Correspondingly, there has been a fall and then a rise in the importance of inheritance in conferring elite status: the living standard of the top one percent of heirs fell below that of the top one percent of earners between 1910 and 1950, but began rising again after 1970. It’s not all the way back to Rasti-gnac levels, but once again it’s generally more valuable to have the right parents (or to marry into having the right in-laws) than to have the right job.
And this may only be the beginning. Figure 1 on this page shows Piketty’s estimates of global r and g over the long haul, suggesting that the era of equalization now lies behind us, and that the conditions are now ripe for the reestablishment of patrimonial capitalism.
Given this picture, why does inherited wealth play as small a part in today’s public discourse as it does? Piketty suggests that the very size of inherited fortunes in a way makes them invisible: “Wealth is so concentrated that a large segment of society is virtually unaware of its existence, so that some people imagine that it belongs to surreal or mysterious entities.” This is a very good point. But it’s surely not the whole explanation. For the fact is that the most conspicuous example of soaring inequality in today’s world—the rise of the very rich one percent in the Anglo-Saxon world, especially the United States—doesn’t have all that much to do with capital accumulation, at least so far. It has more to do with remarkably high compensation and incomes.
3.
Capital in the Twenty-First Century is, as I hope I’ve made clear, an awesome work. At a time when the concentration of wealth and income in the hands of a few has resurfaced as a central political issue, Piketty doesn’t just offer invaluable documentation of what is happening, with unmatched historical depth. He also offers what amounts to a unified field theory of inequality, one that integrates economic growth, the distribution of income between capital and labor, and the distribution of wealth and income among individuals into a single frame.
And yet there is one thing that slightly detracts from the achievement—a sort of intellectual sleight of hand, albeit one that doesn’t actually involve any deception or malfeasance on Piketty’s part. Still, here it is: the main reason there has been a hankering for a book like this is the rise, not just of the one percent, but specifically of the American one percent. Yet that rise, it turns out, has happened for reasons that lie beyond the scope of Piketty’s grand thesis.
Piketty is, of course, too good and too honest an economist to try to gloss over inconvenient facts. “US inequality in 2010,” he declares, “is quantitatively as extreme as in old Europe in the first decade of the twentieth century, but the structure of that inequality is rather clearly different.” Indeed, what we have seen in America and are starting to see elsewhere is something “radically new”—the rise of “supersalaries.”
Capital still matters; at the very highest reaches of society, income from capital still exceeds income from wages, salaries, and bonuses. Piketty estimates that the increased inequality of capital income accounts for about a third of the overall rise in US inequality. But wage income at the top has also surged. Real wages for most US workers have increased little if at all since the early 1970s, but wages for the top one percent of earners have risen 165 percent, and wages for the top 0.1 percent have risen 362 percent. If Rastignac were alive today, Vautrin might concede that he could in fact do as well by becoming a hedge fund manager as he could by marrying wealth.
What explains this dramatic rise in earnings inequality, with the lion’s share of the gains going to people at the very top? Some US economists suggest that it’s driven by changes in technology. In a famous 1981 paper titled “The Economics of Superstars,” the Chicago economist Sherwin Rosen argued that modern communications technology, by extending the reach of talented individuals, was creating winner-take-all markets in which a handful of exceptional individuals reap huge rewards, even if they’re only modestly better at what they do than far less well paid rivals.
Piketty is unconvinced. As he notes, conservative economists love to talk about the high pay of performers of one kind or another, such as movie and sports stars, as a way of suggesting that high incomes really are deserved. But such people actually make up only a tiny fraction of the earnings elite. What one finds instead is mainly executives of one sort or another—people whose performance is, in fact, quite hard to assess or give a monetary value to.
Who determines what a corporate CEO is worth? Well, there’s normally a compensation committee, appointed by the CEO himself. In effect, Piketty argues, high-level executives set their own pay, constrained by social norms rather than any sort of market discipline. And he attributes skyrocketing pay at the top to an erosion of these norms. In effect, he attributes soaring wage incomes at the top to social and political rather than strictly economic forces.
Now, to be fair, he then advances a possible economic analysis of changing norms, arguing that falling tax rates for the rich have in effect emboldened the earnings elite. When a top manager could expect to keep only a small fraction of the income he might get by flouting social norms and extracting a very large salary, he might have decided that the opprobrium wasn’t worth it. Cut his marginal tax rate drastically, and he may behave differently. And as more and more of the supersalaried flout the norms, the norms themselves will change.
There’s a lot to be said for this diagnosis, but it clearly lacks the rigor and universality of Piketty’s analysis of the distribution of and returns to wealth. Also, I don’t thinkCapital in the Twenty-First Century adequately answers the most telling criticism of the executive power hypothesis: the concentration of very high incomes in finance, where performance actually can, after a fashion, be evaluated. I didn’t mention hedge fund managers idly: such people are paid based on their ability to attract clients and achieve investment returns. You can question the social value of modern finance, but the Gordon Gekkos out there are clearly good at something, and their rise can’t be attributed solely to power relations, although I guess you could argue that willingness to engage in morally dubious wheeling and dealing, like willingness to flout pay norms, is encouraged by low marginal tax rates.
Overall, I’m more or less persuaded by Piketty’s explanation of the surge in wage inequality, though his failure to include deregulation is a significant disappointment. But as I said, his analysis here lacks the rigor of his capital analysis, not to mention its sheer, exhilarating intellectual elegance.
Yet we shouldn’t overreact to this. Even if the surge in US inequality to date has been driven mainly by wage income, capital has nonetheless been significant too. And in any case, the story looking forward is likely to be quite different. The current generation of the very rich in America may consist largely of executives rather than rentiers, people who live off accumulated capital, but these executives have heirs. And America two decades from now could be a rentier-dominated society even more unequal than Belle Époque Europe.
But this doesn’t have to happen.
4.
At times, Piketty almost seems to offer a deterministic view of history, in which everything flows from the rates of population growth and technological progress. In reality, however, Capital in the Twenty-First Century makes it clear that public policy can make an enormous difference, that even if the underlying economic conditions point toward extreme inequality, what Piketty calls “a drift toward oligarchy” can be halted and even reversed if the body politic so chooses.
The key point is that when we make the crucial comparison between the rate of return on wealth and the rate of economic growth, what matters is the after-tax return on wealth. So progressive taxation—in particular taxation of wealth and inheritance—can be a powerful force limiting inequality. Indeed, Piketty concludes his masterwork with a plea for just such a form of taxation. Unfortunately, the history covered in his own book does not encourage optimism.
It’s true that during much of the twentieth century strongly progressive taxation did indeed help reduce the concentration of income and wealth, and you might imagine that high taxation at the top is the natural political outcome when democracy confronts high inequality. Piketty, however, rejects this conclusion; the triumph of progressive taxation during the twentieth century, he contends, was “an ephemeral product of chaos.” Absent the wars and upheavals of Europe’s modern Thirty Years’ War, he suggests, nothing of the kind would have happened.
As evidence, he offers the example of France’s Third Republic. The Republic’s official ideology was highly egalitarian. Yet wealth and income were nearly as concentrated, economic privilege almost as dominated by inheritance, as they were in the aristocratic constitutional monarchy across the English Channel. And public policy did almost nothing to oppose the economic domination by rentiers: estate taxes, in particular, were almost laughably low.
Why didn’t the universally enfranchised citizens of France vote in politicians who would take on the rentier class? Well, then as now great wealth purchased great influence—not just over policies, but over public discourse. Upton Sinclair famously declared that “it is difficult to get a man to understand something when his salary depends on his not understanding it.” Piketty, looking at his own nation’s history, arrives at a similar observation: “The experience of France in the Belle Époque proves, if proof were needed, that no hypocrisy is too great when economic and financial elites are obliged to defend their interest.”
The same phenomenon is visible today. In fact, a curious aspect of the American scene is that the politics of inequality seem if anything to be running ahead of the reality. As we’ve seen, at this point the US economic elite owes its status mainly to wages rather than capital income. Nonetheless, conservative economic rhetoric already emphasizes and celebrates capital rather than labor—“job creators,” not workers.
In 2012 Eric Cantor, the House majority leader, chose to mark Labor Day—Labor Day!—with a tweet honoring business owners:
Today, we celebrate those who have taken a risk, worked hard, built a business and earned their own success.
Perhaps chastened by the reaction, he reportedly felt the need to remind his colleagues at a subsequent GOP retreat that most people don’t own their own businesses—but this in itself shows how thoroughly the party identifies itself with capital to the virtual exclusion of labor.
Nor is this orientation toward capital just rhetorical. Tax burdens on high-income Americans have fallen across the board since the 1970s, but the biggest reductions have come on capital income—including a sharp fall in corporate taxes, which indirectly benefits stockholders—and inheritance. Sometimes it seems as if a substantial part of our political class is actively working to restore Piketty’s patrimonial capitalism. And if you look at the sources of political donations, many of which come from wealthy families, this possibility is a lot less outlandish than it might seem.
Piketty ends Capital in the Twenty-First Century with a call to arms—a call, in particular, for wealth taxes, global if possible, to restrain the growing power of inherited wealth. It’s easy to be cynical about the prospects for anything of the kind. But surely Piketty’s masterly diagnosis of where we are and where we’re heading makes such a thing considerably more likely. So Capital in the Twenty-First Century is an extremely important book on all fronts. Piketty has transformed our economic discourse; we’ll never talk about wealth and inequality the same way we used to.
Taipé, Taiwan, abril/2014 – Quando lemos romances ou ficções curtas em qualquer idioma o fazemos para entender a história, para aprender algo novo ou, com sorte, para conseguir algum tipo de elevação emocional graças às palavras impressas nas páginas e às habilidades do narrador.
Então, como contar a “história” da mudança climática e do aquecimento global?
Um novo gênero literário chamado “ficção climática”, abreviado em inglês como cli-fi, vem evoluindo nos últimos anos e, embora ainda empreste seu nome da ficção científica, se centra em relatos sobre a mudança climática e seus impactos atuais e futuros sobre a vida humana.
Alguns insistem em que é apenas um subgênero da ficção científica, e isso tem sentido em certo aspecto. Mas, em outros, trata-se de um gênero em si mesmo que está ganhando impulso em todo o mundo, não como mero escapismo ou entretenimento – embora frequentemente inclua esses elementos –, mas como um modo sério de abordar os assuntos complexos e universais existentes em torno da mudança climática.
Sei algo sobre ficção climática porque nos últimos anos trabalhei para popularizá-la, não só no mundo de idioma inglês, mas também entre milhões de pessoas que leem em espanhol, chinês, alemão ou francês, para citar alguns. Em minha opinião, é um gênero internacional, com leitores internacionais, que deveria ser abordado por escritores de qualquer nação e em qualquer idioma.
Cada vez mais novelas de ficção climática se dirigem a uma audiência jovem – “adultos jovens”, no jargão editorial –, como Not a Drop to Drink (Nem Uma Gota Para Beber), de Mindy McGinnis, The Carbon Diaries 2015 (Os Diários do Carbono 2015), de Saci Lloyd, e Floodland (Terra Inundável), de Marcus Sedgwick. Na verdade, são as crianças e os adolescentes que sofrerão as consequências dos estilos de vida escolhidos pelas gerações anteriores.
Em um mundo que enfrenta os impactos potencialmente catastróficos da mudança climática, esse novo gênero literário se incorpora à nossa cultura em narrativa comum, divulgando ideias e pontos de vista sobre o futuro que a humanidade pode enfrentar em dez, cem ou 500 anos.
É aí que entra em cena a ficção climática, que pode desempenhar um papel importante para plasmar as emoções e os sentimentos das personagens, em um relato ou romance bem escrito para conscientizar leitores em todo o mundo.
Imaginem um romance de ficção climática, que não só chegue a milhares de leitores, mas que também os emocione e, talvez, os motive a se converterem em uma voz mais forte no debate político internacional sobre as emissões de carbono.
Esse é o potencial da ficção climática.
Uma universidade dos Estados Unidos oferece um curso sobre romances e filmes de ficção climática para estudantes de ciências ambientais e literatura.
Para Stephanie LeMenager, que este ano dá aulas na Universidade de Oregon, o curso constitui uma oportunidade, para ela e seus alunos, de explorar o poder da literatura e do cinema, em um momento em que escritores e cineastas tentam abordar alguns dos assuntos mais difíceis que a humanidade enfrenta no século 21.
O curso de LeMenager se chama As Culturas da Mudança Climática. É o primeiro na América do Norte, e inclusive no mundo, que se dedica dessa maneira às artes e à mudança climática. Estou seguro de que outras universidades seguirão esse esforço pioneiro, agregando novos cursos sobre ficção climática para seus estudantes.
Nathaniel Rich é um escritor de 34 anos, autor do aclamado romance Odds Against Tomorrow (Prognósticos Contra o Amanhã), uma história ambientada em um futuro próximo em Manhattan, que mergulha na “matemática da catástrofe”. Residente em Nova Orleans, Rich acredita que serão publicados mais livros como o seu, não só em inglês e não só do ponto de vista das nações ricas do Ocidente.
Escritores de todo o mundo devem se animar a incursionar no gênero da ficção climática e a usar a literatura de suas próprias culturas para tentar despertar a população sobre o futuro que pode esperar a todos em um planeta que esquenta sem um fim à vista.
As tramas podem ser aterradoras, mas as novelas de ficção climática dão a oportunidade de explorar esses assuntos com emoção e prosa. Os livros têm importância. A literatura tem um papel a desempenhar em nossos debates sobre os impactos do aquecimento global em todo o mundo.
Se poderá dizer que o cânon do gênero remonta ao romance O Mundo Submerso, escrito em 1962 pelo britânico J. G. Ballard. Outro dos primeiros livros sobre esse fenômeno foi escrito em 1987 pelo australiano George Turner: As Torres do Esquecimento.
A norte-americana Barbara Kingsolver publicou há alguns anos um romance muito poderoso de ficção climática intitulada Flight Behavior (Comportamento de Voo). Me impressionou muito quando o li no verão passado, e o recomendo.
A canadense Mary Woodbury criou o site Cli-Fi Books, que lista romances atuais e passados de ficção climática.
Como vejo o futuro? Prevejo um mundo onde os seres humanos se aferrem à esperança e ao otimismo. E sou otimista. E creio que quanto mais nos apegarmos à ciência da mudança climática no plano cultural mais efetivamente poderemos nos unir para evitar o pior. Envolverde/IPS
* Dan Bloom é jornalista independente de Boston que vive em Taiwan. Em 1971, se formou na Tufts University, onde se especializou em literatura francesa. É ativista climático e literário desde 2006. Para segui-lo no Twitter o endereço é @polarcityman.
A região sofre com uma seca que se prolonga pelo terceiro ano consecutivo, o que gera problemas sociais e dificulta o desenvolvimento da agricultura e a criação de animais
A Comissão de Integração Nacional debateu nesta terça-feira a atuação de órgãos federais na ajuda à população do Nordeste, que enfrenta estiagem pelo terceiro ano consecutivo.
Durante audiência pública da Comissão de Integração Nacional, Desenvolvimento Regional e da Amazônia, nesta terça-feira (15), o deputado Wilson Filho (PTB-PB) criticou o descaso do governo federal com o que ele chamou de “caos total” no Nordeste.
A região sofre com uma seca que se prolonga pelo terceiro ano consecutivo, o que gera problemas sociais e dificulta o desenvolvimento da agricultura e a criação de animais. Além disso, provoca a falta de recursos econômicos, gerando fome e miséria no sertão.
“É muito visível, por exemplo, quando São Paulo entrou em uma realidade bem próxima. De forma rapidíssima o governo federal e os órgãos competentes deram essa resposta”, afirmou.
Contenção de gastos
A operação carro-pipa distribui água potável para a população das regiões afetadas pela estiagem. Ela é uma parceria do Ministério da Integração Nacional, por meio da Secretaria Nacional de Defesa Civil, com o Exército Brasileiro. A ação foi interrompida por parte do ministério no começo deste ano para a contenção de gastos.
Last week, Lee led us through an exercise that helped to contextualize the minuteness of the period in which humans (and modern life on Earth) have existed. Dovetailing off of Haraway’s talk on the Anthropocene (or perhaps Capitaloscene) and her use of visual media and aesthetics to conceptualize and re-conceptualize the term’s significance, this week we will be exploring various aesthetic and artistic interpretations of the Anthropocene (although many of the images may not be constructed by self-proclaimed ‘artists’). There are some interesting works here, as well as in Making the Geologic Now, which we briefly focused on at the beginning of the semester.
I’d like to draw attention to the living sculptures of Jason deCaires Taylor, an artist and coral reef advocate based out of Cancun, Mexico. Opposing the capitalist “land as commodity” paradigm, Taylor subverts the resource-as-value mentality by installing art pieces, whose inherent value to humans is not economic, but artistic, that actively proliferate life on their structures. Taylor’s sculptures, which are composed of ph-neutral, environmentally friendly materials, are not just an interpretation of the world, that is a medium for-us, but rather an artwork acknowledging our large-scale presence that also seeks to heal the world’s depleting reefs – a medium for-them.
With scientists estimating that 80% or more of all reefs on Earth will be lost by 2050, Taylor aims to decouple us from the notion that it is our vulnerability at stake in the Anthropocene. Yes, as Nigel Clark argues, we can succumb to this inhuman nature that is entirely indifferent to preserving our lives, but as Taylor wishes to show, so are the coral reefs. In Taylor’s piece intitled Anthropocene, an old VW bug is submerged on the ocean floor supporting a fossilized child who appears to be asleep. The sculpture is hollow with various openings close to the floor, allowing lobsters to make their homes in the structure. I wonder if these crustaceans symbolize the ancient beginnings of life.
Taylor’s Anthropocene
A structure fit for lobster
In another piece entitled The Silent Evolutionfor which he received critical acclaim, Taylor took casts of over 400 humans and installed them in an area over 420 square meters in size. While this underwater society appears human at first, it is imperceptibly transformed into a marine assemblage until it is no longer familiar to us. Taylor’s installations remind us of our simultaneous vulnerability (ala Clark) and our unique human qualities, like our capacity to both destroy life and to engender it. As an aesthetic medium, we are invited to explore the ocean floor and discover these strange objects that evolve over time. Almost a kind of wild Banksy, Taylor plays off of our land-evolved eyesight, drawing our attention to the new ways that light refracts, and colors/perspectives appear underwater.
What are the most important events in the collective environmental memory of humanity? This is the question addressed in this video highlighting 22 events that professional environmental historians regard as turning points in the relationship between humans and the environment. Topics include deforestation, mining and oil extraction, nuclear disaster, bugs, Earth Day, a dust veil event and the invention of agriculture. The events discussed in the video move beyond the confines of human history. The earliest event is the asteroid impact that ended the age of the dinosaurs 65 million years ago. At the other end of the timeline the video moves into the future and speculates about a future mega-earthquake in the Tokyo Bay area. In spatial terms, events were scattered over all five continents as well as the entire globe
This video provides an introduction to some of the most prominent events in the interaction between humans and the planetary environment that have shaped history.
The video is based on an article compiled and introduced by Frank Uekötter: “What Should We Remember? A Global Poll Among Environmental Historians”, Global Environment, 11 (2013), pp. 209-210.
Source: DOE/Lawrence Livermore National Laboratory
Summary: Volcanic eruptions in the early part of the 21st century have cooled the planet, according to a new study. This cooling partly offset the warming produced by greenhouse gases.
LLNL scientist Benjamin Santer and his climbing group ascend Mt. St. Helens via the “Dogshead Route” in April 1980, about a month before its major eruption. The group was the last to reach the summit of Mt. St. Helens before its major eruption that May. New research by Santer and his colleagues shows that volcanic eruptions contribute to a recent warming “hiatus.” Credit: Image courtesy of DOE/Lawrence Livermore National Laboratory
Volcanic eruptions in the early part of the 21st century have cooled the planet, according to a study led by Lawrence Livermore National Laboratory. This cooling partly offset the warming produced by greenhouse gases.
Despite continuing increases in atmospheric levels of greenhouse gases, and in the total heat content of the ocean, global-mean temperatures at the surface of the planet and in the troposphere (the lowest portion of Earth’s atmosphere) have shown relatively little warming since 1998. This so-called ‘slow-down’ or ‘hiatus’ has received considerable scientific, political and popular attention. The volcanic contribution to the ‘slow-down’ is the subject of a new paper appearing in the Feb. 23 edition of the journalNature Geoscience.
Volcanic eruptions inject sulfur dioxide gas into the atmosphere. If the eruptions are large enough to add sulfur dioxide to the stratosphere (the atmospheric layer above the troposphere), the gas forms tiny droplets of sulfuric acid, also known as “volcanic aerosols.” These droplets reflect some portion of the incoming sunlight back into space, cooling Earth’s surface and the lower atmosphere.
“In the last decade, the amount of volcanic aerosol in the stratosphere has increased, so more sunlight is being reflected back into space,” said Lawrence Livermore climate scientist Benjamin Santer, who serves as lead author of the study. “This has created a natural cooling of the planet and has partly offset the increase in surface and atmospheric temperatures due to human influence.”
From 2000-2012, emissions of greenhouse gases into the atmosphere have increased — as they have done since the Industrial Revolution. This human-induced change typically causes the troposphere to warm and the stratosphere to cool. In contrast, large volcanic eruptions cool the troposphere and warm the stratosphere. The researchers report that early 21st century volcanic eruptions have contributed to this recent “warming hiatus,” and that most climate models have not accurately accounted for this effect.
“The recent slow-down in observed surface and tropospheric warming is a fascinating detective story,” Santer said. “There is not a single culprit, as some scientists have claimed. Multiple factors are implicated. One is the temporary cooling effect of internal climate noise. Other factors are the external cooling influences of 21st century volcanic activity, an unusually low and long minimum in the last solar cycle, and an uptick in Chinese emissions of sulfur dioxide.
“The real scientific challenge is to obtain hard quantitative estimates of the contributions of each of these factors to the slow-down.”
The researchers performed two different statistical tests to determine whether recent volcanic eruptions have cooling effects that can be distinguished from the intrinsic variability of the climate. The team found evidence for significant correlations between volcanic aerosol observations and satellite-based estimates of lower tropospheric temperatures as well as the sunlight reflected back to space by the aerosol particles.
“This is the most comprehensive observational evaluation of the role of volcanic activity on climate in the early part of the 21st century,” said co-author Susan Solomon, the Ellen Swallow Richards professor of atmospheric chemistry and climate science at MIT. “We assess the contributions of volcanoes on temperatures in the troposphere — the lowest layer of the atmosphere — and find they’ve certainly played some role in keeping Earth cooler.”
The research is funded by the Department of Energy’s Office of Biological and Environmental Science in the Office of Science. The research involved a large, interdisciplinary team of researchers with expertise in climate modeling, satellite data, stratospheric dynamics and volcanic effects on climate, model evaluation and computer science.
Journal Reference:
Benjamin D. Santer, Céline Bonfils, Jeffrey F. Painter, Mark D. Zelinka, Carl Mears, Susan Solomon, Gavin A. Schmidt, John C. Fyfe, Jason N. S. Cole, Larissa Nazarenko, Karl E. Taylor, Frank J. Wentz. Volcanic contribution to decadal changes in tropospheric temperature. Nature Geoscience, 2014; DOI:10.1038/ngeo2098
Source: Society for Industrial and Applied Mathematics
Summary: Vast amounts of data related to climate change are being compiled by researchers worldwide with varying climate projections. This requires combining information across data sets to arrive at a consensus regarding future climate estimates. Scientists propose a statistical hierarchical Bayesian model that consolidates climate change information from observation-based data sets and climate models.
Regional analysis for climate change assessment. Credit: Melissa Bukovsky, National Center for Atmospheric Research (NCAR/IMAGe)
Vast amounts of data related to climate change are being compiled by research groups all over the world. Data from these many and varied sources results in different climate projections; hence, the need arises to combine information across data sets to arrive at a consensus regarding future climate estimates.
In a paper published last December in the SIAM Journal on Uncertainty Quantification, authors Matthew Heaton, Tamara Greasby, and Stephan Sain propose a statistical hierarchical Bayesian model that consolidates climate change information from observation-based data sets and climate models. “The vast array of climate data — from reconstructions of historic temperatures and modern observational temperature measurements to climate model projections of future climate — seems to agree that global temperatures are changing,” says author Matthew Heaton. “Where these data sources disagree, however, is by how much temperatures have changed and are expected to change in the future. Our research seeks to combine many different sources of climate data, in a statistically rigorous way, to determine a consensus on how much temperatures are changing.” Using a hierarchical model, the authors combine information from these various sources to obtain an ensemble estimate of current and future climate along with an associated measure of uncertainty. “Each climate data source provides us with an estimate of how much temperatures are changing. But, each data source also has a degree of uncertainty in its climate projection,” says Heaton. “Statistical modeling is a tool to not only get a consensus estimate of temperature change but also an estimate of our uncertainty about this temperature change.” The approach proposed in the paper combines information from observation-based data, general circulation models (GCMs) and regional climate models (RCMs). Observation-based data sets, which focus mainly on local and regional climate, are obtained by taking raw climate measurements from weather stations and applying it to a grid defined over the globe. This allows the final data product to provide an aggregate measure of climate rather than be restricted to individual weather data sets. Such data sets are restricted to current and historical time periods. Another source of information related to observation-based data sets are reanalysis data sets in which numerical model forecasts and weather station observations are combined into a single gridded reconstruction of climate over the globe. GCMs are computer models which capture physical processes governing the atmosphere and oceans to simulate the response of temperature, precipitation, and other meteorological variables in different scenarios. While a GCM portrayal of temperature would not be accurate to a given day, these models give fairly good estimates for long-term average temperatures, such as 30-year periods, which closely match observed data. A big advantage of GCMs over observed and reanalyzed data is that GCMs are able to simulate climate systems in the future. RCMs are used to simulate climate over a specific region, as opposed to global simulations created by GCMs. Since climate in a specific region is affected by the rest of Earth, atmospheric conditions such as temperature and moisture at the region’s boundary are estimated by using other sources such as GCMs or reanalysis data. By combining information from multiple observation-based data sets, GCMs and RCMs, the model obtains an estimate and measure of uncertainty for the average temperature, temporal trend, as well as the variability of seasonal average temperatures. The model was used to analyze average summer and winter temperatures for the Pacific Southwest, Prairie and North Atlantic regions (seen in the image above) — regions that represent three distinct climates. The assumption would be that climate models would behave differently for each of these regions. Data from each region was considered individually so that the model could be fit to each region separately. “Our understanding of how much temperatures are changing is reflected in all the data available to us,” says Heaton. “For example, one data source might suggest that temperatures are increasing by 2 degrees Celsius while another source suggests temperatures are increasing by 4 degrees. So, do we believe a 2-degree increase or a 4-degree increase? The answer is probably ‘neither’ because combining data sources together suggests that increases would likely be somewhere between 2 and 4 degrees. The point is that that no single data source has all the answers. And, only by combining many different sources of climate data are we really able to quantify how much we think temperatures are changing.” While most previous such work focuses on mean or average values, the authors in this paper acknowledge that climate in the broader sense encompasses variations between years, trends, averages and extreme events. Hence the hierarchical Bayesian model used here simultaneously considers the average, linear trend and interannual variability (variation between years). Many previous models also assume independence between climate models, whereas this paper accounts for commonalities shared by various models — such as physical equations or fluid dynamics — and correlates between data sets. “While our work is a good first step in combining many different sources of climate information, we still fall short in that we still leave out many viable sources of climate information,” says Heaton. “Furthermore, our work focuses on increases/decreases in temperatures, but similar analyses are needed to estimate consensus changes in other meteorological variables such as precipitation. Finally, we hope to expand our analysis from regional temperatures (say, over just a portion of the U.S.) to global temperatures.”
Journal Reference:
Matthew J. Heaton, Tamara A. Greasby, Stephan R. Sain. Modeling Uncertainty in Climate Using Ensembles of Regional and Global Climate Models and Multiple Observation-Based Data Sets. SIAM/ASA Journal on Uncertainty Quantification, 2013; 1 (1): 535 DOI: 10.1137/12088505X
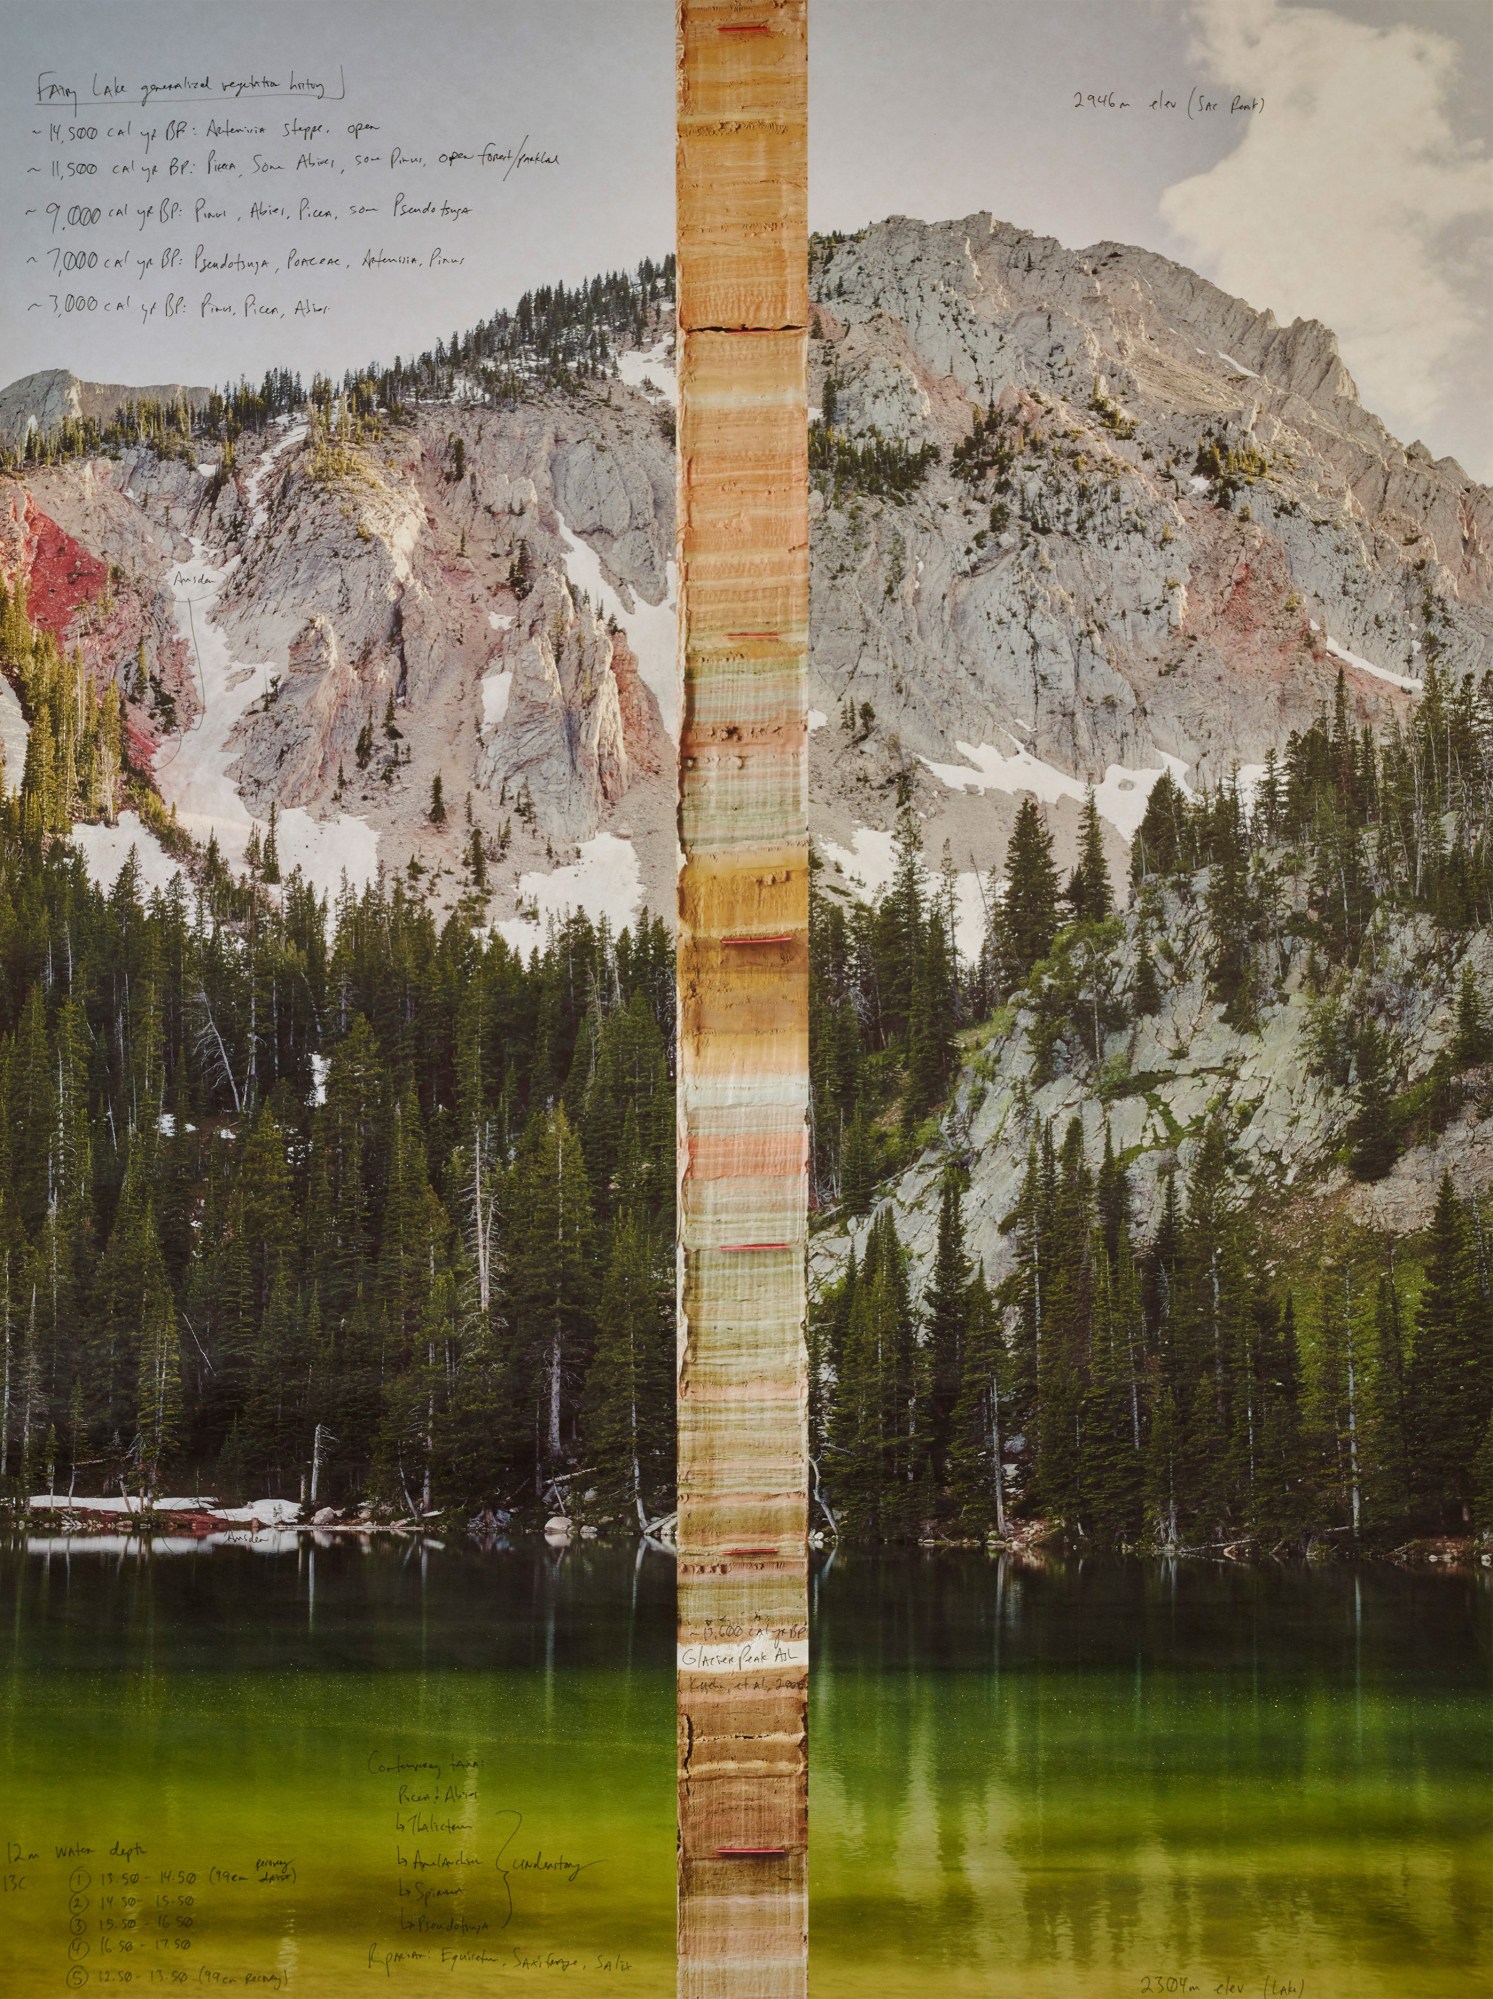
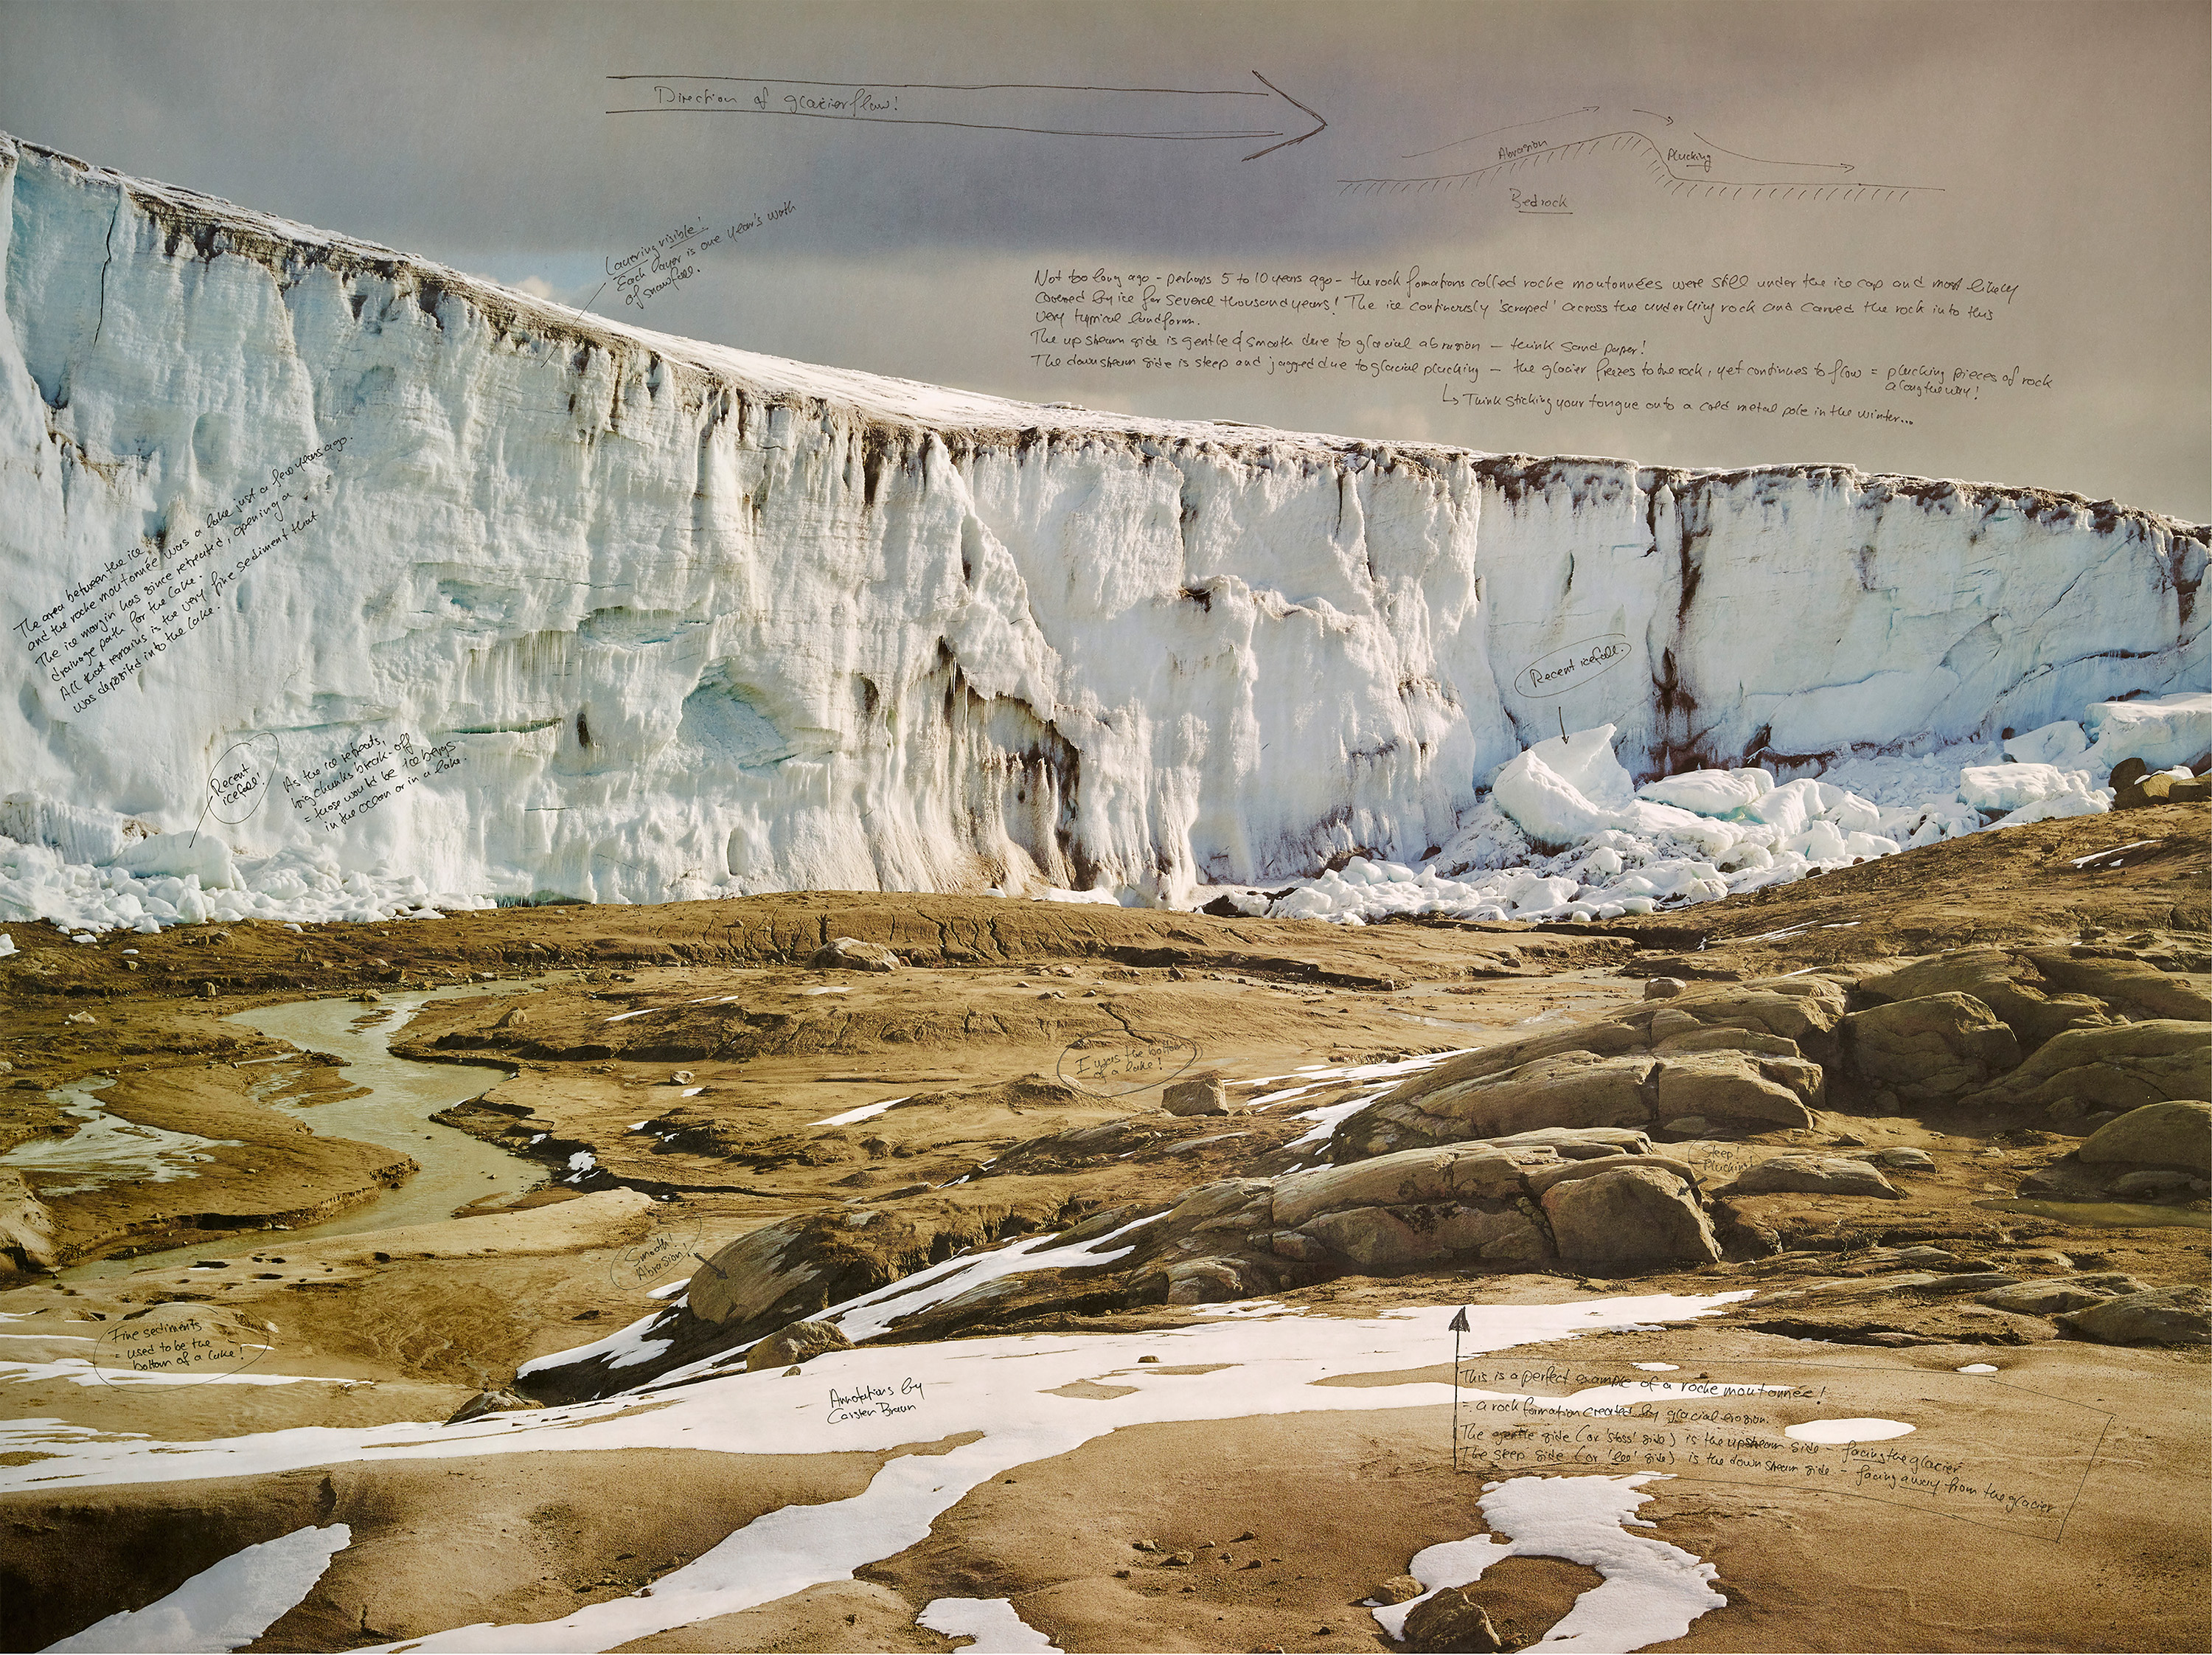
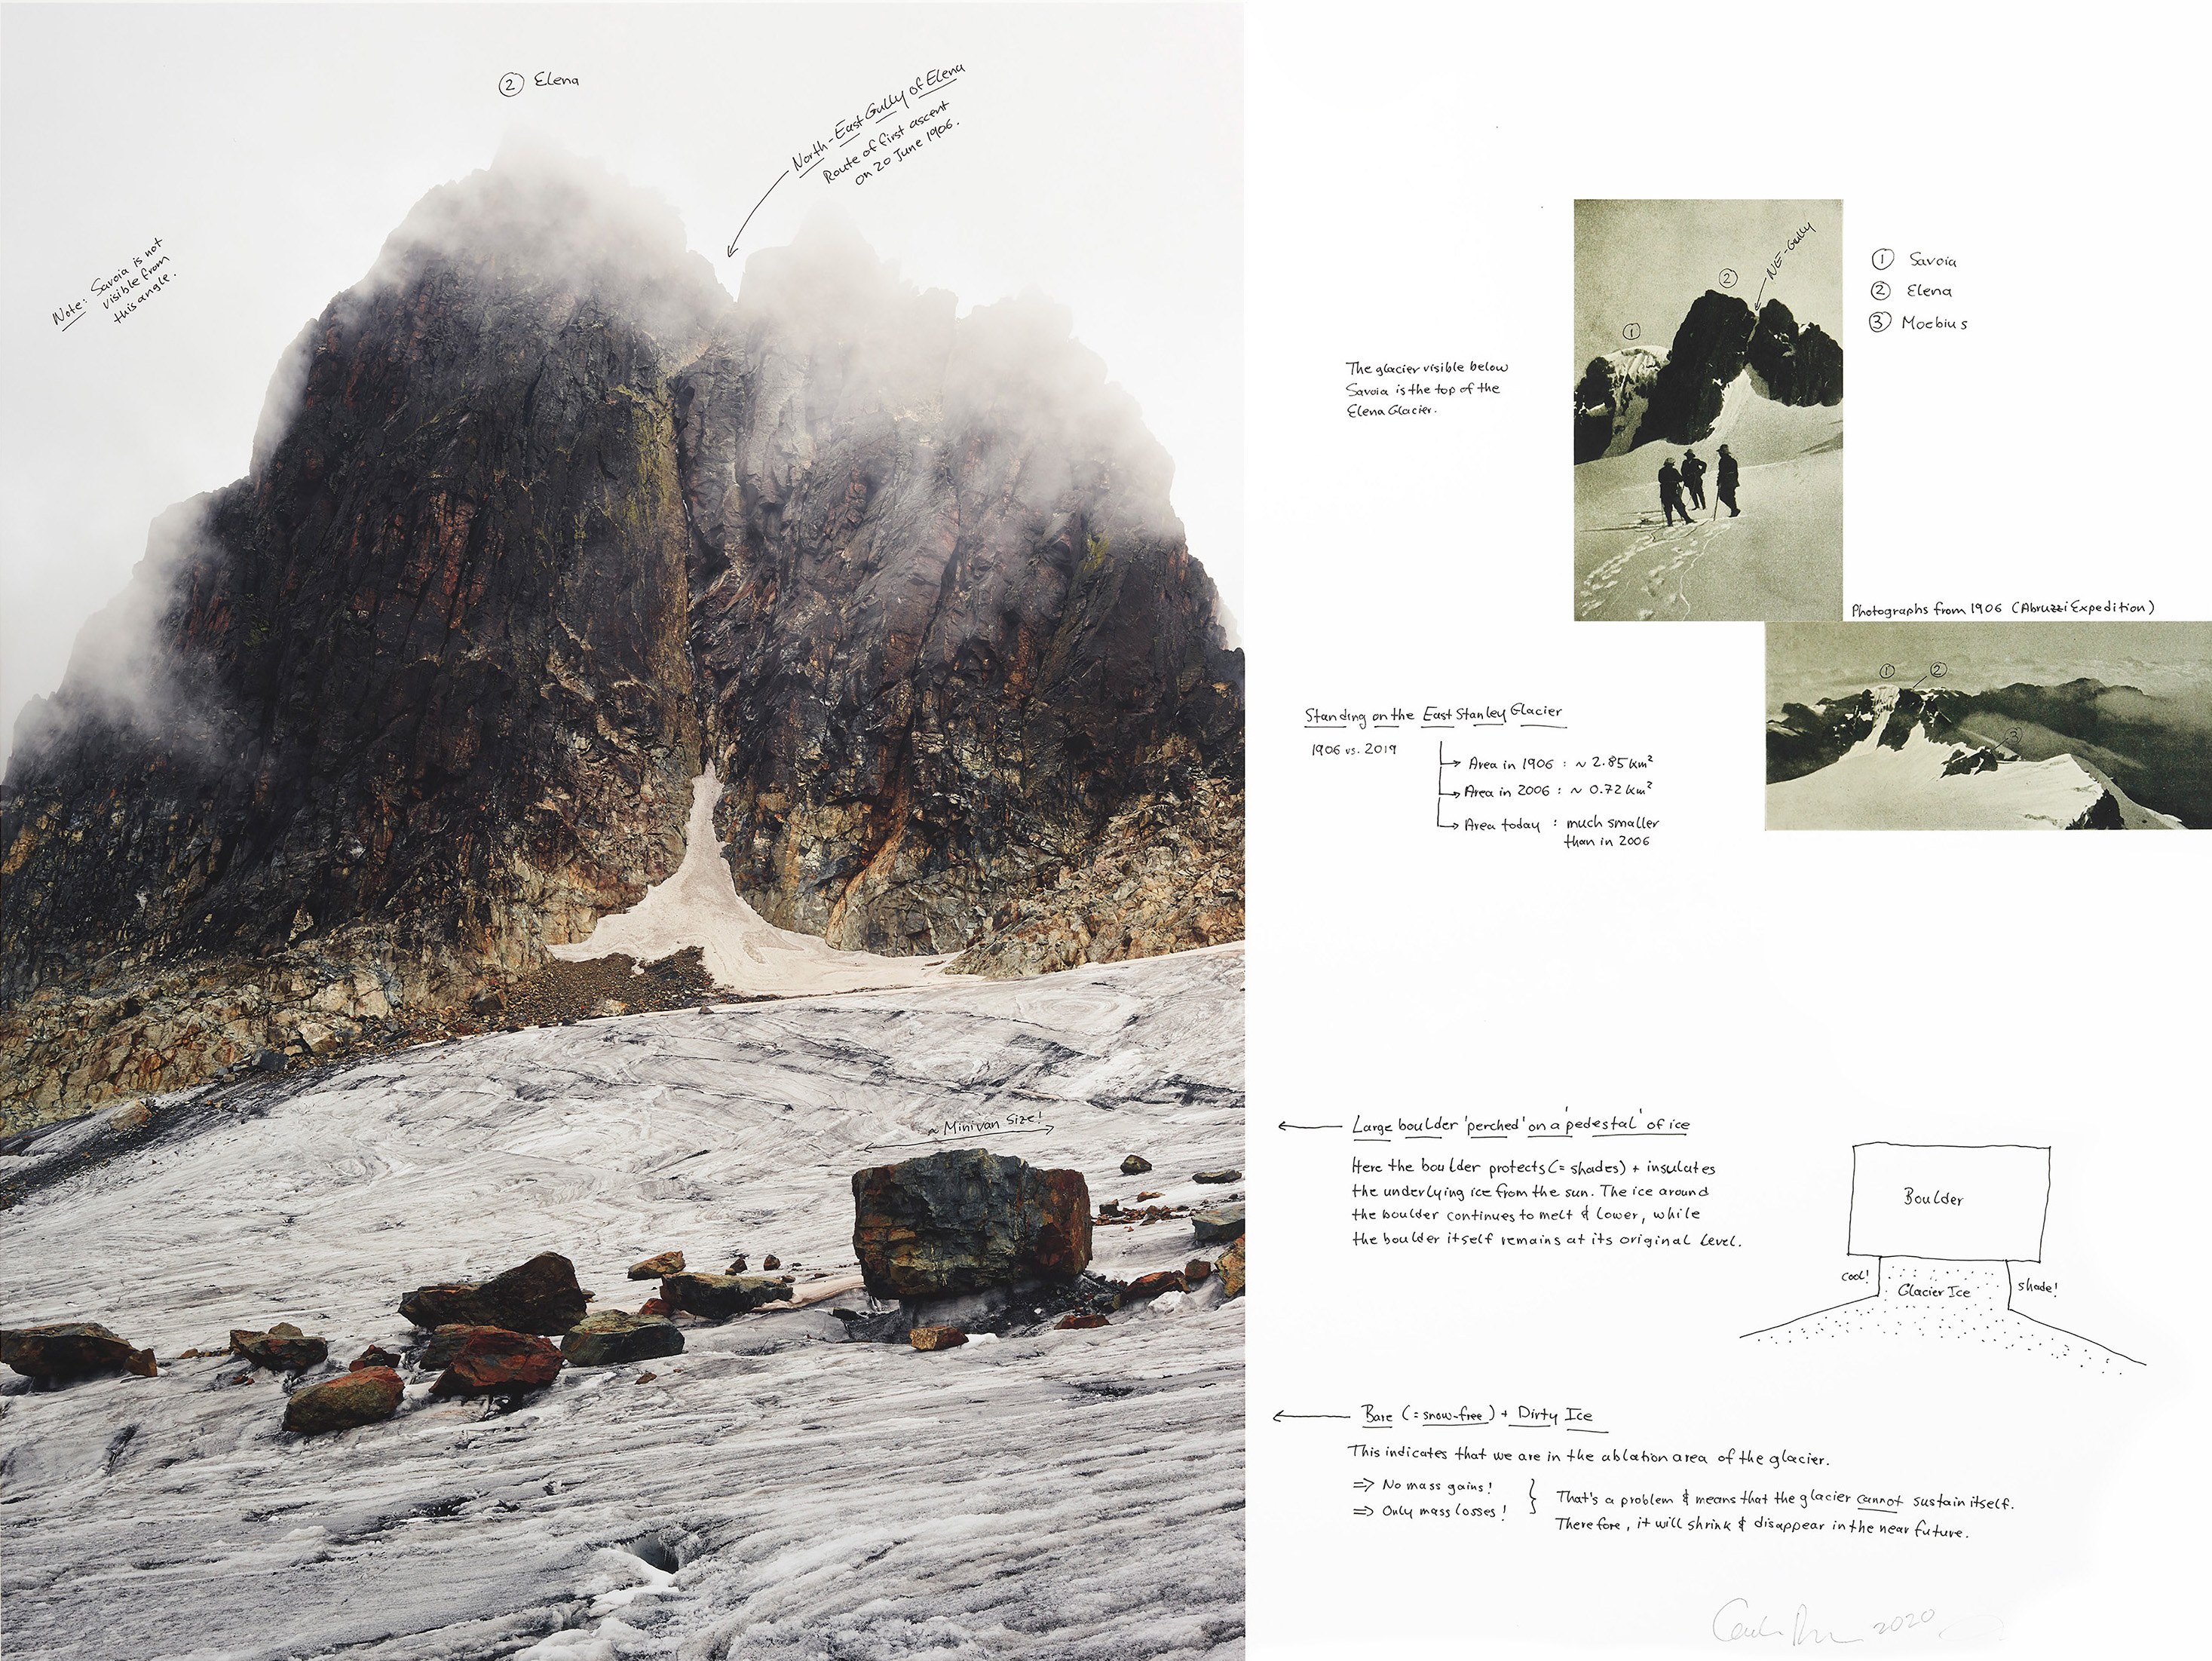
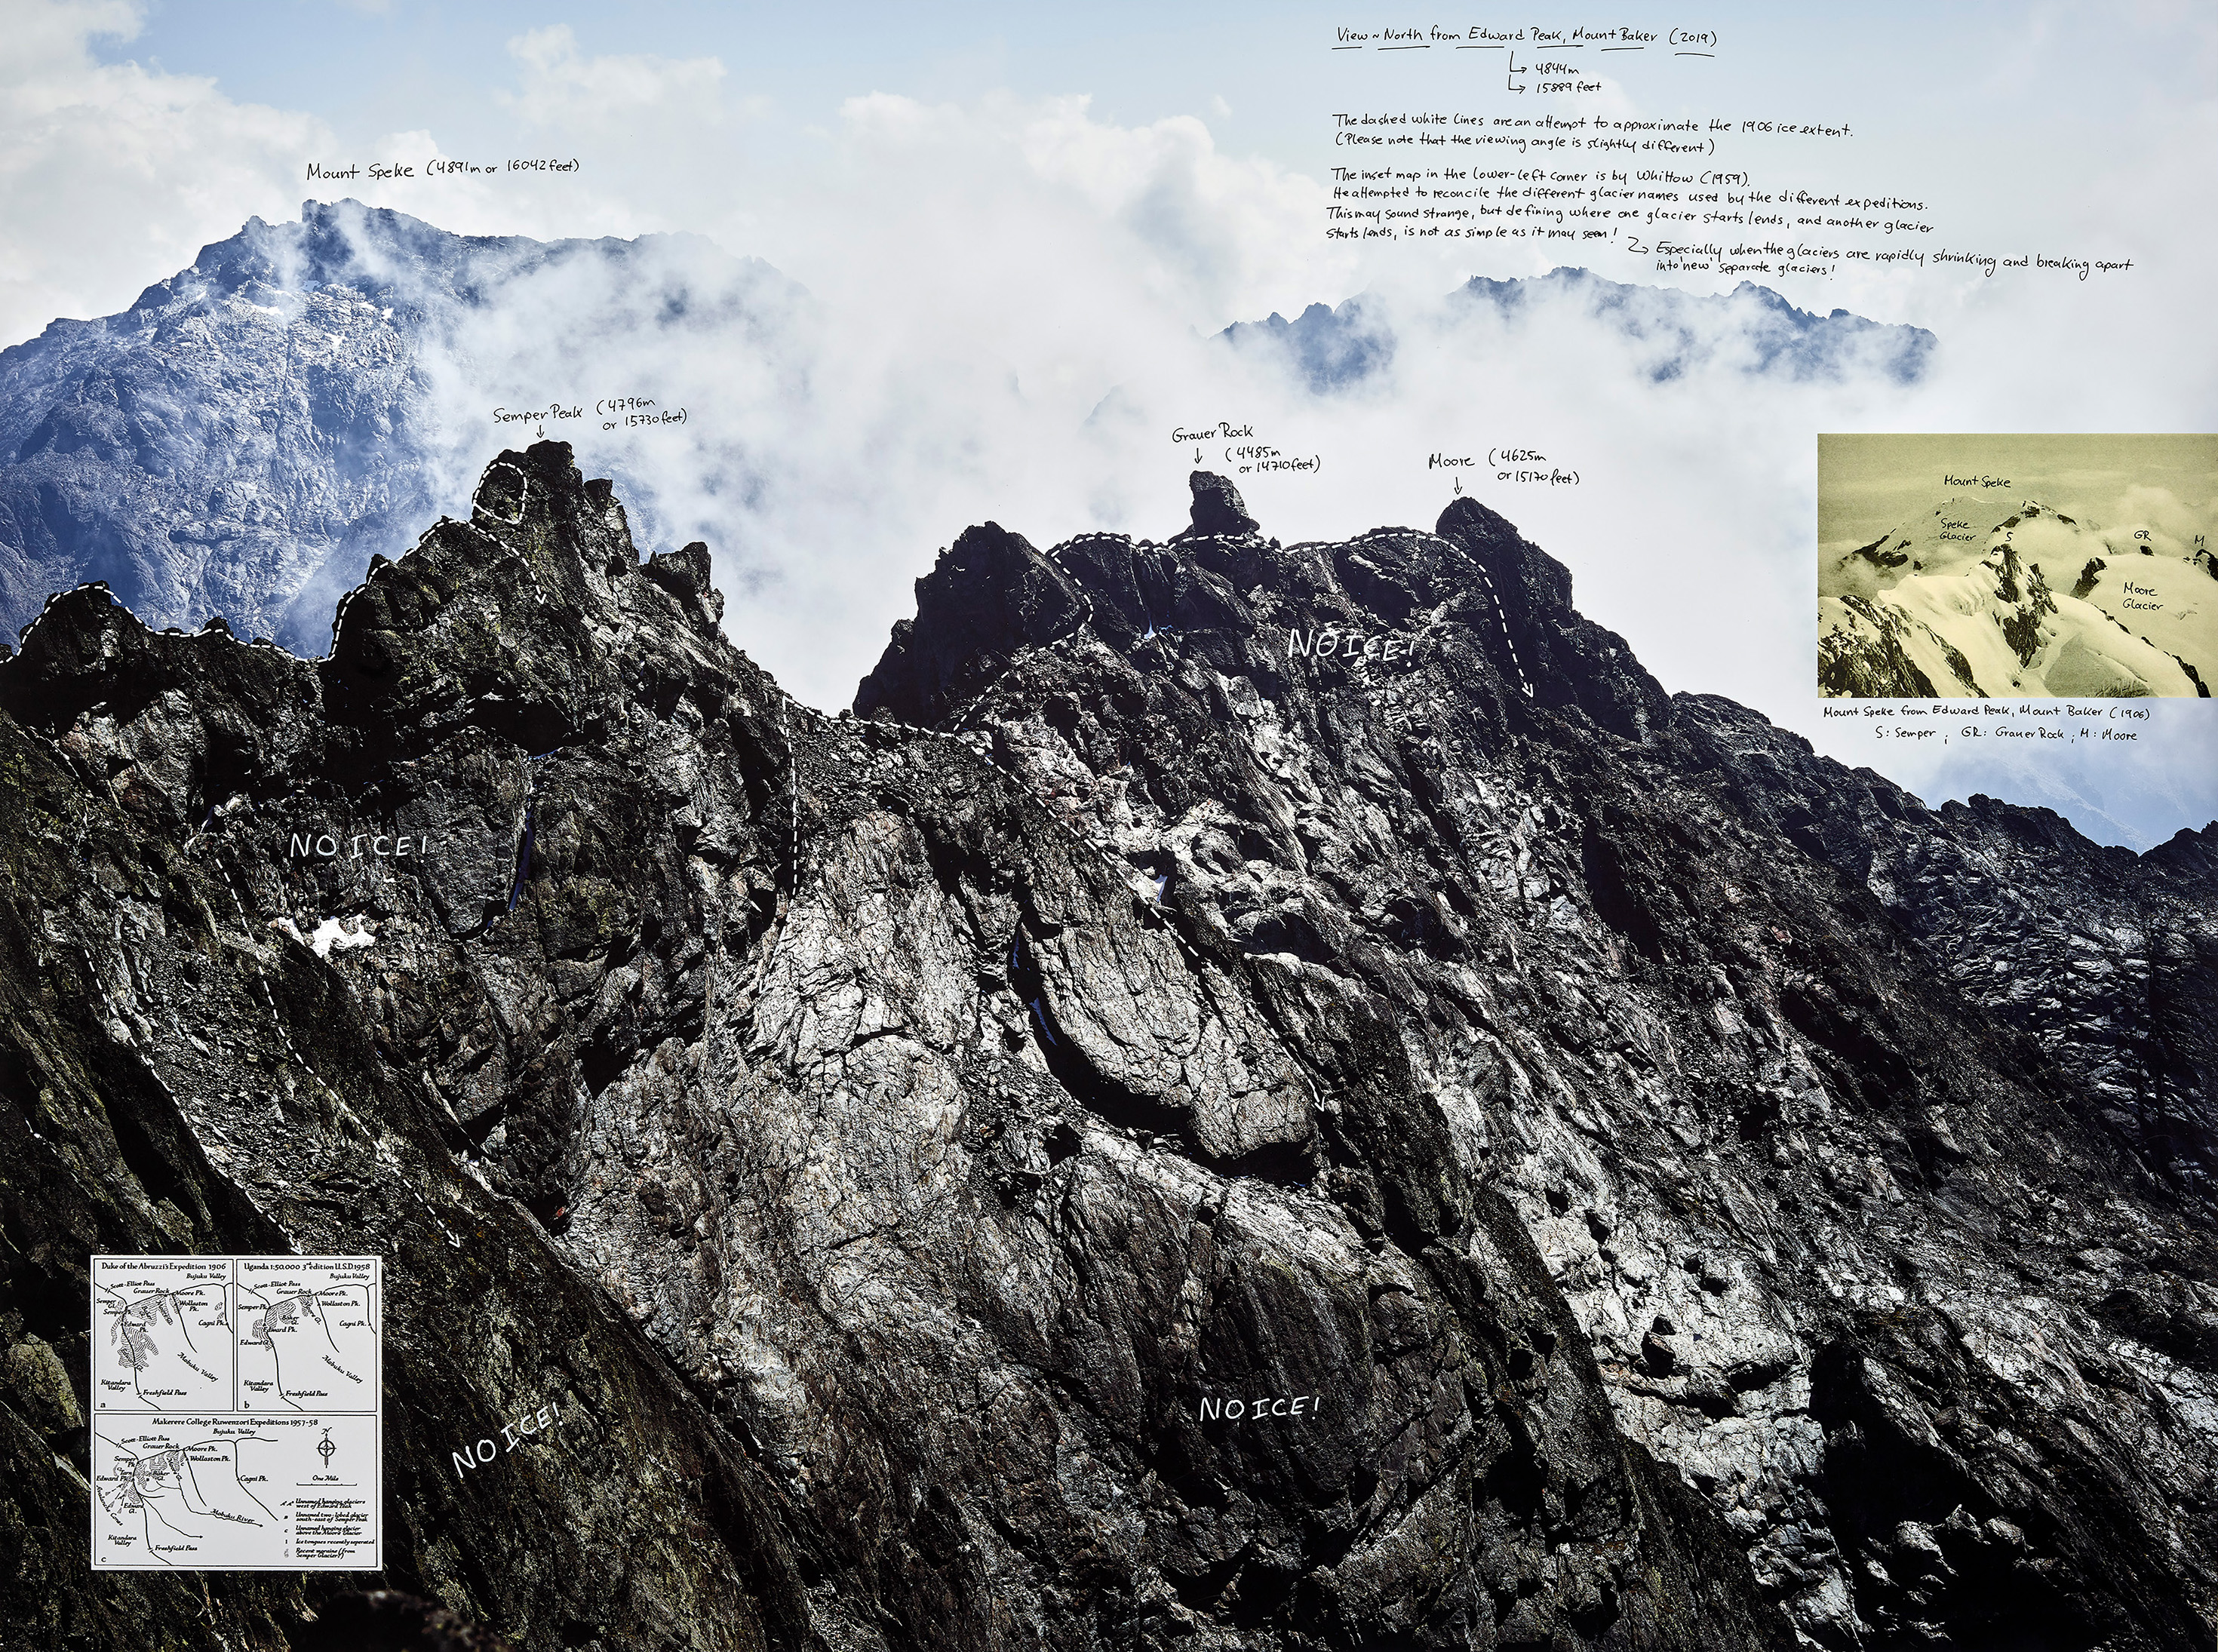


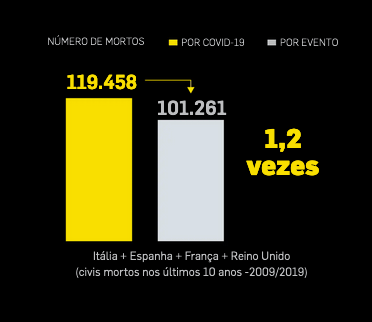


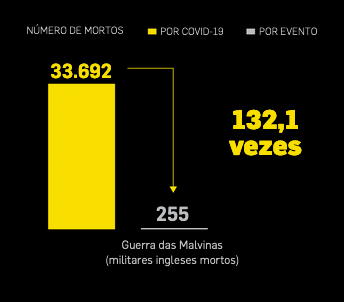
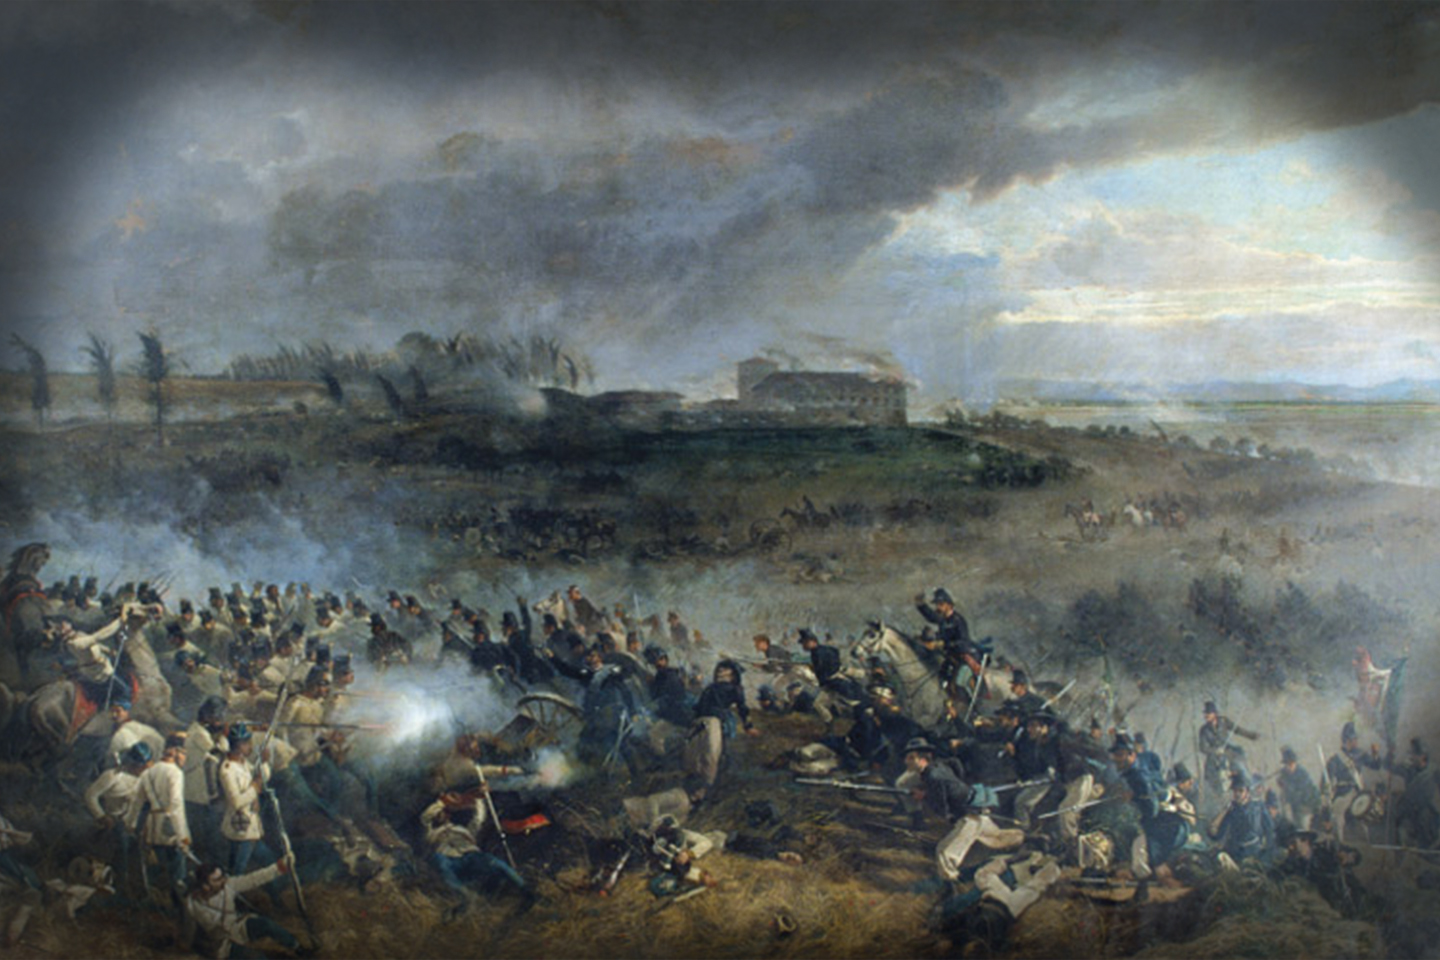


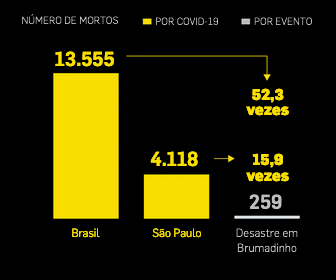
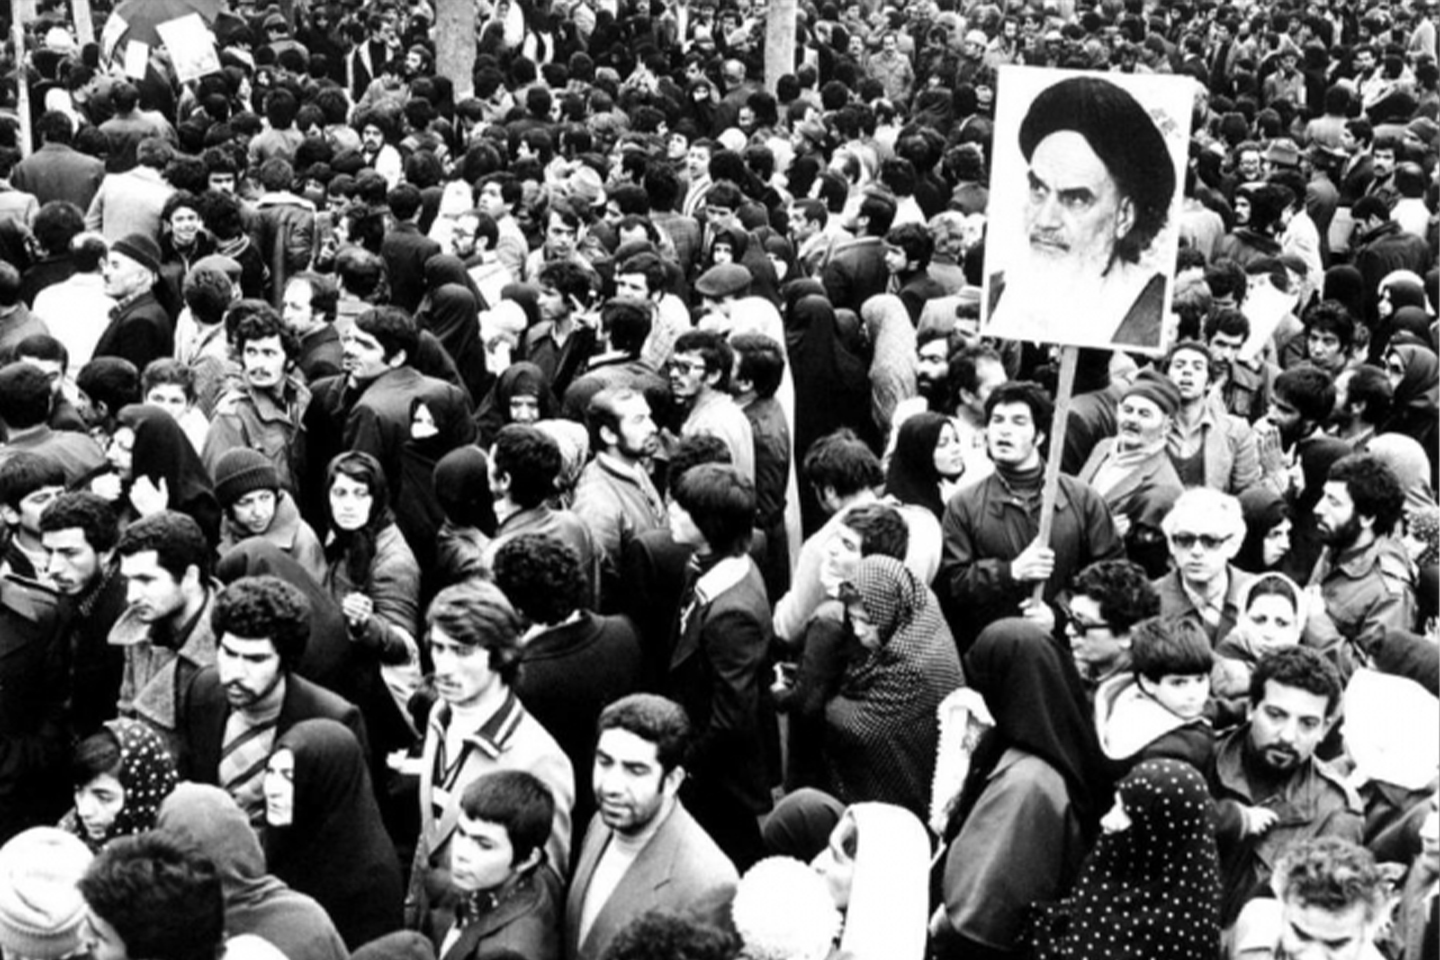

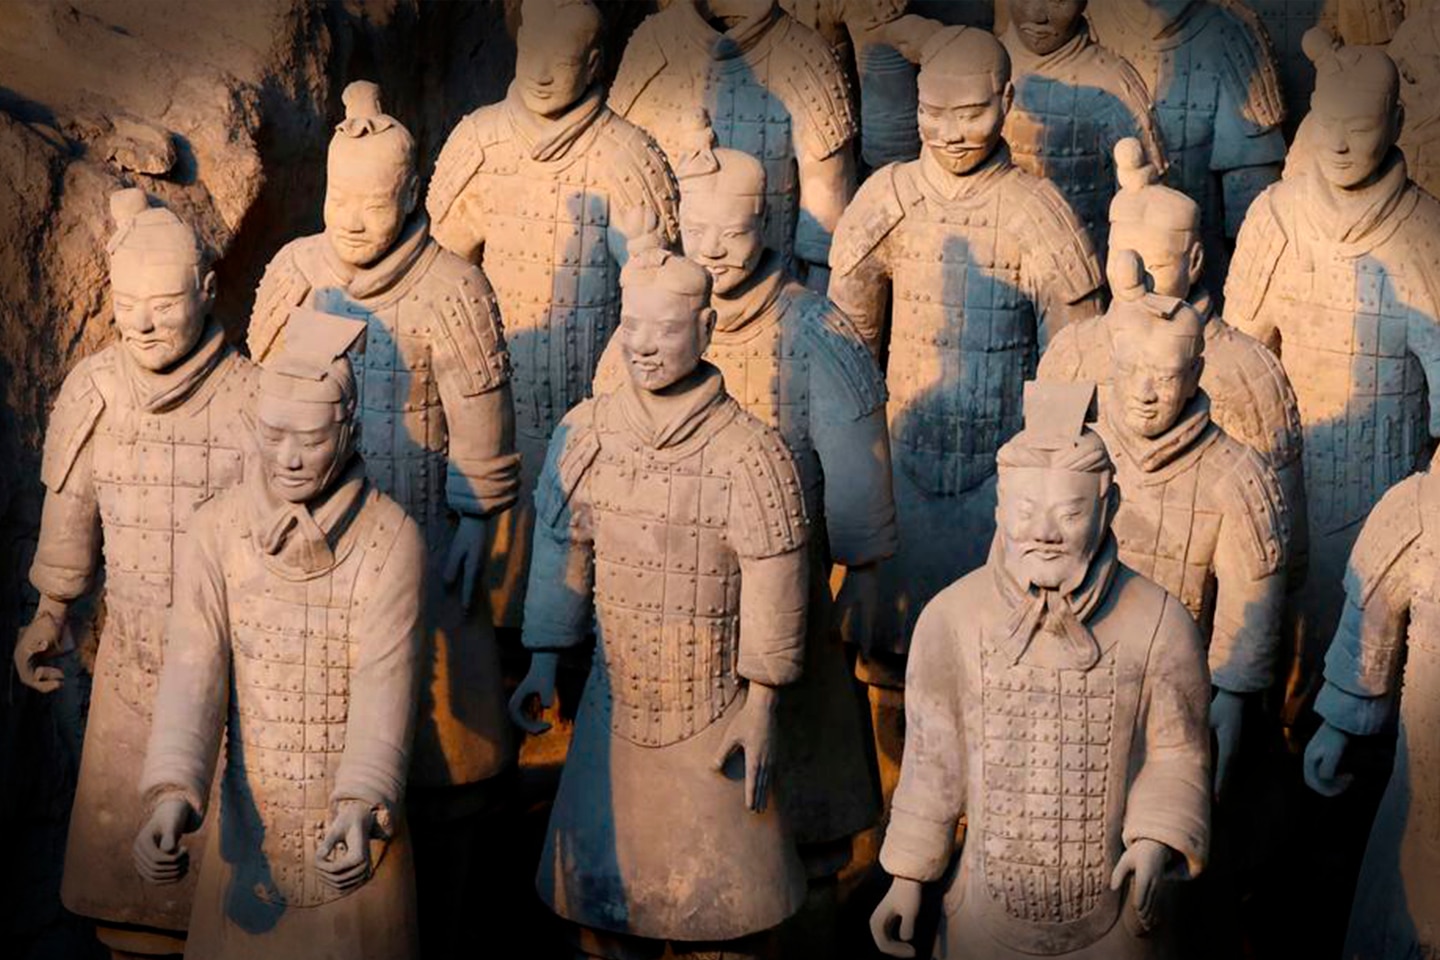


.")
.")
 Na Argentina, elas foram reprimidas por baionetas quando indagaram, em 1977, pelos filhos presos. Os generais golpistas debocharam: “son las locas de Plaza de Mayo“. Obstinadas, não desistiram. Desafiaram o terror e continuaram ocupando a Praça de Maio, desfilando o seu protesto semanal diante da Casa Rosada e da catedral até que, finamente, reconhecidas pela sociedade, contribuíram para o fim da ditadura e a prisão dos torturadores.
 Todo o processo de alfabetização ocorreu num clima que iniciou com a narração oral das historias e continuou com a criação dos desenhos, a leitura dos desenhos, a discussão sobre eles e, finalmente, com a escrita alfabética.
 A lista é longa, os mortos têm nomes, mas às vezes são identificados pelo laço de parentesco: “a filha de Sabe que mora no Mrebsna Mudî, dois tios de Mário Paruwé, o pai de Wome, uma filha de Antônio”, etc. O relatório se refere ao“desaparecimento de mais de 2.000 Waimiri-Atroari em apenas dez anos”. Na área onde se localiza hoje a Mineradora Taboca (Paranapanema) desapareceram pelo menos nove aldeias aerofotografadas pelo padre Calleri, em 1968, em sobrevoos a serviço da FUNAI. Os alunos da aldeia Yawará desenharam casas e escreveram ao lado frases como:
 O relatório informa que “as festas que reuniam periodicamente os Waimiri-Atroari foram aproveitadas pelo PARASAR para o aniquilamento dos índios”. Conta detalhes. Registra ainda o desaparecimento de índios que se aproximaram, em agosto de 1985, do canteiro de obras da hidrelétrica do Pitinga, então em construção:


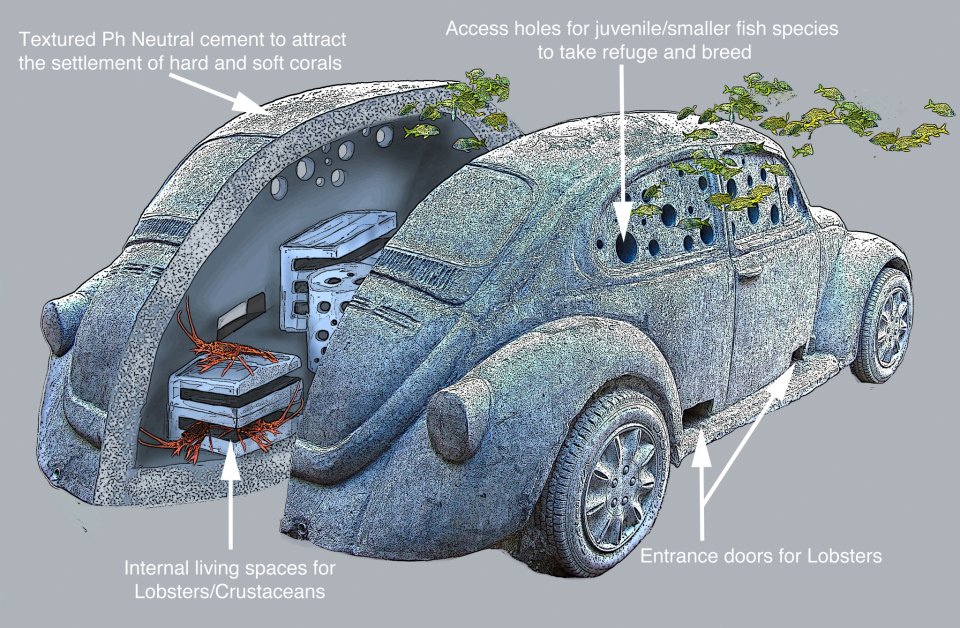


Você precisa fazer login para comentar.