Arquivo da tag: Previsão

Earth’s Most Famous Climate Scientist Issues Bombshell Sea Level Warning (Slate)

July 20, 2015

By Eric Holthaus

495456719-single-family-homes-on-islands-and-condo-buildings-on

Monday’s new study greatly increases the potential for catastrophic near-term sea level rise. Here, Miami Beach, among the most vulnerable cities to sea level rise in the world. Photo by Joe Raedle/Getty Images

In what may prove to be a turning point for political action on climate change, a breathtaking new study casts extreme doubt about the near-term stability of global sea levels.

The study—written by James Hansen, NASA’s former lead climate scientist, and 16 co-authors, many of whom are considered among the top in their fields—concludes that glaciers in Greenland and Antarctica will melt 10 times faster than previous consensus estimates, resulting in sea level rise of at least 10 feet in as little as 50 years. The study, which has not yet been peer-reviewed, brings new importance to a feedback loop in the ocean near Antarctica that results in cooler freshwater from melting glaciers forcing warmer, saltier water underneath the ice sheets, speeding up the melting rate. Hansen, who is known for being alarmist and also right, acknowledges that his study implies change far beyond previous consensus estimates. In a conference call with reporters, he said he hoped the new findings would be “substantially more persuasive than anything previously published.” I certainly find them to be.

To come to their findings, the authors used a mixture of paleoclimate records, computer models, and observations of current rates of sea level rise, but “the real world is moving somewhat faster than the model,” Hansen says.

Hansen’s study does not attempt to predict the precise timing of the feedback loop, only that it is “likely” to occur this century. The implications are mindboggling: In the study’s likely scenario, New York City—and every other coastal city on the planet—may only have a few more decades of habitability left. That dire prediction, in Hansen’s view, requires “emergency cooperation among nations.”

We conclude that continued high emissions will make multi-meter sea level rise practically unavoidable and likely to occur this century. Social disruption and economic consequences of such large sea level rise could be devastating. It is not difficult to imagine that conflicts arising from forced migrations and economic collapse might make the planet ungovernable, threatening the fabric of civilization.

The science of ice melt rates is advancing so fast, scientists have generally been reluctant to put a number to what is essentially an unpredictable, nonlinear response of ice sheets to a steadily warming ocean. With Hansen’s new study, that changes in a dramatic way. One of the study’s co-authors is Eric Rignot, whose own study last year found that glacial melt from West Antarctica now appears to be “unstoppable.” Chris Mooney, writing for Mother Jonescalled that study a “holy shit” moment for the climate.

One necessary note of caution: Hansen’s study comes via a nontraditional publishing decision by its authors. The study will be published in Atmospheric Chemistry and Physics, an open-access “discussion” journal, and will not have formal peer review prior to its appearance online later this week. The complete discussion draft circulated to journalists was 66 pages long, and included more than 300 references. The peer review will take place in real time, with responses to the work by other scientists also published online. Hansen said this publishing timeline was necessary to make the work public as soon as possible before global negotiators meet in Paris later this year. Still, the lack of traditional peer review and the fact that this study’s results go far beyond what’s been previously published will likely bring increased scrutiny. On Twitter, Ruth Mottram, a climate scientist whose work focuses on Greenland and the Arctic, was skeptical of such enormous rates of near-term sea level rise, though she defended Hansen’s decision to publish in a nontraditional way.

In 2013, Hansen left his post at NASA to become a climate activist because, in his words, “as a government employee, you can’t testify against the government.” In a wide-ranging December 2013 study, conducted to support Our Children’s Trust, a group advancing legal challenges to lax greenhouse gas emissions policies on behalf of minors, Hansen called for a “human tipping point”—essentially, a social revolution—as one of the most effective ways of combating climate change, though he still favors a bilateral carbon tax agreed upon by the United States and China as the best near-term climate policy. In the new study, Hansen writes, “there is no morally defensible excuse to delay phase-out of fossil fuel emissions as rapidly as possible.”

Asked whether Hansen has plans to personally present the new research to world leaders, he said: “Yes, but I can’t talk about that today.” What’s still uncertain is whether, like with so many previous dire warnings, world leaders will be willing to listen.

Eric Holthaus is a meteorologist who writes about weather and climate for Slate’s Future Tense. Follow him on Twitter.

The Way Humans Get Electricity Is About to Change Forever (Bloomberg)

These six shifts will transform markets over the next 25 years

The renewable-energy boom is here. Trillions of dollars will be invested over the next 25 years, driving some of the most profound changes yet in how humans get their electricity. That’s according to a new forecast by Bloomberg New Energy Finance that plots out global power markets to 2040.

Here are six massive shifts coming soon to power markets near you:

1. Solar Prices Keep Crashing

The price of solar power will continue to fall, until it becomes the cheapest form of power in a rapidly expanding number of national markets. By 2026, utility-scale solar will be competitive for the majority of the world, according to BNEF. The lifetime cost of a photovoltaic solar-power plant will drop by almost half over the next 25 years, even as the prices of fossil fuels creep higher.

Solar power will eventually get so cheap that it will outcompete new fossil-fuel plants and even start to supplant some existing coal and gas plants, potentially stranding billions in fossil-fuel infrastructure. The industrial age was built on coal. The next 25 years will be the end of its dominance.

2. Solar Billions Become Solar Trillions

With solar power so cheap, investments will surge. Expect $3.7 trillion in solar investments between now and 2040, according to BNEF. Solar alone will account for more than a third of new power capacity worldwide. Here’s how that looks on a chart, with solar appropriately dressed in yellow and fossil fuels in pernicious gray:

Electricity capacity additions, in gigawatts
Source: BNEF


3. The Revolution Will Be Decentralized 

The biggest solar revolution will take place on rooftops. High electricity prices and cheap residential battery storage will make small-scale rooftop solar ever more attractive, driving a 17-fold increase in installations. By 2040, rooftop solar will be cheaper than electricity from the grid in every major economy, and almost 13 percent of electricity worldwide will be generated from small-scale solar systems.

$2.2 Trillion Goes to Rooftops by 2040

Rooftop (small-scale) solar in yellow. Renewables account for about two-thirds of investment over the next 25 years.

4. Global Demand Slows

Yes, the world is inundated with mobile phones, flat screen TVs, and air conditioners. But growth in demand for electricity is slowing. The reason: efficiency. To cram huge amounts of processing power into pocket-sized gadgets, engineers have had to focus on how to keep those gadgets from overheating. That’s meant huge advances in energy efficiency. Switching to an LED light bulb, for example, can reduce electricity consumption by more than 80 percent.

So even as people rise from poverty to middle class faster than ever, BNEF predicts that global electricity consumption will remain relatively flat. In the next 25 years, global demand will grow about 1.8 percent a year, compared with 3 percent a year from 1990 to 2012. In wealthy OECD countries, power demand will actually decline.

This watercolor chart compares economic growth to energy efficiency. Each color represents a country or region. As economies get richer, growth requires less power.

The Beauty of Efficiency

Source: BNEF

5. Natural Gas Burns Briefly

Natural gas won’t become the oft-idealized “bridge fuel” that transitions the world from coal to renewable energy, according to BNEF. The U.S. fracking boom will help bring global prices down some, but few countries outside the U.S. will replace coal plants with natural gas. Instead, developing countries will often opt for some combination of coal, gas, and renewables.

Even in the fracking-rich U.S., wind power will be cheaper than building new gas plants by 2023, and utility-scale solar will be cheaper than gas by 2036.

Fossil fuels aren’t going to suddenly disappear. They’ll retain a 44 percent share of total electricity generation in 2040 (down from two thirds today), much of which will come from legacy plants that are cheaper to run than shut down. Developing countries will be responsible for 99 percent of new coal plants and 86 percent of new gas-fired plants between now and 2040, according to BNEF. Coal is clearly on its way out, but in developing countries that need to add capacity quickly, coal-power additions will be roughly equivalent to utility-scale solar.

Source: BNEF

6. The Climate Is Still Screwed

The shift to renewables is happening shockingly fast, but not fast enough to prevent perilous levels of global warming.

About $8 trillion, or two thirds of the world’s spending on new power capacity over the next 25 years, will go toward renewables. Still, without additional policy action by governments, global carbon dioxide emissions from the power sector will continue to rise until 2029 and will remain 13 percent higher than today’s pollution levels in 2040.

That’s not enough to prevent the surface of the Earth from heating more than 2 degrees Celsius, according to BNEF. That’s considered the point-of-no-return for some worst consequences of climate change.

CO2 emissions from the power sector don’t peak until 2029
Source: BNEF

Sabesp considera fim do Cantareira e corre contra o tempo (Exame)

JC, 5201, 22 de junho de 2015

A crise da água em São Paulo ainda não acabou

Depois que a seca do ano passado deixou São Paulo à beira de um racionamento severo de água, as chuvas do final do verão deram à Sabesp – a grande culpada pela crise, segundo autoridades municipais – uma segunda chance para aumentar investimentos em infraestrutura.

Com o início da estação seca, há uma corrida contra o tempo para desviar rios e conectar sistemas antes que os já prejudicados reservatórios de água fiquem baixos novamente.

A corrida contra o tempo ressalta a situação precária da maior metrópole da América do Sul após duas décadas sem nenhum grande projeto hídrico.

Os reservatórios ainda não se recuperaram da seca do ano passado e os meteorologistas estão prevendo meses mais quentes à frente por causa do fenômeno climático El Niño.

“A infraestrutura não foi a prioridade da Sabesp nos últimos anos. Eles não adotaram medidas para evitar a crise”, disse Pedro Caetano Mancuso, diretor do Centro de Referência em Segurança da Água da Universidade de São Paulo.

“Embora a Sabesp esteja disposta a fazer a lição de casa agora, a questão é se ela será concluída ou não a tempo de evitar um problema ainda maior”.

A Sabesp – empresa sob controle estatal -,disse que foi a severidade da seca do ano passado, e não a falta de investimentos em infraestrutura, a causa da crise.

“Nós estávamos preparados para uma seca tão ruim ou pior que a de 1953”, quando a Sabesp enfrentou uma crise similar, disse o presidente Jerson Kelman a vereadores, em uma audiência no dia 13 de maio.

“O que aconteceu em 2014 foi que tivemos metade do volume de chuva daquele ano. Para isso, nós não estávamos preparados”.

‘Previsível’

Em um relatório, em 10 de junho, a Câmara de Vereadores de São Paulo culpou a Sabesp pela crise que cortou o abastecimento em alguns bairros, dizendo que a seca já era previsível.

“Se a Sabesp tivesse investido os dividendos distribuídos na Bolsa de Nova York em obras para modernizar os sistemas que abastecem a capital e na manutenção da rede, não estaríamos enfrentando o racionamento travestido de redução de pressão”, disse Laércio Benko, vereador que liderou a comissão criada para investigar a escassez no abastecimento de água em São Paulo.

O maior dos projetos de infraestrutura que a Sabesp necessita neste ano para garantir o fornecimento de água potável está atrasado.

O projeto para conectar o Rio Pequeno ao reservatório da Billings, originalmente programado para ser concluído em maio, não será terminado até agosto devido a atrasos nas licenças ambientais e de uso da terra, disse a assessoria de imprensa da Sabesp em uma resposta a perguntas por e-mail. Se concluído neste ano, o pacote de cinco obras de emergência em que a Sabesp está investindo seria suficiente para evitar o racionamento, segundo a empresa.

Reservatório principal

Sem os projetos, e se as chuvas ficarem no nível do ano passado ou abaixo dele, a Sabesp projeta que seu reservatório principal – conhecido como Cantareira – poderá secar até agosto, segundo projeções internas obtidas pela Bloomberg News.

No pior cenário previsto pela empresa, poderá haver cortes no abastecimento de água na maior parte da área metropolitana de São Paulo cinco dias por semana, segundo o documento, que foi preparado como parte de um plano de contingência para São Paulo.

A Sabesp disse no e-mail que as chuvas, até agora, têm sido positivas. Para acelerar os investimentos de emergência agora, a Sabesp está cortando gastos e aumentando os preços da água. A empresa reduzirá os gastos com coleta e tratamento de esgoto pela metade neste ano, disseram executivos em uma teleconferência com investidores em abril. O aumento de tarifa reflete o “estresse financeiro” da Sabesp, disse o diretor financeiro Rui Affonso na conferência.

Queda das ações

As ações da Sabesp caíram 4,8 por cento na segunda-feira, pior desempenho das negociações em São Paulo, depois que a Federação das Indústrias do Estado de São Paulo (Fiesp) afirmou ter entrado com uma liminar para impedir o aumento de tarifa.

“A seca do ano passado será totalmente sentida nos resultados deste ano”, disse Alexandre Montes, analista de ações da Lopes Filho Associados Consultores de Investimentos, em entrevista por telefone, do Rio. “Mesmo se a seca diminuir agora, e mesmo se tudo sair bem, os resultados da Sabesp vão cair”.

(Revista Exame)

Investimento em mudanças climáticas já é realidade para as empresas (Envolverdes)

Juliana Guarexick
17/06/2015

85% declararam que o Brasil deveria adotar posições mais ambiciosas frente a outros países –

Pesquisa realizada pelo Instituto Datafolha com 100 empresas listadas entre as mil maiores do Brasil mostra que as mudanças climáticas já fazem parte da agenda de investimentos da iniciativa privada e que uma ação mais firme do governo para lidar com o desafio seria bem-vinda. Impressionantes 82% das empresas entrevistadas já estão adotando ações de mitigação ou adaptação às mudanças climáticas e 71% acham que políticas públicas relacionadas ao assunto beneficiariam a economia. O levantamento, encomendado pelo Observatório do Clima e pelo Greenpeace, teve como objetivo conhecer as ações adotadas pelas maiores empresas brasileiras sobre mudanças climáticas.

Os números mostram que os empresários vêem as medidas de mitigação e adaptação como algo positivo para os negócios, redundando em impactos financeiros positivos para 73% deles. A pesquisa também mostra que não há uma bala mágica para resolver o problema – as iniciativas em curso citadas foram bastante variadas e vão desde soluções para reduzir o consumo de água e energia (40%) a ações para mitigar poluentes (23%) e campanhas de educação e conscientização (12%). Entre os que estão focando na questão energética, 15% já estão utilizando energias renováveis.

“Dentro do tema ‘mudanças climáticas’, a preocupação com energia mostrou-se relevante”, destaca Carlos Rittl, secretário-executivo do Observatório do Clima. “Na pesquisa, ela aparece tanto quando falamos dos planos das empresas como quando perguntamos ao empresário o que ele acha que o governo deve fazer”, completa.

Perguntados sobre ações que o governo pode adotar para lidar com as mudanças climáticas que favorecem a inovação, os investimentos de longo prazo e retornos financeiros para as empresas, os entrevistados citaram 28 iniciativas. Entre as mais mencionadas estão a adesão à energia limpa, como solar e eólica (18%), investimentos em novas tecnologias para diminuir poluentes (12%), o incentivo tributário à preservação ambiental (12%) e ações de conservação do meio ambiente (12%). Quando questionados sobre as ações que o governo pode adotar em relação às mudanças que podem trazer retornos financeiros para o país, a energia renovável aparece com 20% de menções, atrás apenas dos investimentos em tecnologia (32%).

Para 71% dos entrevistados, as ações do governo em relação às mudanças climáticas beneficiariam a economia. Tanto que 85% declararam que o Brasil deveria adotar posições mais ambiciosas frente a outros países para lidar com as mudanças climáticas. A realidade, no entanto, não condiz com essa percepção: para 46% dos entrevistados, as iniciativas governamentais em relação ao tema são ruins ou péssimas. Para apenas 4% elas são boas ou ótimas. As opiniões dos empresários espelham as da população brasileira, avaliadas numa pesquisa anterior do Datafolha: para 48% dos entrevistados, o governo faz muito pouco contra a mudança climática.

A nova pesquisa identificou também que o tema gera algum temor: dois terços da amostra (66%) acham que os impactos das mudanças climáticas sobre a economia serão muito negativos. As principais preocupações são com a produção (queda na produtividade, diminuição no volume de vendas etc.), com o fornecimento de matérias-primas (aumento nos custos, redução da oferta) e com a produção de energia. Juntos, esses itens foram citados por 78% dos entrevistados. “O empresário já percebeu que as mudanças do clima afetam os negócios. Se eles enfrentarem o problema, pode haver impacto positivo. Se não fizerem nada, as mudanças climáticas poderão prejudicar sua atividade”, sintetiza Ricardo Baitelo, coordenador de Clima e Energia do Greenpeace Brasil.

A pesquisa foi realizada entre 17 de março e 23 de abril de 2015 por meio de entrevistas telefônicas com os cargos executivos responsáveis pelas áreas de planejamento e/ou investimentos de cem empresas que integram a lista das mil maiores corporações que atuam no Brasil segundo o ranking do Valor Econômico. Três quartos da amostra ouvida eram de nível de diretoria. O levantamento contemplou organizações dos mais variados setores econômicos: comércio varejista, alimentos, agropecuária, metalurgia e mineração, química e petroquímica, eletroeletrônica, construção e engenharia, comércio atacadista, água e saneamento, veículos e peças, transporte e logística, plásticos e borracha, papel e celulose, mecânica, energia elétrica, TI e telecom, têxtil e vestuário, petróleo e gás, açúcar e álcool, materiais de construção, fumo, educação e ensino. (#Envolverde)

There never was a global warming ‘pause,’ NOAA study concludes (Environment & Energy Publishing)

Gayathri Vaidyanathan, E&E reporter

Published: Friday, June 5, 2015

The global warming “pause” does not exist, according to scientists at the National Oceanic and Atmospheric Administration.

Their finding refutes a theory that has dominated climate science in recent years. The Intergovernmental Panel on Climate Change (IPCC) in 2013 found that global temperatures in recent years have not risen as quickly as they did in the 20th century. That launched an academic hunt for the missing heat in the oceans, volcanoes and solar rays. Meanwhile, climate deniers triumphantly crowed that global warming has paused or gone on a “hiatus.”

But it now appears that the pause never was. NOAA scientists have fixed some small errors in global temperature data and found that temperatures over the past 15 years have been rising at a rate comparable to warming over the 20th century. The study was published yesterday inScience.

That a minor change to the analysis can switch the outcome from a hiatus to increased warming shows “how fragile a concept it [the hiatus] was in the first place,” said Gavin Schmidt, director of the NASA Goddard Institute for Space Studies, who was unaffiliated with the study.

According to the NOAA study, the world has warmed since 1998 by 0.11 degree Celsius per decade. Scientists had previously calculated that the trend was about half that.

The new rate is equal to the rate of warming seen between 1951 and 1999.

There has been no slowdown in the rate of global warming, said Thomas Karl, director of NOAA’s National Centers for Environmental Information and lead author of the study.

“Global warming is firmly entrenched on our planet, and it continues to progress and is likely to continue to do so in the future unless emissions of greenhouse gases are substantially altered,” he said.

Errors from weather stations, buoys and buckets

That NOAA has to adjust temperature readings is not unusual. Many factors can affect raw temperature measurements, according to a study by Karl in 1988.

For instance, a weather station may be situated beneath a tree, which would bias temperatures low. Measurements made near a parking lot would read warm due to the waves of heat emanating from asphalt surfaces. NOAA and other agencies adjust the raw temperature data to remove such biases.

It has become clear in recent years that some biases still persist in the data, particularly of ocean temperatures. The culprit: buckets.

Ships traverse the world, and, occasionally, workers onboard dip a bucket over the hull and bring up water that they measure using a thermometer. The method is old school and error prone — water in a bucket is usually cooler than the ocean.

For a long time, scientists had assumed that most ships no longer use buckets and instead measure water siphoned from the ocean to cool ship engines. The latter method is more robust. But data released last year showed otherwise and compelled NOAA to correct for this bias.

A second correction involved sensor-laden buoys interspersed across the oceans whose temperature readings are biased low. Karl and his colleagues corrected for this issue, as well.

The corrections “made a significant impact,” Karl said. “They added about 0.06 degrees C per decade additional warming since 2000.”

The ‘slowdown hasn’t gone away’

What that means for the global warming hiatus depends on whom you ask. The warming trend over the past 15 years is comparable to the trend between 1950 and 1998 (a 48-year stretch), which led Karl to say that global warming never slowed.

Other scientists were not fully convinced. For a truly apples-to-apples comparison, the past 15 years should be compared with other 15-year stretches, said Peter Stott, head of the climate monitoring and attribution team at the U.K. Met Office.

For instance, the globe warmed more slowly in the past 15 years than between 1983 and 1998 (the previous 15-year stretch), even with NOAA’s new data corrections, Stott said.

“The slowdown hasn’t gone away,” he said in an email. “While the Earth continues to accumulate energy as a result of increasing man-made greenhouse gas emissions … global temperatures have not increased smoothly.”

The disagreements arise because assigning trends — including the trend of a “hiatus” — to global warming depends on the time frame of reference.

“Trends based on short records are very sensitive to the beginning and end dates and do not in general reflect long-term climate trends,” the IPCC stated in 2013, even as it discussed the pause.

Robert Kaufmann, an environment professor at Boston University who was unaffiliated with the study, called trends a “red herring.”

A trend implies that the planet will warm, decade after decade, at a steady clip. There is no reason why that should be the case, Kaufmann said. Many factors — human emissions of warming and cooling gases, natural variability, and external factors such as the sun — feed into Earth’s climate. The relative contributions of each factor can vary by year, decade, century or on even larger time scales.

“There is no scientific basis to assume that the climate is going to warm at the same rate year after year, decade after decade,” he said.

Copying the language of skeptics

Trends are a powerful weapon in the hands of climate deniers. As early as 2006, deniers used the slowdown of warming from 1998 onward to say that global warming had stopped or paused.

The idea of a “pause” seeped into academia, launching dozens of studies into what might have caused it. But there was a subtle difference between scientists’ understanding of the pause and that of the skeptics; scientists never believed that warming had stopped, only that it had slowed compared with the rapidly warming ’90s. They wanted to know why.

Over the years, scientists have unraveled the contributions of volcanoes to global cooling, the increased uptake of heat by the Pacific Ocean, the cooling role of La Niñas and other drivers of natural variability. Their understanding of our planet’s climate evolved rapidly.

As scientists wrote up their findings, they unwittingly adopted the skeptics’ language of the “pause,” said Stephan Lewandowsky, a psychologist at the University of Bristol who was unaffiliated with the NOAA study. That was problematic.

“That’s sort of a subtle semantic thing, but it is really important because it suggests that these [scientists] bought into the existence of the hiatus,” he said.

Then, in 2013, the IPCC wrote about the pause. The German government complained that the term implies that warming had stopped, which is inaccurate. The objection was ignored.

NOAA’s strong refutation of the hiatus is particularly weighty because it comes from a government lab, and the work was headed by Karl, a pioneer of temperature reanalysis studies.

NOAA will be using the data corrections to assess global temperatures from July onward, Karl said. NASA is discussing internally whether to apply the fixes suggested in the study, according to Schmidt of NASA.

The study was greeted by Democrats in Congress as proof that climate change is real. Sen. Barbara Boxer (D-Calif.), ranking member of the Environment and Public Works Committee, used it as an opportunity to chide her opponents.

“Climate change deniers in Congress need to stop ignoring the fact that the planet may be warming at an even faster rate than previously observed, and we must take action now to reduce dangerous carbon pollution,” she said in a statement.

California’s Snowpack Is Now Zero Percent of Normal (Slate)

By Eric Holthaus MAY 29 2015 2:56 PM

468284618-stump-sits-at-the-site-of-a-manual-snow-survey-on-april

A stump sits at the site of a manual snow survey on April 1, 2015 in Phillips, California. The current recorded level is zero, the lowest in recorded history for California. Photo by Max Whittaker/Getty Images

California’s current megadrought hit a shocking new low this week: On Thursday, the state’s snowpack officially ran out.

At least some measurable snowpack in the Sierra mountains usually lasts all summer. But this year, its early demise means that runoff from the mountains—which usually makes up the bulk of surface water for farms and cities during the long summer dry season—will be essentially non-existent. To be clear: there’s still a bit of snow left, and some water will be released from reservoirs (which are themselves dangerously low), but this is essentially a worst-case scenario when it comes to California’s fragile water supply.

zero_percent_CAsnowpack

This week’s automated survey found California’s statewide snowpack had officially run out. California Department of Water Resources

The state knew this was coming and has been working to help soften the blow—but they’re fighting a losing battle. Bottom line: 2014 was the state’s hottest year in history, and 2015 is on pace to break that record. It’s been too warm for snow. Back in April, Gov. Jerry Brown enacted the state’s first-ever mandatory water restrictionsfor urban areas based mostly on the abysmal snowpack. In recent days, the state’s conservation efforts have turned to farmers—who use about 80 percent of California’s water.

With a burgeoning El Niño on the way, there’s reason to believe the rains could return soon—but not before October or November. The state’s now mired in such a deep water deficit that even a Texas-sized flood may not totally eliminate the drought.

Welcome to climate change, everyone.

Cemaden faz nova projeção da reserva do Cantareira no período de seca (MCTI/Cemaden)

Levantamento do Centro Nacional de Monitoramento e Alertas de Desastres Naturais indica chuvas e reservas abaixo da média histórica até dezembro

O Centro Nacional de Monitoramento e Alertas de Desastres Naturais (Cemaden/MCTI) aponta no último relatório, publicado na quarta-feira (27), as situações críticas do Reservatório do Sistema Cantareira, indicando chuvas e reservas abaixo da média histórica, até dezembro deste ano.

Essa situação ocorrerá mesmo com a inclusão dos dados da diminuição da captação de água do reservatório, prevista para os meses de setembro até novembro, anunciada pelo Comunicado Conjunto da Agência Nacional de Água (ANA) e do Departamento de Águas e Energia Elétrica (DAEE), na última semana de maio.

Com base nas redes pluviométricas do Cemaden e do DAEE, cobrindo as sub-bacias de captação do Sistema Cantareira, durante o período de outubro de 2014 a março de 2015, a precipitação média espacial acumulada foi de 879 milímetros (mm), equivalente a 73,5% da média climatológica, registrada em 1.161 mm para o mesmo período.

A precipitação média espacial acumulada no mês de abril de 2015 foi de 52,4 mm, representando 58,4% da média climatológica do mês, registrado em 89,83 mm. A chuva acumulada no período de 1º até 29 de maio de 2015 foi registrada com uma precipitação média de 55,3 mm, que representa 70,7% do total de chuvas da média histórica do mesmo período, registrada em 78,2 mm. No relatório, também são indicados os valores da precipitação média dos dados da Companhia de Saneamento Básico do Estado de São Paulo (Sabesp), que têm algumas variações com relação aos dados do Cemaden.

Na situação atual, a vazão média do Sistema Cantareira, ou seja, o cálculo entre o volume de água e o seu reabastecimento com as chuvas, está abaixo da média climatológica. A vazão média afluente ao Sistema Cantareira no mês de maio foi de 14,02 metros cúbicos por segundo (m3/s), ou seja, 63,4% abaixo da vazão média mensal de 38,27 m3/s. Também está abaixo da vazão mínima histórica de 19,90 m3/s, representando apenas 29,5% do total da média histórica.

Projeções

O relatório do cenário hídrico do Sistema Cantareira, divulgado, periodicamente, desde janeiro de 2015, tem os cálculos das projeções da vazão afluente no modelo hidrológico, implementado pelo Cemaden, com base na previsão de chuva do Centro de Previsão de Tempo e Estudos Climáticos (CPTEC) do Inpe para sete dias. A partir do oitavo dia, são apresentadas projeções com base em cinco cenários de chuvas (na média histórica, 25% e 50% abaixo e acima da média). Finalmente, considerando um cenário de extração ou captação de água do Sistema Cantareira são obtidas as projeções da evolução do armazenamento.

No último relatório, considerou-se a extração total do Sistema Cantareira igual a 17,0 m³ por segundo no período de 1º de junho a 31 de agosto e também no mês de dezembro de 2015. No período de 1º de setembro a 30 de novembro, considerou-se a captação de água dos reservatórios igual a 13,5 m³ por segundo.

No cenário de precipitações pluviométricas na média climatológica, no final da estação seca, início de outubro, o volume armazenado seria de 188,66 milhões de m3, aproximadamente. “Esse volume armazenado representa 14,9% da reserva total do Cantareira, ou seja, a soma do volume útil e os dois volumes mortos, com o total estimado em 1.269,5 milhões de m³”, destaca a hidróloga do Cemaden Adriana Cuartas, responsável pelo relatório do Cantareira.

Nesse cenário de precipitações dentro da média histórica, no dia 1º de dezembro de 2015, o volume armazenado seria, aproximadamente, de 227,72 milhões de m³, que representaria 17,9% do volume da reserva total do Cantareira.

Para um cenário de precipitações pluviométricas iguais à média climatológica, o chamado volume morto 1 seria recuperado ao longo da última semana de dezembro, aproximadamente. Considerando o cenário de chuvas 25% acima da média climatológica, o volume morto 1 seria recuperado na última semana de novembro.

Acesse o documento.

(MCTI, via Cemaden)

Previsão do clima: terremotos intermitentes (Folha de S.Paulo)

Marcelo Leite, 03/05/2015  01h57

Depois de Katmandu, o terremoto no Nepal sacudiu também uma noção preconcebida comum entre jornalistas de ciência – esta coluna, por exemplo, foi abalada por um tuíte de Matthew Shirts, que levava para uma reportagem da revista “Newsweek”.

A leitura do texto, “Mais Terremotos Fatais Virão, Alertam Cientistas da Mudança do Clima”, trouxe à memória um momento constrangedor. Que o relato sirva para desencorajar nossa tendência a acreditar em verdades estabelecidas.

Certa vez um colega de redação perguntou se eu poderia escrever para explicar por que tsunamis estavam se tornando mais frequentes e qual era a relação disso com o aquecimento global. Segurei a vontade de rir e expliquei, condescendente, que processos climáticos não tinham o poder de desencadear eventos geológicos.

Não é bem assim. Há pesquisadores respeitáveis investigando a hipótese de que a mudança climática deflagrada pelo aquecimento global possa, sim, tornar terremotos e erupções vulcânicas mais frequentes.

Não seria nada inédito na história da Terra. Um exemplo recentíssimo na escala geológica (o planeta tem mais de 4 bilhões de anos) ocorreu entre 20 mil e 12 mil anos atrás, ao término do último período glacial.

A retração de geleiras continentais com quilômetros de espessura aliviou a pressão sobre a crosta terrestre o bastante para desencadear intensa atividade vulcânica. Há boas evidências disso em lugares como a Islândia.

O geólogo britânico Bill McGuire tem uma teoria ainda mais preocupante. Ele acha que a elevação dos mares em 100 m, causada pelo derretimento das calotas de gelo, teria deflagrado também terremotos e tsunamis (o que poderia repetir-se a partir de agora, com o aquecimento da atmosfera).

O imenso volume de água adicionado aos oceanos, ao pressionar suas bordas, teria desestabilizado as falhas geológicas próximas da costa, causando os tremores e colapsos submarinos que levantam ondas colossais. Mas a hipótese de McGuire, detalhada no livro “Acordando o Gigante”, ainda carece de medições e dados para ser aceita.

No caso do terremoto de Katmandu, o mecanismo pressuposto para pôr a culpa no clima é outro: chuva. Não uma pancada qualquer, mas as poderosas monções que castigam Índia e Nepal de junho a agosto.

Tamanho volume de água, que perde só para o movimentado na bacia Amazônica, seria capaz de alterar o balanço do estresse entre as placas Indo-Australiana e Asiática. O geólogo argelino Pierre Bettinelli, então no CalTech, mostrou que a atividade sísmica nos Himalaias é duas vezes mais intensa no inverno e atribuiu isso à gangorra de pressões entre os dois lados da falha tectônica.

Falta provar, claro. Mas que é instigante, isso é.

Quanto a terremotos causados pelo aquecimento global, ninguém precisa sair comprando kits de sobrevivência. O degelo da última glaciação demorou milhares de anos, e as piores previsões para a subida no nível dos oceanos indicam não muito mais que 1 m ou 2 m até o final deste século.

Ninguém está a salvo de tsunamis, porém. Há alguma chance – uma vez a cada 10 mil anos, talvez – de que o litoral brasileiro seja atingido por um deles, como pode ter ocorrido com São Vicente em 1541, após cataclisma nalgum ponto do Atlântico.

Clima marombado (Folha de S.Paulo)

Marcelo Leite, 31/05/2015  01h45

Como o jornal anda cheio de notícias boas, esta coluna retoma sua predileção desmesurada pelas más novas impopulares e anuncia: 2015 caminha para ser dos infernos também na esfera do clima.

É provável, por exemplo, que este ano bata o recorde de temperatura global. A marca estava antes, veja só, com 2014. Os dez anos mais escaldantes ocorreram todos depois de 1998.

Um dos que acreditam no novo recorde é o alemão Stefan Rahmstorf. O climatologista do Instituto Potsdam de Pesquisa sobre Impacto do Clima, que ficou famoso em 2007 por criticar as previsões do IPCC como muito conservadoras, lançou sua predição para 20 jornalistas de 17 países reunidos em Berlim há 20 dias.

O período janeiro-abril de 2015 brindou o planeta com o primeiro quadrimestre mais quente já registrado desde 1880. O período de 12 meses compreendido entre maio de 2014 e abril de 2015 também foi o pior em matéria de calor.

Isso tudo já acontecia enquanto o fenômeno El Niño ainda era considerado fraco. Esse aquecimento anormal das águas do Pacífico na costa oeste sul-americana, que costuma abrasar o clima mundial, ganhou impulso neste mês de maio e deve permanecer até o segundo semestre.

Notícia péssima para o Nordeste brasileiro. O semiárido tem bolsões que enfrentam o quarto ano seguido de seca. Entre os efeitos mais conhecidos de um El Niño está exatamente a diminuição das chuvas nessa região do Brasil (assim como o aumento da precipitação no Sul).

Pior é a situação na Índia. Até sexta-feira (29), uma onda de calor –a pior em duas décadas, com temperaturas de 47 graus Celsius– havia causado mais de 2.000 mortes. E o El Niño pode atrasar e enfraquecer as monções, chuvas torrenciais que começam em junho e poderiam refrescar o segundo país mais populoso do mundo.

Enquanto indianos torram, amazonenses estão debaixo d’água. A cheia do rio Negro, também ela perto de bater recordes, já atrapalhou a vida de 238 mil pessoas em 33 municípios do Estado do Amazonas.

O governo estadual se limita a medidas de remediação. Mais de 450 toneladas de alimentos não perecíveis foram distribuídas, assim como “kits dormitório” (colchões, redes e mosquiteiros) e “kits de higiene pessoal” para milhares de desabrigados.

Também foram destinados às cidades atingidas 68 metros cúbicos de madeira e 750 kits de tábuas, caibros e ripões para os moradores construírem passarelas elevadas conhecidas como “marombas”.

Essa enchente provavelmente nada tem a ver com o El Niño, e também seria difícil demonstrar um nexo causal entre a onda de calor indiana e a anomalia no Pacífico. Os dois eventos constituem bons exemplos, contudo, das situações extremas que a mudança do clima em curso deverá tornar mais frequentes nas próximas décadas.

Pelo andar da carruagem das negociações internacionais, parece cada vez mais difícil, se não impossível, que se consiga evitar um aquecimento global maior que 2 graus Celsius neste século. Esse é o limite de segurança indicado pelo IPCC.

A mudança do clima está contratada. Não resta muito mais que adaptar-se –e preparar a infraestrutura das cidades para ela exigirá muito mais do que marombas improvisadas.

So far, most atolls winning the sea level rise battle (Pacific Institute of Public Policy)

So far, most atolls winning the sea level rise battle

An increasing number of atoll studies are not supporting claims of Pacific island leaders that “islands are sinking.” Scientific studies published this year show, for example, that land area in Tuvalu’s capital atoll of Funafuti grew seven percent over the past century despite significant sea level rise. Another study reported that 23 of 27 atoll islands across Kiribati, Tuvalu and the Federated States of Micronesia either increased in area or remained stable over recent decades.

Speaking about Kiribati, Canadian climatologist Simon Donner commented in the Scientific American: ‘Right now it is clear that no one needs to immediately wall in the islands or evacuate all the inhabitants. What the people of Kiribati and other low-lying countries need instead are well-thought-out, customized adaption plans and consistent international aid — not a breathless rush for a quick fix that makes the rest of the world feel good but obliges the island residents to play the part of helpless victim.’

These same climate scientists who are conducting ongoing research in Tuvalu, Kiribati and the Marshall Islands acknowledge the documented fact of sea level rise in the Pacific, and the potential threat this poses. But they are making the point, as articulated by Donner, that ‘the politicized public discourse on climate change is less nuanced than the science of reef islands.’

A recent report carried in Geology, the publication of the Geological Society of America, says Tuvalu has experienced ‘some of the highest rates of sea level rise over the past 60 years.’ At the same time, ‘no islands have been lost, the majority have enlarged, and there has been a 7.3 percent increase in net island area over the past century.’

To gain international attention to climate concerns and motivate funding to respond to what is described as climate damage, political leaders from the Pacific are predicting dire consequences.

The future viability of the Marshall Islands — and all island nations — is at stake,’ Marshall Islands Foreign Minister Tony deBrum told the global climate meeting in Peru last December.

‘It keeps me awake at night,’ said Tuvalu Prime Minister Enele Sopoaga in a recent interview. ‘Will we survive? Or will we disappear under the sea?’

Obviously, statements of island leaders at international meetings and the observations of recent scientific reports are at odds. Does it matter?

Comments Donner: ‘Exaggeration, whatever its impetus, inevitably invites backlash, which is bad because it can prevent the nation from getting the right kind of help.’

If we want to grab headlines, the ‘disappearing island’ theme is good. But to find solutions to, for example, the increasing number of ocean inundations that are occurring requires well-thought out plans.

Scientists studying these low-lying islands should be seen as allies, whose information can be used to focus attention on key areas of need. For example, the New Zealand and Australian scientists working in Tuvalu said their results “show that islands can persist on reefs under rates of sea level rise on the order of five millimeters per year.” With sea level rates projected to double in the coming years, ‘it is unclear whether islands will continue to maintain their dynamic adjustment at these higher rates of change,’ they said. ‘The challenge for low-lying atoll nations is to develop flexible adaptation strategies that recognize the likely persistence of islands over the next century, recognize the different modes of island change, and accommodate the ongoing dynamism of island margins.’

Developing precise information on atoll nations as these scientists are doing is needed to inform policy makers and local residents as people are inundated with discussion about — and, possibly, outside donor funding for — ‘adaptation’ and ‘mitigation’ in these islands.

In the 1990s and early 2000s, the Nuclear Claims Tribunal in the Marshall Islands hired internationally recognized scientists and medical doctors to advise it on such things as radiation exposure standards for nuclear test clean up programs and medical conditions deserving of compensation, while evaluating U.S. government scientific studies on the Marshall Islands. These scientists and doctors provided knowledge and advice that helped inform the compensation and claims process.

It seems this nuclear test-related model would be of significant benefit to islands in the region, by linking independent climate scientists with island governments so there is a connection between science and climate policies and actions of governments.

If we want to grab headlines, the ‘disappearing island’ theme is good. But to find solutions to, for example, the increasing number of ocean inundations that are occurring requires well-thought out plans.

‘The reality is that the next few decades for low-lying reef islands will be defined by an unsexy, expensive slog to adapt,’ wrote Donner in the Scientific American. ‘Success will not come from single land purchase or limited-term aid projects. It will come from years of trial and error and a long-term investment by the international community in implementing solutions tailored to specific locales.’ He comments that a World Bank-supported adaptation program in Kiribati took eight years of consultation, training, policy development and identifying priorities to finally produce a plan of action. And even then, when they rolled out sea walls for several locations, there were design faults that need to be fixed. Donner’s observation about Kiribati could equally apply to the rest of the Pacific: “Responding to climate change in a place like Kiribati requires a sustained commitment to building local scientific and engineering capacity and learning from mistakes.”

It is excellent advice.

Image: Low-lying islands, such as Majuro Atoll pictured here, are changing due to storms, erosion, high tides, seawalls and causeways, and sea level rise. But few are disappearing. Photo credit: Isaac Marty

Recorde histórico de CO2 (Observatório do Clima)

11/05/2015

Por Claudio Angelo, do OC –

A notícia correu o mundo nesta semana: a concentração de dióxido de carbono na atmosfera ultrapassou em março a marca simbólica de 400 partes por milhão, segundo anunciou a Noaa (Agência Nacional de Oceanos e Atmosfera dos EUA). É a primeira vez que isso acontece desde que a agência começou a medir esse gás em 40 pontos diferentes do planeta, na década de 1980.

Da última vez que houve tanto CO2 na atmosfera, provavelmente 3,5 milhões de anos atrás, não existiam seres humanos, nem gelo no polo Norte. A temperatura média global era de cerca de 3oC mais alta do que no período pré-industrial. O nível do mar era 4 a 5 metros mais alto do que hoje.

O anúncio foi tratado pela imprensa internacional como um “alerta vermelho” no ano da conferência do clima de Paris, que deveria (mas tem gente que acha que não vai) apontar o início da solução do problema do aquecimento global. Embora o recorde seja em si importante, o problema real é a tendência que ele indica.

Quatrocentas partes por milhão, ou ppm, é um número pequeno. Significa que, em cada milhão de moléculas de ar, há 400 de gás carbônico (lembre-se de que a atmosfera é composta quase totalmente de nitrogênio e oxigênio; o CO2 é um dos “gases-traço”, daqueles que juntos formam 1% da composição do ar).

Acontece que o gás carbônico faz o melhor estilo “chiquitito, pero cumplidor”: ele é extremamente eficiente em reter na atmosfera o calor que a Terra irradia em forma de radiação infravermelha. Não satisfeito, ele ajuda a elevar, por evaporação, os níveis atmosféricos de outro gás-estufa muito potente: o vapor d’água. Isso mesmo: como sua mãe já deve ter dito, até água em excesso faz mal.

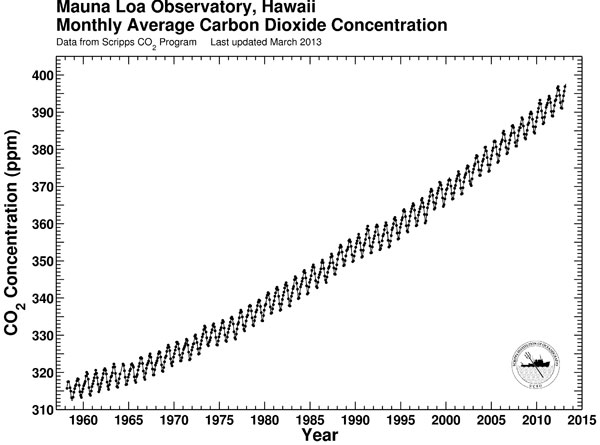
As medições da concentração de CO2 na atmosfera começaram a ser feitas em 1958 pelo americano Charles Keeling no alto do vulcão Mauna Loa, no Havaí. O local foi escolhido por estar bem longe de fontes de poluição que pudessem enviesar as amostras de ar. O Mauna Loa, a 4.000 metros de altitude e no meio do Oceano Pacífico, representa bem como o CO2 está misturado à atmosfera global.

Quando as medições de Keeling começaram, a concentração de CO2 no ar estava em 315 ppm. Em 2013 elas ultrapassaram 400 ppm no Mauna Loa pela primeira vez, para caírem em seguida e fecharem o ano em 393 ppm. Os dados da Noaa mostram que o mesmo sinal foi detectado não apenas em um ponto, mas em dezenas de lugares diferentes mundo afora.

Assim como aconteceu em 2013, o valor vai cair nos próximos meses e fechar o ano abaixo de 400 ppm. A oscilação acontece porque no final do inverno no hemisfério Norte, onde está a maior parte das terras (portanto, da vegetação) do mundo, há muito carbono no ar. Ele vem da da decomposição das folhas que caíram no outono. Na primavera, a rebrota sequestra esse CO2 e a concentração cai novamente.

O problema, claro, é que essa concentração vem subindo de forma acelerada ano após ano. Em todo o período pré-industrial, a concentração de CO2 na atmosfera jamais ultrapassou 280 ppm. Do surgimento da espécie humana até o ano em que Keeling começou a fazer suas medições, o aumento foi de 12,5%, no máximo. Da primeira vitória do Brasil numa Copa do Mundo até hoje, o aumento já foi de outros 27%. A velocidade anual de crescimento dobrou entre 2000 e 2010 em relação a 1960-1970. Metade do aumento verificado desde a aurora da humanidade aconteceu depois de 1980.

A chamada "curva de Keeling", com o crescimento das concentrações de CO2 desde a década de 1950


Nesse ritmo, o CO2 terá dobrado em relação à era pré-industrial antes do final do século. Os modelos climáticos apontam que, com duas vezes mais CO2 no ar, o aumento da temperatura da Terra seria de cerca de 3oC, valor muito superior ao limite considerado “seguro” (e, para alguns, já inatingível) de 2oC acima da média pré-industrial. Segundo o IPCC, o painel do clima da ONU, para ter uma chance de 50% de atingir os 2oC, os níveis de CO2 precisariam estacionar em 450 ppm e depois cair.

Os 400 ppm são um número bizantino, mas importante por isso: apenas 50 ppm separam a humanidade de entrar em um território climático nunca antes explorado – e, ao que tudo indica, de forma alguma agradável. (Observatório do Clima/ #Envolverde)

* Publicado originalmente no site Observatório do Clima.

Sea level rise accelerating faster than thought (Science)

High tides swamp a playground in coastal Wales.

DIMITRIS LEGAKIS/SPLASH NEWS/NEWSCOM. High tides swamp a playground in coastal Wales.

If you’re still thinking about buying that beach house, think again. A new study suggests that sea levels aren’t just rising; they’re gaining ground faster than ever. That’s contrary to earlier work that suggested rising seas had slowed in recent years.

The result won’t come as a shock to most climate scientists. Long-term records from coastal tide gauges have shown that sea level rise accelerated throughout the 20th century. Models predict the trend will continue. However, previous studies based on satellite measurements—which began in 1993 and provide the most robust estimates of sea level—revealed that the rate of rise had slowed in the past decade compared with the one before.

That recent slowdown puzzled researchers, because sea level contributions from melting ice in Antarctica and Greenland are actually increasing, says Christopher Watson, a geodesist at the University of Tasmania in Australia. So he and colleagues took a closer look at the available satellite and tide gauge data, and tried to correct for other factors that might skew sea level measurements, like small changes in coastal elevation.

The results, published today in Nature Climate Change, show that global mean sea level rose slightly slower than previously thought between 1993 and 2014, but that sea level rise is indeed accelerating. The new findings agree more closely with other records of changing sea levels, like those produced by tide gauges and bottom-up accounting of the contributions from ocean warming and melting ice.

In the past, researchers have used tide gauges to keep tabs on the performance of satellite altimeters, which use radar to measure the height of the sea surface. The comparison allowed them to sniff out and cope with any issues that cropped up with the satellite sensors. Tide gauges themselves are not immune to problems, however; the land on which they rest can shift during earthquakes, or subside because of groundwater withdrawal or sediment settling. These processes can produce apparent changes in sea level that have nothing to do with the oceans.

So Watson’s team tried to correct for the rise and fall of tide gauge sites by using nearby GPS stations, which measure land motions. If no GPS stations were present, they used computer models to estimate known changes, such as how some regions continue to rebound from the last glaciation, when heavy ice sheets caused land to sink.

The newly recalibrated numbers show that the earliest part of the satellite record, collected between 1993 and 1999 by the first altimetry mission, known as TOPEX/Poseidon, appears to have overstated sea level rise. That’s probably because a sensor deteriorated, ultimately forcing engineers to turn on a backup instrument. When combined with data from subsequent satellite missions, those inflated TOPEX/Poseidon numbers gave the appearance that sea level rise was decelerating, even as the global climate warmed.

Also contributing to the apparent slowdown was a hiccup caused by natural climate variation, says John Church, a climate scientist at the Commonwealth Scientific and Industrial Research Organisation in Hobart, Australia, and a co-author of the new study. Around 2011, “there was a major dip in sea level associated with major flooding events in Australia and elsewhere,” he says. Intense rainfall transferred water from the oceans to the continents, temporarily overriding the long-term sea level trend.

The corrected record now shows that sea level rose 2.6 millimeters to 2.9 millimeters per year since 1993, compared with prior estimates of 3.2 millimeters per year. Despite the slower rates, the study found that sea level rise accelerated by an additional 0.04 millimeters per year, although the acceleration is not statistically significant. Watson says he expects that trend to grow stronger as researchers collect more data.

The acceleration falls in line with predictions from the Intergovernmental Panel on Climate Change (IPCC), Watson notes. “We’re tracking at that upper bound” of the IPCC’s business-as-usual scenario for greenhouse gas emissions, he says, which could bring up to one meter of sea level rise by 2100.

Others say it’s too early to tell. “The IPCC is looking way out in time,” says geodesist Steve Nerem of the University of Colorado, Boulder, who was not involved in the study. “This is only 20 years of data.”

In the meantime, Nerem says, the altimetry community needs to focus on continuing to improve the satellite data. He thinks Watson’s team “addressed it in the best way we can right now,” but it would be even better “to have a GPS receiver at every tide gauge, and right now that’s not the case.”

Regardless, the underlying message is clear, Church says: Sea levels are rising at ever increasing rates, and society needs to take notice.

Experts Warn of “Cataclysmic” Changes as Planetary Temperatures Rise (Truthout)

Monday, 27 April 2015 00:00 By Dahr Jamail, Truthout | Report 

Two unprecedentedly high temperatures were recorded in Antarctica, providing an ominous sign of accelerating ACD as one of the readings came in at just over 63 degrees Fahrenheit. (Photo: Iceberg via Shutterstock)

Two unprecedentedly high temperatures were recorded in Antarctica, providing an ominous sign of accelerating climate change as one of the readings came in at just more than 63 degrees Fahrenheit. (Photo: Iceberg via Shutterstock)

Climate Disruption DispatchesThis month’s anthropogenic climate disruption (ACD) dispatch begins with the fact that recently released National Oceanic and Atmospheric Administration data show that this March was, by far, the hottest planetary March ever recorded, and the hottest January to March period on record as well.

We are watching unprecedented melting of glaciers across the planet, increasingly high temperature records and epic-level droughts that are now becoming the new normal: Planetary distress signals are increasing in volume.

One of these took place recently in Antarctica, of all places, where two unprecedentedly high temperatures were recorded, providing an ominous sign of accelerating ACD as one of the readings came in at just over 63 degrees Fahrenheit.

“We’re going to be out of water.”

A fascinating recent report shows that approximately 12 million people living in coastal areas will be displaced during the next 85 years, with areas along the Eastern Seaboard of the United States seeing some of the most dramatic impacts.

In the US, another report shows that the Navajo Nation is literally dying of thirst, with one of the nation’s leaders flatly sounding the alarm by stating, “We’re going to be out of water.”

A study just published in Geophysical Research Lettersbolsters the case that a period of much faster ACD is imminent, if it hasn’t already begun.

On that note, leading climate researchers recently saidthere is a possibility that the world will see a 6-degree Celsius temperature increase by 2100, which would lead to “cataclysmic changes” and “unimaginable consequences for human civilization.”

With these developments in mind, let us take a look at recent developments across the planet since the last dispatch.

Earth

Signs of ACD’s impact across this sector of the planet are once again plentiful, and the fact that the Amazon is suffering is always a very loud alarm buzzer, given that every year the world’s largest rainforest cycles through 18 billion tons of carbon when its 6 million square kilometers of trees breathe in carbon dioxide and then release it back into the atmosphere when they die. This is twice the amount of carbon that fossil fuel burning emits in an entire year. A recent report shows that while the Amazon is continuing to absorb more carbon than it is releasing, a tipping point is coming, and likely soon, as deforestation, drought and fires there continue to remove precious trees at a frightful rate. With 1.5 acres of rainforest lost every single second, somewhere around the world, the situation in the Amazon does not bode well for our future.

In the United States, in Harvard Forest, located 70 miles west of the university’s campus in Cambridge, Massachusetts, hemlock trees are dying at an alarming rate. Harvard Forest is a case study, as it is part of a network of 60 forests around the world called the Center for Tropical Forest Science-Forest Global Earth Observatories, where they are being studied for their response to ACD and other anthropogenic issues. Kristina Anderson-Teixeira, an ecologist with the network, said its forests are “being impacted by a number of different global change factors. We do expect more of this, be it pests or pathogens or droughts or heat waves or thawing permafrost.”

Another report from April revealed that Russia has been losing an amount of forest the size of Switzerland (16,600 square miles of tree cover) every year, for three years running.

Without ice in the summer, polar bears will starve and die off.

Terrestrial animals continue to struggle to survive in many areas. It should come as no surprise that in the Arctic, a recent studyshows that the theory that polar bears will be able to adapt to ice-free seas in the summer by eating on land has been debunked. Without ice in the summer, polar bears will starve and die off.

Another study shows that ACD is threatening mountain goats, due to the warming that is occurring even at the higher elevations where the goats live, as the rate of warming there is two to three times faster than the rest of the planet. According to the study, due to the warming, the goats’ future is now uncertain.

In California, sea lion strandings have already reached more than 2,250 for this year alone, which is a record. The worsening phenomenon is being blamed on warming seas that are disrupting the food supply of marine mammals.

Across the United States, hunters are seeing their traditions being changed by ACD. “I could point you to a million different forums online where hunters are complaining about the season and how hunting is terrible,” said one hunter in a recent report. “At the end of the day, it’s changing weather patterns. Winters around here are not as cold as they used to be.”

March report from a researcher in Rhode Island showed that the growth and molting rates of juvenile lobsters are decreasing “significantly” due to oceans becoming increasingly acidic from ACD. This makes the animals more vulnerable to predations, thus leading to fewer adult lobsters and an overall rapidly declining population.

Air

There have been a few major developments recently in this sector of our analysis.

Interestingly, some of the more commonly used anesthetics are apparently accumulating in the planet’s atmosphere, thus contributing to warming of the climate, according to a report in April. It is a small amount, mind you, but the volume is increasing.

US greenhouse gas pollution increased 2 percent over the previous year in 2013.

Bad news on the mitigation front comes in the form of a study that revealed that ongoing urban sprawl and auto exhaust is hampering cities’ best efforts toward lowering carbon dioxide emissions. If people continue to drive as much as they are, and development continues apace, the push to build more dense housing, better transit systems and more bike lanes in urban centers will be for naught.

Speaking of lack of mitigation, the US Environmental Protection Agency recently announced that US greenhouse gas pollution increased 2 percent over the previous year in 2013.

Drought plagued California gets more bad news in this sector, as recently released data shows that the state continues to have its warmest year ever recorded, with statewide temperatures coming in nearly 2 degrees Fahrenheit warmer than the previous record, which was set in 2014. The state is quite literally baking.

Another study showed that the frozen soil (permafrost) of the planets’ northern polar regions that holds billions of tons of organic carbon is melting and that melting is being sped up by ACD, hence releasing even more carbon into our already carbon dioxide-supersaturated atmosphere.

Lastly in this section, those who believe in technological fixes for our predicament received some bad news in April, which came in the form of a report that shows that any attempts to geoengineer the climate are likely to result in “different” climate disruption, rather than an elimination of the problem. The most popular proposed idea of solar radiation management that would utilize stratospheric sulfate aerosols to dim the sun has been proven to be, well, destructive. Using a variety of climate models, Ken Caldeira from the Carnegie Institution for Science in Stanford, California, has investigated the likely consequences of such geoengineering on agriculture across the globe.

According to a report on the matter:

His research showed that while dimming could rapidly decrease global temperatures, high carbon dioxide levels would be expected to persist, and it is the balance between temperature, carbon dioxide, and sunlight that affects plant growth and agriculture. Exploring the regional effects, he finds that a stratospherically dimmed world would show increased plant productivity in the tropics, but lessened plant growth across the northerly latitudes of America, Europe and Asia. It is easy to see how there might be geopolitical shifts associated with changes in regional food production across the globe. “It’s probably the poor tropics that stand to benefit and the rich north that stands to lose,” said Prof Caldeira.

Hence, given that the results would be detrimental to the “rich north,” which by far and away has pumped more carbon dioxide into the atmosphere than the “poor tropics,” the results of geoengineering would indeed be karmic.

Water

In the United States, California’s epic drought continues to lead in the water sector of analysis.

For the first time in California’s history, mandatory water use reductions have been imposed on residents after a winter of record-low snowfalls, and hence a record-low snowpack. “People should realize we are in a new era,” Gov. Jerry Brown said at a news conference there in April, standing on a patch of brown and green grass that would normally be thick with snow that time of year. “The idea of your nice little green lawn getting watered every day, those days are past.”

Climate scientists also recently announced, disconcertingly, that California’s record-breaking drought is merely a preview of future ACD-generated megadroughts.

Shortly after Brown announced the mandatory water restrictions for his state, another study was released showing that California will also be facing more extreme heat waves, along with rising seas, caused by increasingly intense impacts from ACD. According to the study, the average number of days with temperatures reaching 95 degrees will double or even triple by the end of this century. Simultaneously, at least $19 billion worth of coastal property will literally disappear as sea levels continue to rise.

Experts also announced in April that in “drought-era” California, “every day” should now be considered “fire season.” NASA Jet Propulsion Laboratory climatologist Bill Patzert said of California, “We are in an incendiary situation.”

California’s state climatologist, Michael Anderson, issued a very stark warning in April when he said the state faces dust bowl-like conditions, as he compared the water crisis in California to the legendary US dustbowl. “You’re looking on numbers that are right on par with what was the Dust Bowl,” he said.

Forty out of the 50 US states will face a water shortage within the next 10 years.

As aforementioned, this year’s dry, warm winter has left the entire western United States snowpack at record-low levels. Given that this is a critical source of fresh surface water for the entire region, this will only exacerbate the already critical water shortages that are plaguing the region.

One ramification of this is exampled by how the once-powerful Rio Grande River has been reduced to a mere trickle still hundreds of miles from its destination at the end of its 1,900-mile journey to the Gulf of Mexico, thanks to the increasing impacts of ACD. Farmers and residents who rely on it for water are in deep trouble.

And it’s not just California and the US Southwest that are dealing with major water shortages. The Government Accountability Office recently released a report showing that 40 out of the 50 US states will face a water shortage within the next 10 years.

Meanwhile, up in Alaska, that state’s iconic Iditarod sled dog race has been reduced to having mushers have their dogs drag their sleds across large swaths of mud that spanned over 100 miles in some areas, due to warmer temperatures there melting snow and ice that used to cover the course. “I love the challenge, being able to overcome anything on the trail,” said four-time winner Martin Buser of the new conditions. “But if this is a new normal, I’m not sure I can sustain it.”

In this writer’s backyard, glaciers are melting away at dramatic rates in Olympic National Park. Pictures tell the story, which was also addressed in detail recently at a talk given at the park by University of Washington research professor Michelle Koutnik, who was part of a team monitoring the park’s Blue Glacier. By way of example, an entire section of the lower Blue Glacier that existed in 1989 was completely gone by 2008, and melt rates are increasing. A sobering “before and after” look at the photographic evidence should not be missed.

A recent study gave another grim report on glaciers, this one focusing on Canada where glaciers in British Columbia and Alberta are projected to shrink by at least 70 percent by the end of this century, and of course ACD was noted as the main driving force behind the change. “Most of that is going to go,” one of the researchers said of Canada’s glaciers. “And most seems to be on its way out.”

study recently published in the Proceedings of the National Academy of Sciences has found that as the Arctic Ocean warms and loses its sea ice cover, phytoplankton populations will explode. This creates another positive feedback loop for ACD, as it further amplifies warming in a region that is already heating up twice as fast as the rest of the globe.

On the other end of the water spectrum, rising seas continue to afflict Venice, where the city is seeing dramatic changes. According to a recent report: “In the 1920s, there were about 400 incidents of acqua alta, or high water, when the right mix of tides and winds drives the liquid streets up into homes and shops in the lowers parts of the city. By the 1990s, there were 2,400 incidents – and new records are set every year.”

Fire

An April report shows that ACD is predicted to bring more fires and less snow to the iconic Yellowstone National Park. These changes will likely fuel catastrophic wildfires, cause declines in mountain snows and threaten the survival of animals and plants, according to the scientists who authored the report. It shows that expected warming over the US West over the next three decades will transform the land in and around Yellowstone from a wetter, mostly forested Rocky Mountain ecosystem into a more open landscape, more akin to the arid US Southwest.

“Ecological Implications of Climate Change on the Greater Yellowstone Ecosystem,” compiled by more than 20 university and government scientists, said that such dry conditions in that area have not been seen for the last 10,000 years, and extremely destructive wildfires like the one in 1988 that burned thousands of acres of the park are going to become more common, while years without major fires will become rare.

Denial and Reality

The climate disruption deniers have been barking loudly over the last month, which should be expected as irrefutable evidence of ACD continues in an avalanche.

Following Florida’s lead, Wisconsin officially became the next state to censor its employees’ work regarding climate disruption. Wisconsin has banned its employees from working on ACD, after Florida banned the use of the terms “climate change” and “global warming.”

Perhaps this is what played a role in inspiring acclaimed astrophysicist Neil deGrasse Tyson to proclaim that politicians denying science is “the beginning of the end of an informed democracy.”

Facing a loss of high-profile corporate sponsors, the American Legislative Exchange Council (ALEC), now tired of being accused of ACD denial, has threatened actionagainst activist groups that accuse it of denying ACD. This “action” could come in the form of lawsuits.

The Yale Project on Climate Change Communication released very interesting county-by-county maps of the United States, which show the various levels of ACD denial across the country and are worth examining.

Over the last four years, extreme weather events in the US caused 1,286 fatalities and $227 billion in economic losses.

Not to be outdone by fellow Republican ACD-denying presidential candidates, Marco Rubio voluntarily donned the dunce cap by stating that scientists have not determined what percentage of ACD is due to human activities compared to natural climate variability, and added brilliantly, “climate is always changing.”

This year has seen us cross yet another milestone in the Arctic – this one being that sea ice covering the top of the world reached the lowest maximum extent yet observed during the winter. This means, ominously, that in just the last four years Arctic sea ice has seen a new low both for its seasonal winter peak (2015) and for its summer minimum (2012). While most sane people would see this as a gut-wrenching fact to have to process emotionally, Robert Molnar, the CEO of the Sailing the Arctic Race, is busily planning an “extreme yacht race” for the summer and fall of 2017 there. “The more ice that’s being melted, the more free water is there for us to be sailing,” he said.

In stark contrast, US Secretary of State John Kerry is visiting the Arctic amid concerns over the melting ice, and some of the mainstream media, in this case The Washington Post, are running op-eds claiming that ACD deniers are actually now in retreat due to their own outlandish comments.

In a historic move, even oil giant BP’s shareholders voted overwhelmingly to support a resolution that would force the company to disclose some of its ACD-related risks.

Also on the reality front, recently released analysis shows that densely populated Asian islands and countries like Hong Kong, Japan, Taiwan and the Philippines are likely to face even more intense climatic events in the future.

Another report, this one titled “An Era of Extreme Weather” by the Center for American Progress, shows that major weather events across the United States in 2014 cost an estimated $19 billion and caused at least 65 human fatalities. The report also shows that over the last four years, extreme weather events in the US caused 1,286 fatalities and $227 billion in economic losses spanning 44 states.

US President Barack Obama formally submitted to the UN a commitment to reduce US greenhouse gas emissions by up to 28 percent below 2005 levels by 2025. Critics believe this is far too little, too late, but at least it is a move in the right direction.

In an interesting twist of fate, while many Florida Republican lawmakers are busily denying ACD, other Florida Republicans are busy working to protect their state’s coastal areas from rising seas resulting from advancing ACD.

Lastly in this month’s dispatch, a recently published study shows that acidic oceans helped fuel the largest mass extinction event in the history of the planet, which wiped out approximately 90 percent of all life on earth.

The carbon released that was one of the primary drivers of that extinction event was found to have been released at a similar rate to modern emissions. Dr. Matthew Clarkson, one of the authors of the study, commented: “Scientists have long suspected that an ocean acidification event occurred during the greatest mass extinction of all time, but direct evidence has been lacking until now. This is a worrying finding, considering that we can already see an increase in ocean acidity today that is the result of human carbon emissions.”

Copyright, Truthout. May not be reprinted without permission

Alteração comportamental de animais sinaliza, dias antes, a ocorrência de terremotos (Pesquisa Fapesp)

27 de abril de 2015

Estudo realizado no Parque Nacional Yanachaga, no Peru, correlacionou mudanças de comportamento de aves e pequenos mamíferos com a ionização da atmosfera causada pelo atrito subterrâneo das rochas (roedor paca [Cuniculus paca] filmado por uma camera tipo ‘motion-triggered’ / foto TEAM Network; teamnetwork.org)

José Tadeu Arantes | Agência FAPESP – O dado de que alterações no comportamento dos animais sinalizam, com horas ou dias de antecedência, eventos como os terremotos já era conhecido. Especialmente noticiada foi a disparada dos elefantes asiáticos para terras altas por ocasião do terremoto seguido de tsunami de 26 de dezembro de 2004. Muitas vidas humanas foram salvas graças a isso. Mas tais eventos ainda não haviam sido documentados de maneira rigorosa e conclusiva. Nem fora estabelecida uma correlação de causa e efeito entre essa modificação do comportamento animal e fenômenos físicos mensuráveis.

Isso ocorreu agora em pesquisa realizada por Rachel Grant, da Anglia Ruskin University (Reino Unido), Friedemann Freund, da agência espacial Nasa (Estados Unidos), e Jean-Pierre Raulin, do Centro de Radioastronomia e Astrofísica Mackenzie (Brasil). Artigo relatando o estudo, “Changes in Animal Activity Prior to a Major (M=7) Earthquake in the Peruvian Andes”, foi publicado na revista Physics and Chemistry of the Earth.

O físico Jean-Pierre Raulin, professor da Universidade Presbiteriana Mackenzie, participou do estudo no contexto do projeto de pesquisa “Monitoramento da atividade solar e da Anomalia Magnética do Atlântico Sul (AMAS) utilizando uma rede de receptores de ondas de muita baixa frequência (VLF) – SAVNET – South América VLF network”, apoiado pela FAPESP.

“Nosso estudo correlacionou alterações no comportamento de aves e pequenos mamíferos do Parque Nacional Yanachaga, no Peru, com distúrbios na ionosfera terrestre, ambos os fenômenos verificados vários dias antes do terremoto Contamana, de 7,0 graus de magnitude na escala Richter, que ocorreu nos Andes peruanos em 2011”, disse Raulin à Agência FAPESP.

Os animais foram monitorados por um conjunto de câmeras. “Para não interferir em seu comportamento, essas câmeras eram acionadas de forma automática no momento em que o animal passava na sua frente, registrando a passagem por meio de flash de luz infravermelha”, detalhou o pesquisador. Em um dia comum, cada animal era avistado de cinco a 15 vezes. Porém, no intervalo de 23 dias que antecedeu o terremoto, o número de avistamentos por animal caiu para cinco ou menos. E, em cinco dos sete dias imediatamente anteriores ao evento sísmico, nenhum movimento de animal foi registrado.

Nessa mesma época, por meio do monitoramento das propriedades de propagação de ondas de rádio de muito baixa frequência (VLF), os pesquisadores detectaram, duas semanas antes do terremoto, perturbações na ionosfera sobre a área ao redor do epicentro. Um distúrbio especialmente grande da ionosfera foi registrado oito dias antes do terremoto, coincidindo com o segundo decréscimo no avistamento dos animais.

Os pesquisadores propuseram uma explicação capaz de correlacionar os dois fenômenos. Segundo eles, a formação maciça de íons positivos, devido à fricção subterrânea das rochas durante o período anterior ao terremoto, teria provocado tanto as perturbações medidas na ionosfera quanto a alteração comportamental dos animais. A fricção é resultado da subducção ou deslizamento da placa tectônica de Nazca sob a placa tectônica continental.

É sabido que a maior concentração de íons positivos na atmosfera provoca, seja em animais, seja em humanos, um aumento dos níveis de serotonina na corrente sanguínea. Isso leva à chamada “síndrome da serotonina”, caracterizada por maior agitação, hiperatividade e confusão. O fenômeno é semelhante à inquietação, facilmente perceptível em humanos, que ocorre antes das tempestades, quando a concentração de elétrons nas bases das nuvens também provoca um acúmulo de íons positivos na camada da atmosfera próxima ao solo, gerando um intenso campo elétrico no espaço intermediário.

“No caso dos terremotos, cargas positivas formadas no subsolo devido ao estresse das rochas migram rapidamente para a superfície, resultando na ionização maciça de moléculas do ar. Em algumas horas, os íons positivos assim formados alcançam a base da ionosfera, localizada cerca de 70 quilômetros acima do solo. Esse aporte maciço de íons teria provocado as flutuações da densidade eletrônica na baixa ionosfera que detectamos. Por outro lado, durante o trânsito subterrâneo das cargas positivas, devido a uma espécie de ‘efeito de ponta’, a ionização tende a se acumular perto das elevações topográficas locais – exatamente onde estavam localizadas as câmeras. Nossa hipótese foi que, para se livrar dos sintomas indesejáveis da síndrome da serotonina, os animais fugiram para áreas mais baixas, onde a ionização não é tão expressiva”, explicou Raulin.

“Acreditamos que ambas as anomalias surgiram a partir de uma única causa: a atividade sísmica causando estresse na crosta terrestre e levando, entre outras coisas, à enorme ionização na interface solo-ar. Esperamos que nosso trabalho possa estimular ainda mais a investigação na área, que tem o potencial de auxiliar as previsões de curto prazo de riscos sísmicos”, declarou Rachel Grant, principal autora do artigo.

Independentemente da observação do comportamento animal, os resultados obtidos mostram que a previsão de terremotos poderia ser feita também mediante a detecção da ionização do ar, com o monitoramento do campo elétrico atmosférico. “Já temos detectores instalados no Brasil, no Peru e na Argentina. E pretendemos, em breve, instalar sensores de campo elétrico atmosférico nos lugares propícios a atividades sísmicas importantes. Isso daria uma previsibilidade da ordem de duas semanas ou até mais. Por ocasião do terremoto do Haiti, em janeiro de 2010, a rede SAVNET já tinha detectado flutuações na ionosfera com 12 dias de antecedência, com resultados publicados na revista NHESS – Natural Hazards and Earth System Sciences”, afirmou Raulin.

Out of Place: Space/Time and Quantum (In)security (The Disorder of Things)

APRIL 21, 2015 – DRLJSHEPHERD

A demon lives behind my left eye. As a migraine sufferer, I have developed a very personal relationship with my pain and its perceived causes. On a bad day, with a crippling sensitivity to light, nausea, and the feeling that the blood flowing to my brain has slowed to a crawl and is the poisoned consistency of pancake batter, I feel the presence of this demon keenly.

On the first day of the Q2 Symposium, however, which I was delighted to attend recently, the demon was in a tricksy mood, rather than out for blood: this was a vestibular migraine. The symptoms of this particular neurological condition are dizziness, loss of balance, and sensitivity to motion. Basically, when the demon manifests in this way, I feel constantly as though I am falling: falling over, falling out of place. The Q Symposium, hosted by James Der Derian and the marvellous team at the University of Sydney’s Centre for International Security Studies,  was intended, over the course of two days and a series of presentations, interventions, and media engagements,  to unsettle, to make participants think differently about space/time and security, thinking through quantum rather than classical theory, but I do not think that this is what the organisers had in mind.

photo of cabins and corridors at Q Station, SydneyAt the Q Station, located in Sydney where the Q Symposium was held, my pain and my present aligned: I felt out of place, I felt I was falling out of place. I did not expect to like the Q Station. It is the former quarantine station used by the colonial administration to isolate immigrants they suspected of carrying infectious diseases. Its location, on the North Head of Sydney and now within the Sydney Harbour National Park, was chosen for strategic reasons – it is secluded, easy to manage, a passageway point on the journey through to the inner harbour – but it has a much longer historical relationship with healing and disease. The North Head is a site of Aboriginal cultural significance; the space was used by the spiritual leaders (koradgee) of the Guringai peoples for healing and burial ceremonies.

So I did not expect to like it, as such an overt symbol of the colonisation of Aboriginal lands, but it disarmed me. It is a place of great natural beauty, and it has been revived with respect, I felt, for the rich spiritual heritage of the space that extended long prior to the establishment of the Quarantine Station in 1835. When we Q2 Symposium participants were welcomed to country by and invited to participate in a smoking ceremony to protect us as we passed through the space, we were reminded of this history and thus reminded – gently, respectfully (perhaps more respectfully than we deserved) – that this is not ‘our’ place. We were out of place.

We were all out of place at the Q2 Symposium. That is the point. Positioning us thus was deliberate; we were to see whether voluntary quarantine would produce new interactions and new insights, guided by the Q Vision, to see how quantum theory ‘responds to global events like natural and unnatural disasters, regime change and diplomatic negotiations that phase-shift with media interventions from states to sub-states, local to global, public to private, organised to chaotic, virtual to real and back again, often in a single news cycle’. It was two days of rich intellectual exploration and conversation, and – as is the case when these experiments work – beautiful connections began to develop between those conversations and the people conversing, conversations about peace, security, and innovation, big conversations about space, and time.

I felt out of place. Mine is not the language of quantum theory. I learned so much from listening to my fellow participants, but I was insecure; as the migraine took hold on the first day, I was not only physically but intellectually feeling as though I was continually falling out of the moment, struggling to maintain the connections between what I was hearing and what I thought I knew.

Quantum theory departs from classical theory in the proposition of entanglement and the uncertainty principle:

This principle states the impossibility of simultaneously specifying the precise position and momentum of any particle. In other words, physicists cannot measure the position of a particle, for example, without causing a disturbance in the velocity of that particle. Knowledge about position and velocity are said to be complementary, that is, they cannot be precise at the same time.

I do not know anything about quantum theory – I found it hard to follow even the beginner’s guides provided by the eloquent speakers at the Symposium – but I know a lot about uncertainty. I also feel that I know something about entanglement, perhaps not as it is conceived of within quantum physics, but perhaps that is the point of events such as the Q Symposium: to encourage us to allow the unfamiliar to flow through and around us until the stream snags, to produce an idea or at least a moment of alternative cognition.

My moment of alternative cognition was caused by foetal microchimerism, a connection that flashed for me while I was listening to a physicist talk about entanglement. Scientists have shown that during gestation, foetal cells migrate into the body of the mother and can be found in the brain, spleen, liver, and elsewhere decades later. There are (possibly) parts of my son in my brain, literally as well as simply metaphorically (as the latter was already clear). I am entangled with him in ways that I cannot comprehend. Listening to the speakers discuss entanglement, all I could think was, This is what entanglement means to me, it is in my body.

Perhaps I am not proposing entanglement as Schrödinger does, as ‘the characteristic trait of quantum mechanics, the one that enforces its entire departure from classical lines of thought’. Perhaps I am just using the concept of entanglement to denote the inextricable, inexplicable, relationality that I have with my son, my family, my community, humanity. It is this entanglement that undoes me, to use Judith Butler’s most eloquent phrase, in the face of grief, violence, and injustice. Perhaps this is the value of the quantum: to make connections that are not possible within the confines of classical thought.

I am not a scientist. I am a messy body out of place, my ‘self’ apparently composed of bodies out of place. My world is not reducible. My uncertainty is vast. All of these things make me insecure, challenge how I move through professional time and space as I navigate the academy. But when I return home from my time in quarantine and joyfully reconnect with my family, I am grounded by how I perceive my entanglement. It is love, not science, that makes me a better scholar.

photo of sign that says 'laboratory and mortuary' from Q station, sydney.

I was inspired by what I heard, witnessed, discussed at the Q2 Symposium. I was – and remain – inspired by the vision of the organisers, the refusal to be bound by classical logics in any field that turns into a drive, a desire to push our exploration of security, peace, and war in new directions. We need new directions; our classical ideas have failed us, and failed humanity, a point made by Colin Wight during his remarks on the final panel at the Symposium. Too often we continue to act as though the world is our laboratory; we have ‘all these theories yet the bodies keep piling up…‘.

But if this is the case, I must ask: do we need a quantum turn to get us to a space within which we can admit entanglement, admit uncertainty, admit that we are out of place? We are never (only) our ‘selves’: we are always both wave and particle and all that is in between and it is our being entangled that renders us human. We know this from philosophy, from art and the humanities. Can we not learn this from art? Must we turn to science (again)? I felt diminished by the asking of these questions, insecure, but I did not feel that these questions were out of place.

Extending climate predictability beyond El Niño (Science Daily)

Date: April 21, 2015

Source: University of Hawaii – SOEST

Summary: Tropical Pacific climate variations and their global weather impacts may be predicted much further in advance than previously thought, according to research by an international team of climate scientists. The source of this predictability lies in the tight interactions between the ocean and the atmosphere and among the Atlantic, the Pacific and the Indian Oceans. Such long-term tropical climate forecasts are useful to the public and policy makers, researchers say.


This image shows inter-basin coupling as a cause of multi-year tropical Pacific climate predictability: Impact of Atlantic warming on global atmospheric Walker Circulation (arrows). Rising air over the Atlantic subsides over the equatorial Pacific, causing central Pacific sea surface cooling, which in turn reinforces the large-scale wind anomalies. Credit: Yoshimitsu Chikamoto

Tropical Pacific climate variations and their global weather impacts may be predicted much further in advance than previously thought, according to research by an international team of climate scientists from the USA, Australia, and Japan. The source of this predictability lies in the tight interactions between the ocean and the atmosphere and among the Atlantic, the Pacific and the Indian Oceans. Such long-term tropical climate forecasts are useful to the public and policy makers.

At present computer simulations can predict the occurrence of an El Niño event at best three seasons in advance. Climate modeling centers worldwide generate and disseminate these forecasts on an operational basis. Scientists have assumed that the skill and reliability of such tropical climate forecasts drop rapidly for lead times longer than one year.

The new findings of predictable climate variations up to three years in advance are based on a series of hindcast computer modeling experiments, which included observed ocean temperature and salinity data. The results are presented in the April 21, 2015, online issue of Nature Communications.

“We found that, even three to four years after starting the prediction, the model was still tracking the observations well,” says Yoshimitsu Chikamoto at the University of Hawaii at Manoa International Pacific Research Center and lead author of the study. “This implies that central Pacific climate conditions can be predicted over several years ahead.”

“The mechanism is simple,” states co-author Shang-Ping Xie from the University of California San Diego. “Warmer water in the Atlantic heats up the atmosphere. Rising air and increased precipitation drive a large atmospheric circulation cell, which then sinks over the Central Pacific. The relatively dry air feeds surface winds back into the Atlantic and the Indian Ocean. These winds cool the Central Pacific leading to conditions, which are similar to a La Niña Modoki event. The central Pacific cooling then strengthens the global atmospheric circulation anomalies.”

“Our results present a paradigm shift,” explains co-author Axel Timmermann, climate scientist and professor at the University of Hawaii. “Whereas the Pacific was previously considered the main driver of tropical climate variability and the Atlantic and Indian Ocean its slaves, our results document a much more active role for the Atlantic Ocean in determining conditions in the other two ocean basins. The coupling between the oceans is established by a massive reorganization of the atmospheric circulation.”

The impacts of the findings are wide-ranging. “Central Pacific temperature changes have a remote effect on rainfall in California and Australia. Seeing the Atlantic as an important contributor to these rainfall shifts, which happen as far away as Australia, came to us as a great surprise. It highlights the fact that on multi-year timescales we have to view climate variability in a global perspective, rather than through a basin-wide lens,” says Jing-Jia Luo, co-author of the study and climate scientist at the Bureau of Meteorology in Australia.

“Our study fills the gap between the well-established seasonal predictions and internationally ongoing decadal forecasting efforts. We anticipate that the main results will soon be corroborated by other climate computer models,” concludes co-author Masahide Kimoto from the University of Tokyo, Japan.

Journal Reference:

  1. Yoshimitsu Chikamoto, Axel Timmermann, Jing-Jia Luo, Takashi Mochizuki, Masahide Kimoto, Masahiro Watanabe, Masayoshi Ishii, Shang-Ping Xie, Fei-Fei Jin. Skilful multi-year predictions of tropical trans-basin climate variabilityNature Communications, 2015; 6: 6869 DOI: 10.1038/ncomms7869

Software tool allows scientists to correct climate ‘misinformation’ from major media outlets (ClimateWire)

ClimateWire, April 13, 2015.

Manon Verchot, E&E reporter
Published: Monday, April 13, 2015
After years of misinformation about climate change and climate science in the media, more than two dozen climate scientists are developing a Web browser plugin to right the wrongs in climate reporting.

The plugin, called Climate Feedback and developed by Hypothes.is, a nonprofit software developer, allows researchers to annotate articles in major media publications and correct errors made by journalists.

“People’s views about climate science depend far too much on their politics and what their favorite politicians are saying,” said Aaron Huertas, science communications officer at the Union of Concerned Scientists. “Misinformation hurts our ability to make rational decisions. It’s up to journalists to tell the public what we really know, though it can be difficult to make time to do that, especially when covering breaking news.”

An analysis from the Union of Concerned Scientists found that levels of inaccuracy surrounding climate change vary dramatically depending on the news outlet. In 2013, 72 percent of climate-related coverage on Fox News contained misleading statements, compared to 30 percent on CNN and 8 percent on MSNBC.

Through Climate Feedback, researchers can comment on inaccurate statements and rate the credibility of articles. The group focuses on annotating articles from news outlets it considers influential — like The Wall Street Journal or The New York Times — rather than blogs.

“When you read an article it’s not just about it being wrong or right — it’s much more complicated than that,” said Emmanuel Vincent, a climate scientist at the University of California, Merced’s Center for Climate Communication, who developed the idea behind Climate Feedback. “People still get confused about the basics of climate change.”

‘It’s crucial in a democracy’

According to Vincent, one of the things journalists struggle with most is articulating the effect of climate change on extreme weather events. Though hurricanes or other major storms cannot be directly attributed to climate change, scientists expect warmer ocean temperatures and higher levels of water vapor in the atmosphere to make storms more intense. Factors like sea-level rise are expected to make hurricanes more devastating as higher sea levels allow storm surges to pass over existing infrastructure.

“Trying to connect a weather event with climate change is not the best approach,” Vincent said.

Climate Feedback hopes to clarify issues like these. The group’s first task was annotating an article published inThe Wall Street Journal in September 2014.

In the piece, the newspaper reported that sea-level rise experienced today is the same as sea-level rise experienced 70 years ago. But in the annotated version of the story, Vincent pointed to research from Columbia University that directly contradicted that idea.

“The rate of sea level rise has actually quadrupled since preindustrial times,” wrote Vincent in the margins.

Vincent hopes that tools like Climate Feedback can help journalists learn to better communicate climate research and can make members of the public confident that the information they are receiving is credible.

Researchers who want to contribute to Climate Feedback are required to have published at least one climate-related article that passed a peer review. Many say these tools are particularly important in the Internet era, when masses of information make it difficult for the public to wade through the vast quantities of articles and reports.

“There are big decisions that need to be made about climate change,” Vincent said. “It’s crucial in a democracy for people to know about these issues.”

Michael Lewis: Our Appetite for Apocalypse (Radio Open Source)

AUDIO

m lewis redoMichael Lewis is the non-fiction novelist of our apocalyptic American mindset in 2010. The heroes of The Big Short, as he puts it in conversation “were betting on the end of the world… The only characters you can really trust are the people who are delivering a very, very dark message.”

Michael Lewis, remember, was never really a sportswriter, despite MoneyballCoach and The Blind Side. Nor was he ever a finance guy, despite the prescience of Liar’s Poker and his sure touch now with the Wall Street collapse of 2007-2008. Michael Lewis’s real business and his genius instinct is for resonant social fables that just happen to play out on ballfields and bond markets.

The Big Short is a high literary feat, complete with a real-life “unreliable narrator,” a particularly despised contrarian bond dealer, Greg Lippmann, who was betting brazenly against his own market. “The guy selling the best ideas is a completely untrustworthy character,” the author remarks. The true center of The Big Short is an atmosphere of anxiety that has developed a taste for the catastrophic. Lewis’s short-selling characters resonate because they’re acting out our common sense of “the probability of extreme change” in financial markets and in real life. It’s an anxiety that envelops Tea Baggers and Greenpeaceniks in the same cloud of anger.

ML: The broader thing about all these characters to me is that their attitudes, their approach to life, their ability to hear the data, was something that was marginalized in the system itself. They didn’t belong, none of them belonged, and they should have belonged. What is it about the system that doesn’t want them as a part of it? And it’s terrifying when all the people who were wrong are in charge, and all the people who are right are on the outside.

CL: It sure is. To me there’s a direct analogy to be drawn with the war in Iraq. The Congress signed off “oh well, he must know something.” Tony Blair embraced it. The media by and large encouraged it. A very, very few people said “are you kidding?” And yet the ones that warned against the war in Iraq got the same prize that your guys got for warning of the meltdown.

ML: Yes. Ostracism.

CL: Exactly, and they’re still ostracized.

ML: It’s funny. There is an analogy. And the analogy is there’s a kind of a blind faith in leadership that is the result in both cases of ordinary people feeling they can’t evaluate the situation because it’s too complicated. The financial system got so complicated, and the complexity became opacity. When Alan Greenspan stands up and says something, no one understands what he’s saying. But they think that’s a good thing, because it’s all so complicated they shouldn’t understand what he’s saying. And the fact is they should. The fact is, if things aren’t being explained in a way you and I can understand them, it should be a bad sign, not a good sign. But the complexity was turned on its head. It was used as a way to mask bad things that were happening.

There’s a joke in it all. The joke is that the financial system, and there are analogies to the political system, but the financial system wanted to do something it really shouldn’t do. It wanted to make lots of loans that it shouldn’t make. They created all this risk that was going to blow up the system. In order to do that they needed to disguise the risk. So to disguise the risk it used all this complexity, which served as a smokescreen. And the joke is that it ended up disguising the risk from itself. That the very people who created the smokescreen were engulfed in it, and they couldn’t parse the system they created.

Michael Lewis with Chris Lydon in Boston, April 7, 2010.

Galinhas enxergam as cores bem melhor do que os humanos (Folha de S.Paulo)

RICARDO MIOTO

EDITOR DE “CIÊNCIA” E “SAÚDE”

30/03/2015  02h00

Galinhas são animais de visão, diz a ciência. Perto delas, somos uns daltônicos.

Cientistas descobriram que suas retinas têm cinco cones sensíveis à cor. Humanos têm só três, que enxergam comprimentos de vermelho, azul e verde –o resto é mistura. Galinhas nos superam com um cone para violeta e alguns comprimentos ultravioleta e com um quinto receptor, ainda pouco compreendido.

Tatiane Rosa/Folhapress
Galinha da Faculdade de Medicina Veterinária e Zootecnia da USP, no campus de Pirassununga

Além disso, no ano passado cientistas de Princeton (EUA) mostraram que os átomos do olho da galinha se organizam num estado da matéria inédito na biologia, com propriedades tanto de cristal sólido quanto de líquido. Tal arranjo permite que cores sejam recebidas de forma muito nítida.

Foi assim que o olho da galinha foi parar na revista científica “Physical Review”, entre artigos sobre temas da física como dissipação de energia ou mecânica quântica.

Isso tudo faz com que seja difícil imaginarmos como uma galinha vê cores –só sabemos que é bem mais intenso e, digamos, psicodélico.

Por que a evolução deixou o olho da galinha assim? É uma boa pergunta. As respostas passam pela importância das cores para ela –pense, por exemplo, na plumagem colorida dos parceiros sexuais.

Coping with the anthropocene: How we became nature (Science Daily)

Date: March 17, 2015

Source: De Gruyter

Summary: Overpopulation, the greenhouse effect, warming temperatures and overall climate disruption are all well recognized as a major threat to the ecology and biodiversity of the Earth.  The issue of humankind’s negative impact on the environment, albeit hotly debated and continuously present in the public eye, still only leads to limited policy action.


Overpopulation, the greenhouse effect, warming temperatures and overall climate disruption are all well recognized as a major threat to the ecology and biodiversity of the Earth. The issue of mankind’s negative impact on the environment, albeit hotly debated and continuously present in the public eye, still only leads to limited policy action. Urgent action is required, insist Paul Cruzten and Stanislaw Waclawek, the authors of “Atmospheric Chemistry and Climate in the Anthropocene,” published in open access in the new Chemistry-Didactics-Ecology-Metrology.

In their sobering review, Crutzen, the 1995 Nobel Laureate in Chemistry, and Waclawek, outline the development of a new geological epoch — the Anthropocene, where human actions become a global geophysical force, surpassing that of nature itself.

Anthropocene, which relates to the present geological epoch, in which human actions determine the behavior of the planet Earth to a greater degree than other natural processes. The term, coined by American ecologist Eugene F. Stoermer and popularized by Crutzen, introduced the epoch succeeding the Holocene, which is the official term for the present epoch on Geological Time Scale, covering the last 11, 500 years.

Although Anthropocene is not a new concept, it is only now that the authors present stunning evidence in support of their claim. The article describes the negative impact of the human footprint, which ensues a gradual destruction of the Earth. Highlighting different data elements — it yields overwhelming evidence that “man, the eroder” now transforms the atmospheric, geologic, hydrologic, biospheric, and other earth system processes.

The list is long and unforgiving:

· Excessively rapid climate change, so that ecosystems cannot adapt

· The Arctic ocean ice cover is thinner by approximately 40% compared to 20-40 years ago

· Ice loss and the growing sea levels

· Overpopulation (fourfold increase in the 20th century alone)

· Increasing demand for freshwater

· Releases of NO into the atmosphere, resulting in high surface ozone layers

· Loss of agricultural soil through erosion

· Loss of phosphorus. Dangerous depletion in agricultural regions

· Melting supplies of phosphate reserves (leading to serious reduction in crop yield)

Describing the negative impact of human activities on the environment, the authors identify planetary boundaries, as means to attaining global sustainability. It is “a well-documented summary of all humankind actions affecting the environment on all scales. According to Crutzen, we live in a new era, Anthropocene, and our survival fully depends on us. I strongly recommend this unusual publication in the form of highly informative compressed slides and graphs.” says Marina Frontasyeva from the Joint Institute for Nuclear Research in Dubna, Russia. Nature is us, and responding to the Anthropocene means building a culture that grows with the Earth’s biological wealth instead of depleting it.


Journal Reference:

  1. Paul J. Crutzen, Stanisław Wacławek. Atmospheric Chemistry and Climate in the AnthropoceneChemistry-Didactics-Ecology-Metrology, 2015 DOI: 10.1515/cdem-2014-0001

Geoengineering proposal may backfire: Ocean pipes ‘not cool,’ would end up warming climate (Science Daily)

Date: March 19, 2015

Source: Carnegie Institution

Summary: There are a variety of proposals that involve using vertical ocean pipes to move seawater to the surface from the depths in order to reap different potential climate benefits. One idea involves using ocean pipes to facilitate direct physical cooling of the surface ocean by replacing warm surface ocean waters with colder, deeper waters. New research shows that these pipes could actually increase global warming quite drastically.


To combat global climate change caused by greenhouse gases, alternative energy sources and other types of environmental recourse actions are needed. There are a variety of proposals that involve using vertical ocean pipes to move seawater to the surface from the depths in order to reap different potential climate benefits.A new study from a group of Carnegie scientists determines that these types of pipes could actually increase global warming quite drastically. It is published in Environmental Research Letters.

One proposed strategy–called Ocean Thermal Energy Conversion, or OTEC–involves using the temperature difference between deeper and shallower water to power a heat engine and produce clean electricity. A second proposal is to move carbon from the upper ocean down into the deep, where it wouldn’t interact with the atmosphere. Another idea, and the focus of this particular study, proposes that ocean pipes could facilitate direct physical cooling of the surface ocean by replacing warm surface ocean waters with colder, deeper waters.

“Our prediction going into the study was that vertical ocean pipes would effectively cool the Earth and remain effective for many centuries,” said Ken Caldeira, one of the three co-authors.

The team, which also included lead author Lester Kwiatkowski as well as Katharine Ricke, configured a model to test this idea and what they found surprised them. The model mimicked the ocean-water movement of ocean pipes if they were applied globally reaching to a depth of about a kilometer (just over half a mile). The model simulated the motion created by an idealized version of ocean pipes, not specific pipes. As such the model does not include real spacing of pipes, nor does it calculate how much energy they would require.

Their simulations showed that while global temperatures could be cooled by ocean pipe systems in the short term, warming would actually start to increase just 50 years after the pipes go into use. Their model showed that vertical movement of ocean water resulted in a decrease of clouds over the ocean and a loss of sea-ice.

Colder air is denser than warm air. Because of this, the air over the ocean surface that has been cooled by water from the depths has a higher atmospheric pressure than the air over land. The cool air over the ocean sinks downward reducing cloud formation over the ocean. Since more of the planet is covered with water than land, this would result in less cloud cover overall, which means that more of the Sun’s rays are absorbed by Earth, rather than being reflected back into space by clouds.

Water mixing caused by ocean pipes would also bring sea ice into contact with warmer waters, resulting in melting. What’s more, this would further decrease the reflection of the Sun’s radiation, which bounces off ice as well as clouds.

After 60 years, the pipes would cause an increase in global temperature of up to 1.2 degrees Celsius (2.2degrees Fahrenheit). Over several centuries, the pipes put the Earth on a warming trend towards a temperature increase of 8.5 degrees Celsius (15.3 degrees Fahrenheit).

“I cannot envisage any scenario in which a large scale global implementation of ocean pipes would be advisable,” Kwiatkowski said. “In fact, our study shows it could exacerbate long-term warming and is therefore highly inadvisable at global scales.”

The authors do say, however, that ocean pipes might be useful on a small scale to help aerate ocean dead zones.


Journal Reference:

  1. Lester Kwiatkowski, Katharine L Ricke and Ken Caldeira. Atmospheric consequences of disruption of the ocean thermoclineEnvironmental Research Letters, 2015 DOI: 10.1088/1748-9326/10/3/034016

Welcome to Global Warming’s Terrifying New Era (Slate)

By Eric Holthaus

19 March 2015

466467728-in-this-handout-image-provided-by-unicef-the-storm

Storm damage in Port Vila, Vanuatu. Photo by UNICEF via Getty Images

On Wednesday, the National Oceanic and Atmospheric Administration announcedthat Earth’s global temperature for February was among the hottest ever measured. So far, 2015 is tracking above record-warm 2014—which, when combined with the newly resurgent El Niño, means we’re on pace for another hottest year in history.

In addition to the just-completed warmest winter on record globally (despite the brutal cold and record snow in the eastern U.S.), new data on Thursday from the National Snow and Ice Data Center show that this year’s peak Arctic sea ice reached its lowest ever maximum extent, thanks to “an unusual configuration of the jet stream” that greatly warmed the Pacific Ocean near Alaska.

But here’s the most upsetting news. It’s been exactly 30 years since the last time the world was briefly cooler than its 20th-century average. Every single month since February 1985 has been hotter than the long-term average—that’s 360 consecutive months.

More than just being a round number, the 30-year streak has deeper significance. In climatology, a continuous 30-year stretch of data is traditionally what’s used to define what’s “normal” for a given location. In a very real way, we can now say that for our given location—the planet Earth—global warming is now “normal.” Forget debating—our climate has officially changed.

This 30-year streak should change the way we think and talk about this issue. We’ve entered a new era in which global warming is a defining characteristic and a fundamental driver of what it means to be an inhabitant of planet Earth. We should treat it that way. For those who care about the climate, that may mean de-emphasizing statistics and science and beginning to talk more confidently about the moral implications of continuing on our current path.

Since disasters disproportionately impact the poor, climate change is increasingly an important economic and social justice issue. The pope will visit the United States later this year as part of a broader campaign by the Vatican to directly influence the outcome of this year’s global climate negotiations in Paris—recent polling data show his message may be resonating, especially with political conservatives and nonscience types. Two-thirds of Americans now believe that world leaders are morally obligated to take steps to reduce carbon.

Scientists and journalists have debated the connection between extreme weather and global warming for years, but what’s happening now is different. Since weather impacts virtually every facet of our lives (at least in a small way), and since climate change is affecting weather at every point in the globe every day (at least in a small way), that makes it at the same time incredibly difficult to study and incredibly important. Formal attribution studies that attempt to scientifically tease out whether global warming “caused” individual events are shortsighted and miss the point. It’s time for a change in tack. The better question to ask is: How do we as a civilization collectively tackle the weather extremes we already face?

In the aftermath of the nearly unprecedented power and destructive force of Cyclone Pam’s landfall in the remote Pacific island nation of Vanuatu—where survivors were forced to drink saltwater—emerges perhaps the best recent example I’ve seen of a government acknowledging this changed climate in a scientifically sound way:

Cyclone Pam is a consequence of climate change since all weather is affected by the planet’s now considerably warmer climate. The spate of extreme storms over the past decade—of which Pam is the latest—is entirely consistent in science with the hottest ever decade on record.

The statement was from the government of the Philippines, the previous country to suffer a direct strike by a Category 5 cyclone—Haiyan in 2013. As chair of the Climate Vulnerable Forum negotiating bloc, the Philippines also called for a strengthening of ambition in the run-up to this year’s global climate agreement in Paris.

The cost of disasters of all types is rising around the globe as population and wealth increase and storms become more fierce. This week in Japan, 187 countries agreed on a comprehensive plan to reduce loss of life from disasters as well as their financial impact. However, the disaster deal is nonbinding and won’t provide support to the most vulnerable countries.

Combining weather statistics and photos of devastated tropical islands with discussions of political and economic winners and losers is increasingly necessary as climate change enters a new era. We’re no longer describing the problem. We’re telling the story of how humanity reacts to this new normal.

As the Guardian’s Alan Rusbridger, in an editorial kickoff of his newspaper’s newly heightened focus on climate, said, “the mainstream argument has moved on.” What’s coming next isn’t certain, but it’s likely to be much more visceral and real than steadily upward sloping lines on a graph.

A Major Surge in Atmospheric Warming Is Probably Coming in the Next Five Years (Motherboard)

Written by NAFEEZ AHMED

March 2, 2015 // 08:25 PM CET

Forget the so-called ‘pause’ in global warming—new research says we might be in for an era of deeply accelerated heating.

While the rate of atmospheric warming in recent years has, indeed, slowed due to various natural weather cycles—hence the skeptics’ droning on about “pauses”—global warming, as a whole, has not stopped. Far from it. It’s actually sped up, dramatically, as excess heat has absorbed into the oceans. We’ve only begun to realize the extent of this phenomenon in recent years, after scientists developed new technologies capable of measuring ocean temperatures with a depth and precision that was previously lacking.

In 2011, a paper in Geophysical Research Letters tallied up the total warming data from land, air, ice, and the oceans. In 2012, the lead author of that study, oceanographer John Church, updated his research. What Church found was shocking: in recent decades, climate change has been adding on average around 125 trillion Joules of heat energy to the oceans per second.

How to convey this extraordinary fact? His team came up with an analogy: it was roughly the same amount of energy that would be released by the detonation of two atomic bombs the size dropped on Hiroshima. In other words, these scientists found that anthropogenic climate is warming the oceans at a rate equivalent to around two Hiroshima bombs per second. But as new data came in, the situation has looked worse: over the last 17 years, the rate of warming has doubled to about four bombs per second. In 2013, the rate of warming tripled to become equivalent to 12 Hiroshima bombs every second.

So not only is warming intensifying, it is also accelerating. By burning fossil fuels, humans are effectively detonating 378 million atomic bombs in the oceans each year—this, along with the ocean’s over-absorption of carbon dioxide, has fuelled ocean acidification, and now threatens the entire marine food chain as well as animals who feed on marine species. Like, er, many humans.

According to a new paper from a crack team of climate scientists, a key reason that the oceans are absorbing all this heat in recent decades so well (thus masking the extent of global warming by allowing atmospheric average temperatures to heat more slowly), is due to the Pacific Decadal Oscillation (PDO), an El Nino-like weather pattern that can last anywhere between 15-30 years.

In its previous positive phase, which ran from around 1977 to 1998, the PDO meant the oceans would absorb less heat, thus operating as an accelerator on atmospheric temperatures. Since 1998, the PDO has been in a largely negative phase, during which the oceans absorb more heat from the atmosphere.

Such decadal ocean cycles have broken down recently, and become more sporadic. The last, mostly negative phase, was punctuated by a brief positive phase that lasted 3 years between 2002 and 2005. The authors of the new study, Penn State climatologist Michael Mann, University of Minnesota geologist Byron Steinman, and Penn State meteorologist Sonya Miller, point out that the PDO, as well as the Atlantic Multidecadal Oscillation (AMO), have thus played a major role in temporarily dampening atmospheric warming.

“In other words, the ‘slowdown’ is fleeting and will likely soon disappear.”

So what has happened? During this period, Mann and his team show, there has been increased “heat burial” in the Pacific ocean, that is, a greater absorption of all that heat equivalent to hundreds of millions of Hiroshimas. For some, this has created the false impression, solely from looking at global average surface air temperatures, of a ‘pause’ in warming. But as Mann said, the combination of the AMO and PDO “likely offset anthropogenic warming over the past decade.”

Therefore, the “pause” doesn’t really exist, and instead is an artifact of the limitations of our different measuring instruments.

“The ‘false pause’ is explained in part by cooling in the Pacific ocean over the past one-to-two decades,” Mann told me, “but that is likely to reverse soon: in other words, the ‘slowdown’ is fleeting and will likely soon disappear.”

The disappearance of the ‘slowdown’ will, in tangible terms, mean that the oceans will absorb less atmospheric heat. While all the accumulated ocean heat “is certainly not going to pop back out,” NASA’s chief climate scientist Dr. Gavin Schmidt told me, it is likely to mean that less atmospheric heat will end up being absorbed. “Ocean cycles can modulate the uptake of anthropogenic heat, as some have speculated for the last decade or so, but… net flux is still going to be going into the ocean.”

According to Mann and his team, at some point, this will manifest as an acceleration in the rise of global average surface air temperatures. In their Science study, they observe: “Given the pattern of past historical variation, this trend will likely reverse with internal variability, instead adding to anthropogenic warming in the coming decades.”

So at some point in the near future, the PDO will switch from its current negative phase back to positive, reducing the capacity of the oceans to accumulate heat from the atmosphere. That positive phase of the PDO will therefore see a rapid rise in global surface air temperatures, as the oceans’ capacity to absorb all those Hiroshima bomb equivalents declines—and leaves it to accumulate in our skies. In other words, after years of slower-than-expected warming, we may suddenly feel the heat.

So when will that happen? No one knows for sure, but at the end of last year, signs emerged that the phase shift to a positive PDO could be happening right now.

In the five months before November 2014, measures of surface temperature differences in the Pacific shifted to positive, according to the National Oceanic and Atmospheric Administration. This is the longest such positive shift detected in about 12 years. Although too soon to determine for sure whether this is, indeed, the beginning of the PDO’s switch to a new positive phase, this interpretation is consistent with current temperature variations, which during a positive PDO phase should be relatively warm in the tropical Pacific and relatively cool in regions north of about 20 degrees latitude.

In January 2015, further signs emerged that the PDO is right now in transition to a new warm phase. “Global warming is about the get a boost,” ventured meteorologist Eric Holthaus. Recent data including California’s intensifying drought and sightings of tropical fish off the Alaskan coast “are further evidence of unusual ocean warming,” suggesting that a PDO transition “may already be underway a new warm phase.”

While it’s still not clear whether the PDO is really shifting into a new phase just yet, when it does, it won’t be good. Scientists from the UK Met Office’s Hadley Center led by Dr. Chris Roberts of the Oceans and Cryosphere Group estimate in a new paper in Nature that there is an 85 percent chance the faux ‘pause’ will end in the next five years, followed by a burst of warming likely to consist of a decade or so of warm ocean oscillations.

Roberts and his team found that a “slow down” period is usually (60 percent of the time) followed by rapid warming at twice the background rate for at least five years, and potentially longer. And mostly, this warming would be concentrated in the Arctic, a region where temperatures are already higher than the global average, and which is widely recognized to be a barometer of the health of the global climate due to how Arctic changes dramatically alter trends elsewhere. Recent extreme weather events around the world have been attributed to the melting Arctic ice sheets and the impact on ocean circulations and jet streams.

What this means, if the UK Met Office is right, is that we probably have five years (likely less) before we witness a supercharged surge of rapid global warming that could last a decade, further destabilizing the climate system in deeply unpredictable ways.

California’s terrifying climate forecast: It could face droughts nearly every year (Washington Post)

March 2 2015

Not long ago, scientists at NASA and two major universities warned of an inevitable “megadrought” that will parch the southwestern United States for 35 years, starting around 2050. By then, a new study says, Californians should be fairly accustomed to long, harsh and dry conditions.

Over the past 15 years, temperatures have been rising in the Golden State, resulting in annual periods of extreme and blazing heat, while the cycle of low and moderate precipitation cycles have not changed since 1977. That means that it’s far more likely that extreme heat years will coincide with dry years.

[NASA: A ‘megadrought’ will grip U.S. in the coming decades]

That’s a recipe for drought, the authors said. Mix searing heat with little to no rain and snow, then bake.

Unlike other climate studies that sound an alarm for impact far into the future, the Stanford University study led by associate professor Noah Diffenbaugh pored through historical data from the U.S. National Climatic Data Center to explain current conditionsand concluded that California should get used to it. It was published Monday afternoon in the journal of the Proceedings of the National Academy of Sciences.

Diffenbaugh and two graduate students at Stanford’s School of Earth, Energy an Environmental Sciences explored the role temperature has played in California’s drought for 120 years. Between 1896 and 1994, climate patterns in the state created a 50 percent chance that a year of extremely warm temperatures would merge with a year of moderately dry conditions. But between 1995 and 2014, extreme temperature years were so common that their chance of combining with dry years increased to 80 percent.

The forecast is negative, but not necessarily the outlook, the authors said. California has opportunities to manage its risks with smart water policies that use precipitation to bank ground water so that farms, which use 77 percent of the state’s water, can survive. The statewide water use is similar to what it was 40 years ago, meaning that even though the population has exploded to 33 million, Californians share about as much water now as they did in the 1970s.

State officials can learn from advanced water management practices already in use in the Middle East in nations such as Saudi Arabia and Israel.

“California was already on the cusp, where 100 percent of the years are not only warm but severely warm,” said Diffenbaugh, a senior fellow at Stanford’s university’s Woods Institute for the Environment. “When a low precipitation year occurs with warm conditions, it’s twice as likely to result in drought.”

[Tropical forests may be vanishing even faster than previously thought]

As part of the study, the researchers also observed the impact of greenhouse gases from human activity — carbon dioxide, nitrous oxide and methane from power plants, vehicles, factories and other sources — on temperature and precipitation, Diffenbaugh said. Graduate students Daniel Swain and Danielle Touma were co-authors for the study.

“A lot of this paper is about greenhouse gas emissions that have already happened,” Diffenbaugh said. “Really what California is experiencing is the cumulative emissions of greenhouse gases globally. And the United States has been responsible for a large fraction. Historically the United States has been responsible for a quarter of the emissions and the European Union another quarter.”

Even if world governments that are sharply divided over the approach to lowering greenhouse gas emissions somehow managed to reach a consensus, California will still feel the heat well into the future, Diffenbaugh said.

[How dust leaves the Sahara and floats to Amazon forest]

California, the nation’s most populous state, is suffering one of its worst droughts ever, fueled by the exact conditions cited  in the study — record-low precipitation and record-high heat. The lowest calendar year of precipitation on record in the state happened between 2013 and 2014, and 2014 was the hottest year in California history.

Earlier scientific research suggests that the extremely dry and hot period between 2012 and 2014 might be the worst in a millennium, the study said. But even that can’t hold a candle to the droughts expected 35 years from now. Scientists at NASA and at Cornell and Columbia universities said climate models used for a study released two weeks ago show 80 percent chance of an extended drought between 2050 and 2099, lasting more than three decades if world governments fail to act aggressively to mitigate the effects of climate change.
North America has experienced so-called megadroughts before, during the 12th and 13th centuries. But those were caused by natural changes in weather patterns that give megadroughts a 10 percent chance of forming at any time. The harsh future drought will be the result of human-caused warming.

An international panel of leading climate scientists said in 2013 that the planet is warming at an accelerated pace and found with 95 percent certainty that human activity is the cause. The past three decades have been the hottest on the planet since 1850. Carbon concentrations in the atmosphere have increased 40 percent since then, and carbon, methane and nitrous oxide are at levels unprecedented in at least 800,000 years.

“With climate change, the likelihood of a megadrought goes up considerably,” said Toby R. Ault, an assistant professor in the department of Earth and atmospheric sciences at Cornell, one of the co-authors. Benjamin I. Cook of NASA’s Goddard Institute for Space Studies and Jason E. Smerdon of  Columbia’s Lamont-Doherty Earth Observatory were the other authors for that study.

After 2050, there is “overwhelming evidence of a dry shift,” Ault said, “way drier than the megadroughts of the 1100s and 1200s.” The cause, Smerdon continued, “is twofold, reductions in rainfall and snowfall. Not just rainfall but soil moisture … and changes in evaporation that dry out the soil much more than normal.”

Leading to the theorized megadrought, California is likely to experience a series of micro droughts, researchers say.

[West’s historic drought stokes fears of water crisis]

A third study published three years ago had similar findings. The research is newly published, but its findings are not dramatically different from similar studies in the past. Beverly Law, a specialist in global change biology at Oregon State University’s College of Forestry, co-authored a study of megadroughts three years ago.
It showed that a drought that affected the American West from 2000 to 2004 compared to conditions seen during the medieval megadroughts. But the predicted megadrought this century would be far worse. Law said the NASA study confirmed her previous findings.

“We took the climate model . . . and compared” two periods, 2050 to 2099 and 1950 to 1999, she said. “What it showed is this big, red blotch over Southern California.”