Prevenção a desastres I
Se está evidente que podemos ter novos eventos extremos, o que está sendo feito para capacitar a Defesa Civil e as comunidades vulneráveis?
16 de agosto de 2024
De 6 a 8 de agosto, aconteceram três lives muito esclarecedoras sobre o que está por trás do antes e depois dos desastres que fomos submetidos no Rio Grande do Sul. Como ainda estamos vivendo o rescaldo de tanta destruição, creio ser muito útil este texto e outros que seguirão nas próximas semanas. Espero que sirva para compreendermos melhor o que estamos atravessando. Se você já se deu conta que precisa acompanhar o que está acontecendo nessa fase de agravamento do aquecimento global, pois isso afeta diretamente o seu cotidiano, inclusive seus planos, o que vou trazer nas próximas linhas será esclarecedor.
Um grupo de jornalistas mulheres, que compõe o Grupo de Trabalho de Comunicação da Rede de Emergência Climática e Ambiental (Reca), organizou em parceria da Federação Nacional de Jornalista (Fenaj) três lives intituladas “Diálogos entre jornalistas e especialistas acerca do desastre”. Dá para acompanhar a gravação no YouTube da Fenaj.
Esses encontros trouxeram muitas coisas que a mídia convencional e as redes sociais não abordaram.
Já parou para pensar o que o jornalismo faz com a ocorrência de desastres e o que os desastres fazem com o jornalismo? Essa foi a indagação da professora Marcia Franz Amaral, da UFSM, na abertura do encontro. Diante do que passamos, com tanta falta de orientação sobre o que fazer, tanto desespero, como deve ser a comunicação com população, com os atingidos, com a imprensa das autoridades e dos detentores de informações técnicas?
Tenho feito a cobertura de desastres, fui diretamente afetada por essa última enchente e venho trabalhando em projetos para despertar o interesse de diferentes públicos sobre as mudanças climáticas. Esse contexto complexo me fez voltar à universidade. Estou fazendo mestrado em comunicação, justamente para pesquisar, desvelar contextos e com aspiração de contribuir para que saibamos encarar com mais assertividade esse momento que exige adaptação e mitigação às mudanças climáticas.
Fui uma das painelistas da primeira live. Foi um mega desafio, pois estava quase sem voz. Peguei uma virose, uma pereba que tem deixado muita gente doente em Porto Alegre e Região Metropolitana. Escrevo isso só para explicar o meu desempenho, se você for me ouvir na live. Eu avalio que também é uma consequência da remexida geral da cidade, na qual o ambiente foi submetido.
E sabem por que fui uma das convidadas a falar? Porque fiz reportagens mostrando contextos em que outros colegas jornalistas não se debruçaram. Fiquei muito tocada com a declaração do Roberto Villar Belmonte, professor da Uniritter, que escreveu em um grupo sobre minha atuação.
“Depois da enchente de 2023, apenas a repórter freelancer Sílvia Marcuzzo fez reportagens de fôlego apontando a falta de governança ambiental (proposital) no RS. A imprensa regional dita hegemônica continua fingindo que o tema não existe, mesmo após maio de 2024. Seria legal citar isso na tua fala, Sílvia, na tua abordagem contínua da pauta, não apenas durante a desgraça (quando a morte é o principal valor notícia)”.
Ele escreveu isso também para justificar a minha participação na programação do 8º Congresso Brasileiro de Jornalismo Ambiental, que esse ano será em Fortaleza. Confere a programação do CBJA, será híbrida, online e presencial.
A primeira live, realizada em 6 de agosto, trouxe a chamada: os alertas foram emitidos. E agora?
Reinaldo Estelles, coordenador-geral do Departamento de Articulação e Gestão, da Secretaria Nacional de Proteção e Defesa Civil do Ministério da Integração e Desenvolvimento Regional, foi categórico: “Não adianta emitir alarmes se a população não souber o que é para fazer”. Esse é um dos pontos nevrálgicos, não basta uma sirene tocar, os bombeiros chamarem. A população precisa compreender o que significa estar em perigo. Creio que quem teve a experiência dos episódios dos meses de maio e junho no Rio Grande do Sul sabe muito bem o que isso quer dizer. Fomos vítimas de uma sequência de trapalhadas, de falta de gestão dos poderes públicos municipais e estadual.
Há muitas dimensões diferentes de informação, que estão intimamente ligadas a vários fatores. Ou seja, mais uma vez ficou supernítido o quanto o Estado que se gaba de “ter façanhas que sirvam de modelo a toda terra” se equivocou em insistir em determinados erros. Há muitas questões por trás das medidas dos tomadores de decisão que precisam ser esclarecidas.
Na live, Estelles anunciou o lançamento do projeto-piloto de um novo sistema de alerta, que aciona todos os celulares de uma região em risco. E reforçou: as Defesas Civis dos municípios e do Estado precisam se capacitar. Outros desastres virão. Ele salientou o quanto as Defesas Civis precisam promover a criação e a mobilização de núcleos comunitários. A participação de vários segmentos, principalmente com a atuação de lideranças locais, são essenciais para a estruturação de planos de contingência. Por favor, se você que me lê souber de algum lugar no Rio Grande do Sul onde isso esteja acontecendo, me conte.
Vagner Anabor, professor de Meteorologia da UFSM, lembrou que o Estado está em uma das regiões de maior incidência de tempestades severas. E na sua opinião, o que vivemos esse ano foi o maior desastre já ocorrido no Brasil. Outra curiosidade apontada por ele é que uns 25% da força de trabalho da Metereologia do País é composta por profissionais formados no RS. Ou seja, o Estado exporta gente qualificada, mas não dispõe de servidores que atuem no próprio território onde nasceram.
Ele defende o fortalecimento de medidas de prevenção. E lamenta que o Climatempo, do governo do Estado, conte apenas com dois metereologistas e um engenheiro hidrólogo. Anabor estima que seria necessária uma equipe entre 20 e 25 pessoas para dar conta de uma área do tamanho do RS.
Outro ponto importante colocado por Anabor é que “a cadeia da informação é muito longa”. E, por questão de minutos, muitas vidas podem ser salvas. Isso quer dizer que, desde o momento em que se sabe o que vem pela frente, até informar e mobilizar diferentes equipes, transmitir alerta e comunicar às comunidades sobre os riscos que eles correm, há muitas etapas a serem cumpridas até o momento de chegar em regiões que serão atingidas. Há diferentes atores envolvidos.
No caso do RS e de Porto Alegre, então, ocorreram muitas situações que deixaram evidente o quanto isso foi prejudicial. E a preparação para lidar com situações de perigo iminente requer planejamento e a execução de um bom plano de contingência (o que também não tivemos por aqui).
Os painelistas salientaram o quanto a imprensa desempenha função crucial para ampliar a percepção de risco da população. Quem cobre precisa saber o que significa uma chuva de 100 milímetros. E para complicar ainda mais o contexto, tem proliferado o número de influencers, gente que só porque sabe falar diante da câmera fica espalhando informações que muitas vezes mais atrapalham do que ajudam. Isso sem falar nas fake news.
Resumindo: enquanto as respectivas autoridades não adotarem condutas responsivas, que assumam o processo de uma comunicação para o bem comum, para salvar vidas, para evitar o pior, teremos que conviver com a insegurança, de procurar entender o que fazer diante de uma situação de risco.
O repórter Luciano Velleda, do Sul21, destacou que diversas vezes a imprensa precisou esperar anúncios da Defesa Civil porque seriam dados pelo governador e pelo prefeito de Porto Alegre em coletivas. Ou seja, assim que chega até a autoridade uma determinada informação, ela é avaliada se é o governador ou o prefeito que serão os porta-vozes. Vale lembrar da vez em que o prefeito sugeriu que os porto-alegrenses deixassem a cidade, fossem para a praia.
Em outros países, onde a comunicação de risco faz parte da cultura e funciona, como o Japão, a cadeia (o caminho que a informação percorre) é curta. Todos são treinados para saber o que fazer em caso de perigo. A autoridade máxima é técnica. Uma série de medidas, como a emissão de alerta em todos os canais de rádio e televisão, são acionadas em caso de risco.
Na próxima semana, trarei mais sobre esse assunto. Porque já está na cara que precisamos avançar nas medidas de prevenção a desastres. Esse assunto não pode e não deve ficar restrito a decisões políticas. A sociedade precisa se apropriar das diversas camadas de conhecimento para evitar danos de toda ordem. Ainda mais em ano de eleição!
Com a palavra, os professores das escolas atingidas pelas enchentes.
Para encerrar, sugiro que vejam a live Inundações no RS e a situação das escolas na RME/POA, realizada no dia 12, onde professores da rede municipal de ensino da Capital contam o que passaram e o que está sendo feito nas escolas atingidas pela enchente. A iniciativa é do projeto de extensão Fazeres Pedagógicos da Faculdade de Educação da UFRGS.
Foto da Capa: Freepik / Gerada por IA
Mais textos de Sílvia Marcuzzo: Clique aqui.
Por Sílvia Marcuzzo – Jornalista e artivista
Sílvia Marcuzzo é jornalista, artivista, mestranda na Famecos/PUCRS e integrante do Grupo de Pesquisa sobre Comunicação, Crise e Cuidado. Articuladora de coletivos, repórter freelancer e editora de publicações socioambientais. Trabalha com comunicação e meio ambiente desde 1993. É consultora e assessora de organizações que atuam pelo bem da coletividade, por um mundo mais sustentável e com qualidade de vida para todos. Saiba mais em silviamarcuzzo.com.br
Prevenção a desastres II
Jornalistas têm muita a dificuldade no acesso às fontes oficiais, o que dificulta muito a imprensa de cumprir o seu papel em momentos de desastre
23 de agosto de 2024
Seguindo a sequência que comecei a semana passada (clique aqui para ler), hoje abordo o que rolou na live “Diálogos entre jornalistas e especialistas acerca do desastre”, realizada dia 7 de agosto, que pode ser acessada no YouTube da Federação Nacional dos Jornalistas (Fenaj). É o segundo dos três encontros promovidos pelo Grupo de Trabalho de Comunicação da Rede de Emergência Climática e Ambiental (Reca).
Com o tema “O desastre eclodiu. Quais são os protocolos?” Com essa pergunta, a mediadora Débora Gallas, do Grupo de Pesquisa de Jornalismo Ambiental e RECA, conduziu o encontro online que teve a participação de Irineu de Brito Junior, especialista em gestão de desastres da Unesp, Armin Braun, diretor do Centro Nacional de Gerenciamento de Riscos e Desastres (Cenad), e dos jornalistas Maria Teresa Cruz e Paulo Mueller.
Um dos pontos que foi unanimidade entre os debatedores foi a necessidade de se cumprir protocolos. O grande X da questão é que, por aqui, pelos pagos, pela Capital gaúcha, o protocolo é algo nebuloso. Digamos que o protocolo aqui durante a enchente era a Defesa Civil avisar pelos seus canais, incluindo o grupo de WhatsApp, o Instagram e o site oficial, que uma tempestade intensa estava vindo. O governador e o prefeito eram os porta-vozes das informações importantes também.
Armin Braun ressaltou a importância dos jornalistas de veículos para dar a noção sobre a percepção da previsão do tempo. Ele explicou que o Cenad trabalha na preparação e na resposta aos desastres. O foco é justamente articular e capacitar os estados e municípios para encarar os riscos hidrológicos, geológicos, meteorológicos. Há vários órgãos públicos envolvidos nessa rede.
Já o professor Irineu destacou o quanto precisa ser feito um planejamento prévio para que se tenha condições de gerenciar o problema provocado por um desastre. Ele citou variáveis que envolvem a logística para o atendimento às demandas. Tudo isso precisa ser pensado em tempo de calma, antes de uma temporada de tempestades, por exemplo.
E a resposta a situações de calamidade não são apenas com relação a intempéries climáticas. Ele lembrou-se do caso do grande número de venezuelanos entrando em Roraima, que também exigiu uma mobilização do governo. Ou seja, a Defesa Civil dos Estados e municípios precisa estar estruturada, com ações já ensaiadas antes de haver um incidente. Para você que me lê, isso parece óbvio. Mas o que vivemos nesse ano no Rio Grande do Sul demonstrou que pouco ou muito pouco de planos de antecipação, ou de contingência, foi colocado em prática.
Vale lembrar que, só em 2023, ocorreram mortes provocadas por enchentes e enxurradas em março, junho, julho, setembro, novembro e dezembro. Ou seja, já tínhamos tido 81 mortes em distintas regiões do Estado. Esses dados eu mesma levantei junto à Defesa Civil. Mas isso não bastou para que os órgãos competentes tomassem as medidas de precaução em 2024.
O jornalista e radialista Paulo Mueller, que acompanhou vários episódios de acidentes de todo tipo em Santa Catarina, tocou numa situação que todo mundo que cobre esse tipo de pauta enfrenta: a dificuldade de se ter acesso às fontes oficiais. É muito comum os jornalistas pedirem informações para a assessoria de imprensa do governo ou da Defesa Civil, mas se tiver a resposta, a prioridade é o atendimento ao chamado, não a imprensa.
Mueller contou o quanto a Defesa Civil de Santa Catarina se capacitou, se estruturou ao longo do tempo, depois de tantos episódios de enchente. Em Blumenau, por exemplo, todos os moradores já sabem se a sua rua vai alagar. O Estado vizinho também utiliza as escolas para trabalhar a cultura da prevenção. Lá também há muitos problemas devido à ocupação desordenada no solo.
E aí, pergunto: por que ainda não se estruturou programas de educação e comunicação que atendam às necessidades das comunidades e da imprensa? Será que os governos estão se dando conta que se houvesse um sistema eficiente que explicasse o risco, nesse momento de crise climática, as mortes e perdas incalculáveis seriam evitadas? Isso é ou não é negacionismo?
Essas lives são muito esclarecedoras para termos noção do quanto esse assunto precisa ser compreendido por todos. Pois somos todos vulneráveis a novos possíveis episódios. Pior: situações terríveis de desgraça ainda são usadas politicamente para contar vantagem de que estão fazendo isso, aquilo, quando, na verdade, para evitar que o pior acontecesse, quase nada foi feito. Assim que um técnico fica sabendo o risco que determinada região, município corre, o tomador de decisão é informado. Só que o que sentimos na pele, aqui no RS, é que a decisão de informar e como informar é muito lenta ou considera primeiro o contexto político e não o socioambiental e econômico.
Em tempos de redes sociais e de “influencers” que se aproveitam de tragédias para ter mais visualizações, muita mentira, desinformação da pior espécie circulou. Então, é mais do que na hora dos governos estruturarem mecanismos de comunicação que traduzam e deixem claro o que deve ser feito em caso de risco. Será que não seria mais eficiente do que ter que desmentir as mentiras que espalham durante os desastres?
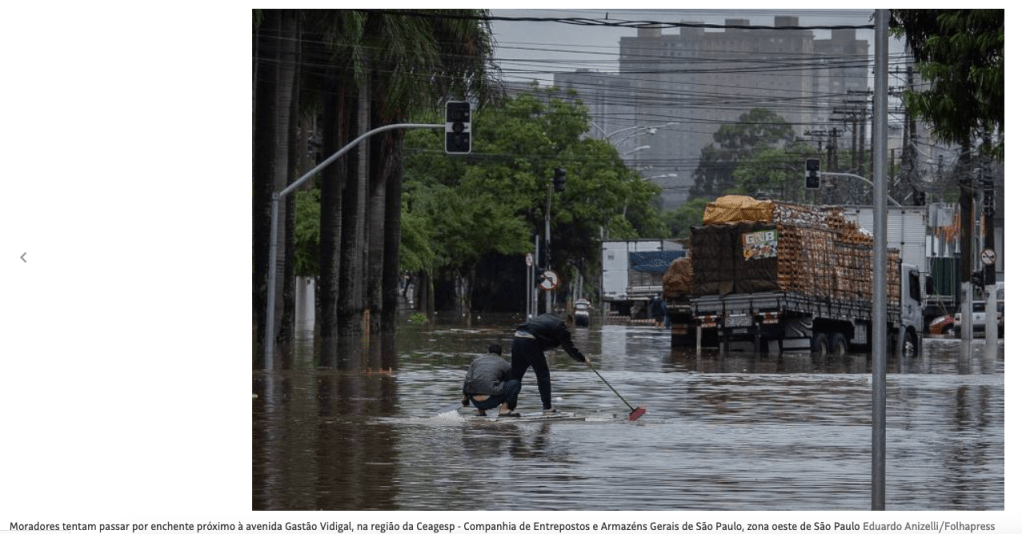
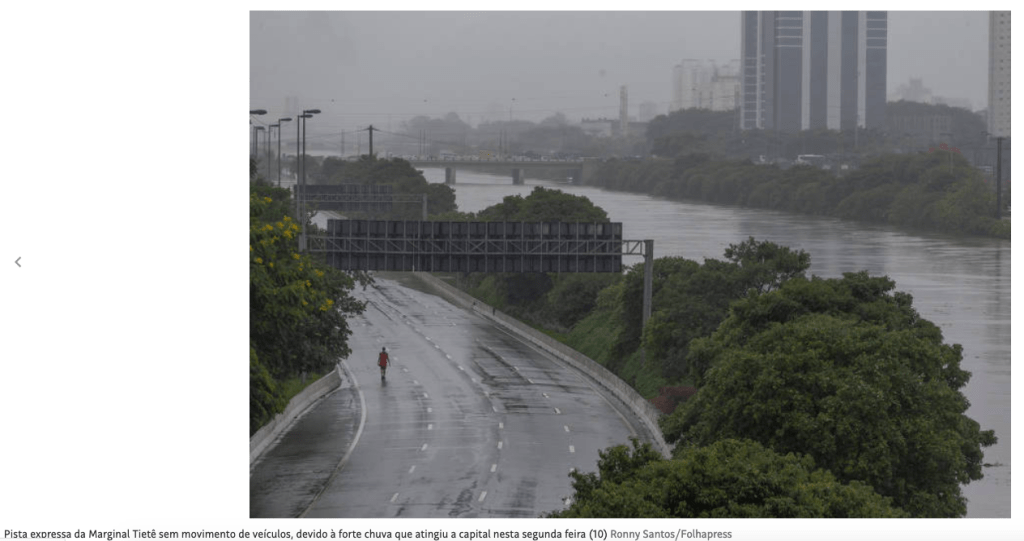
Segundo Maria Teresa, que acompanhou de perto o desastre de São Sebastião, no carnaval do ano passado, as autoridades de São Paulo sabiam que choveria muito acima da média naquele feriadão, mas não se empenharam em alertar sobre o risco que as pessoas correriam ao ir para o badalado litoral paulista. Ela disse ainda que o Instituto de Pesquisas Tecnológicas (IPT) já tinha feito um levantamento e mapeado 52 áreas de risco – mais da metade no lugar onde houve o deslizamento – em São Sebastião. Será que o governo não tomou as medidas de prevenção necessárias para salvar vidas?
A jornalista reforçou a necessidade de os profissionais de imprensa saberem se cuidar e obedecerem aos protocolos de seguranças. Ela atualmente atua em favelas no Rio e diz que as medidas são iguais à cobertura de um campo minado de guerra. Maria Teresa salientou a necessidade das redações, de quem atua direto nas coberturas, se capacitarem para enfrentar desafios extremos. Ficar sem conexão de celular, sem conseguir chegar aos locais e, ao mesmo tempo, ter empatia para saber se colocar no lugar do outro, são desafios complexos que precisam ser pensados muito antes de um desastre acontecer.
Você sabe doar direito?
A comunicação sobre o que doar e formas de como enviar também foram abordadas no encontro. Os participantes evidenciaram o quanto a população precisa ser solidária na hora de escolher e remeter as doações. Tem gente que mandou fantasia de carnaval, roupas íntimas – aliás, não se deve mandar esse tipo de vestimenta usada, só se for nova – pinguim de geladeira e até fita VHS de como fazer bijuterias para abrigos. Outra dica é que pares de sapatos devem estar amarrados juntos, pois também é fácil de se perder um pé do outro.
Situação das escolas

Marque na agenda, haverá outra live sobre a situação hoje das escolas atingidas pela enchente. Já foram realizados encontros online nos dias 22 de julho e 12 de agosto, com as escolas da Rede Municipal de Ensino de POA. A próxima será no dia 2 de setembro, às 19h30. Os professores estarão tratando das escolas públicas de Região Metropolitana. No YouTube do projeto Fazeres Pedagógicos, um projeto da Faculdade de Educação da UFRGS.
Foto da Capa: Freepik
Mais textos de Sílvia Marcuzzo: Clique Aqui.
Por Sílvia Marcuzzo – Jornalista e artivista
Sílvia Marcuzzo é jornalista, artivista, mestranda na Famecos/PUCRS e integrante do Grupo de Pesquisa sobre Comunicação, Crise e Cuidado. Articuladora de coletivos, repórter freelancer e editora de publicações socioambientais. Trabalha com comunicação e meio ambiente desde 1993. É consultora e assessora de organizações que atuam pelo bem da coletividade, por um mundo mais sustentável e com qualidade de vida para todos. Saiba mais em silviamarcuzzo.com.br


Você precisa fazer login para comentar.