Arquivo da tag: Satélites

How technology might finally start telling farmers things they didn’t already know (MIT Technology Review)

technologyreview.com

In the Salinas Valley, America’s “Salad Bowl,” startups selling machine learning and remote sensing are finding customers.

Rowan Moore Gerety – Dec. 18, 2020


As a machine operator for the robotics startup FarmWise, Diego Alcántar spends each day walking behind a hulking robot that resembles a driverless Zamboni, helping it learn to do the work of a 30-person weeding crew. 

On a Tuesday morning in September, I met Alcántar in a gigantic cauliflower field in the hills outside Santa Maria, at the southern end of the vast checkerboard of vegetable farms that line California’s central coast, running from Oxnard north to Salinas and Watsonville. Cooled by coastal mists rolling off the Pacific, the Salinas valley is sometimes called America’s Salad Bowl. Together with two adjacent counties to the south, the area around Salinas produces the vast majority of lettuce grown in the US during the summer months, along with most of the cauliflower, celery, and broccoli, and a good share of the berries. 

It was the kind of Goldilocks weather that the central coast is known for—warm but not hot, dry but not parched, with a gentle breeze gliding in from the coast. Nearby, a harvest crew in straw hats and long sleeves was making quick work of an inconceivable quantity of iceberg lettuce, stacking boxes 10 high on the backs of tractor-trailers lining a dirt road. 

In another three months, the same scene would unfold in the cauliflower field where Alcántar now stood, surrounded by tens of thousands of two- and three-leaf seedlings. First, though, it had to be weeded. 

The robot straddled a planted bed three rows wide with its wheels in adjacent furrows. Alcántar followed a few paces back, holding an iPad with touch-screen controls like a joystick’s. Under the hood, the robot’s cameras flashed constantly. Bursts of air, like the pistons in a whack-a-mole arcade game, guided sets of L-shaped blades in precise, short strokes between the cauliflower seedlings, scraping the soil to uproot tiny weeds and then parting every 12 inches so that only the cauliflower remained, unscathed.

Periodically, Alcántar stopped the machine and kneeled in the furrow, bending to examine a “kill”—spots where the robot’s array of cameras and blades had gone ever so slightly out of alignment and uprooted the seedling itself. Alcántar was averaging about an acre an hour, and only one kill out of every thousand plants. The kills often came in sets of twos and threes, marking spots where one wheel had crept out of the furrow and onto the bed itself, or where the blades had parted a fraction of a second too late.

Taking an iPhone out of his pocket, Alcántar pulled up a Slack channel called #field-de-bugging and sent a note to a colleague 150 miles away about five kills in a row, with a hypothesis about the cause (latency between camera and blade) and a time stamp so he could find the images and see what had gone wrong.

In this field, and many others like it, the ground had been prepared by a machine, the seedlings transplanted by a machine, and the pesticides and fertilizers applied by a machine. Irrigation crews still laid sprinkler pipe manually, and farmworkers would harvest this cauliflower crop when the time came, but it isn’t a stretch to think that one day, no person will ever lay a hand to the ground around these seedlings. 

Technology’s race to disrupt one of the planet’s oldest and largest occupations centers on the effort to imitate, and ultimately outdo, the extraordinary powers of two human body parts: the hand, able to use tweezers or hold a baby, catch or throw a football, cut lettuce or pluck a ripe strawberry with its calyx intact; and the eye, which is increasingly being challenged by a potent combination of cloud computing, digital imagery, and machine learning.

The term “ag tech” was coined at a conference in Salinas almost 15 years ago; boosters have been promising a surge of gadgets and software that would remake the farming industry for at least that long. And although ag tech startups have tended to have an easier time finding investors than customers, the boosters may finally be on to something. 

Ag tech boosters have been promising a surge of gadgets and software that would remake the farming industry for at least 15 years. They may finally be on to something. 

Silicon Valley is just over the hill from Salinas. But by the standards of the Grain Belt, the Salad Bowl is a relative backwater—worth about $10 billion a year, versus nearly $100 billion for commodity crops in the Midwest. Nobody trades lettuce futures like soybean futures; behemoths like Cargill and Conagra mostly stay away. But that’s why the “specialty crop” industry seemed to me like the best place to chart the evolution of precision farming: if tech’s tools can work along California’s central coast, on small plots with short growing cycles, then perhaps they really are ready to stage a broader takeover.

Alcántar, who is 28, was born in Mexico and came to the US as a five-year-old in 1997, walking across the Sonoran Desert into Arizona with his uncle and his younger sister. His parents, who are from the central Mexican state of Michoacán, were busily setting up the ingredients for a new life as farmworkers in Salinas, sleeping in a relative’s walk-in closet before renting a converted garage apartment. Alcántar spent the first year at home, watching TV and looking after his sister while his parents worked: there was a woman living in the main house who checked on them and kept them fed during the day, but no one who could drive them to elementary school.

workers harvest broccoli

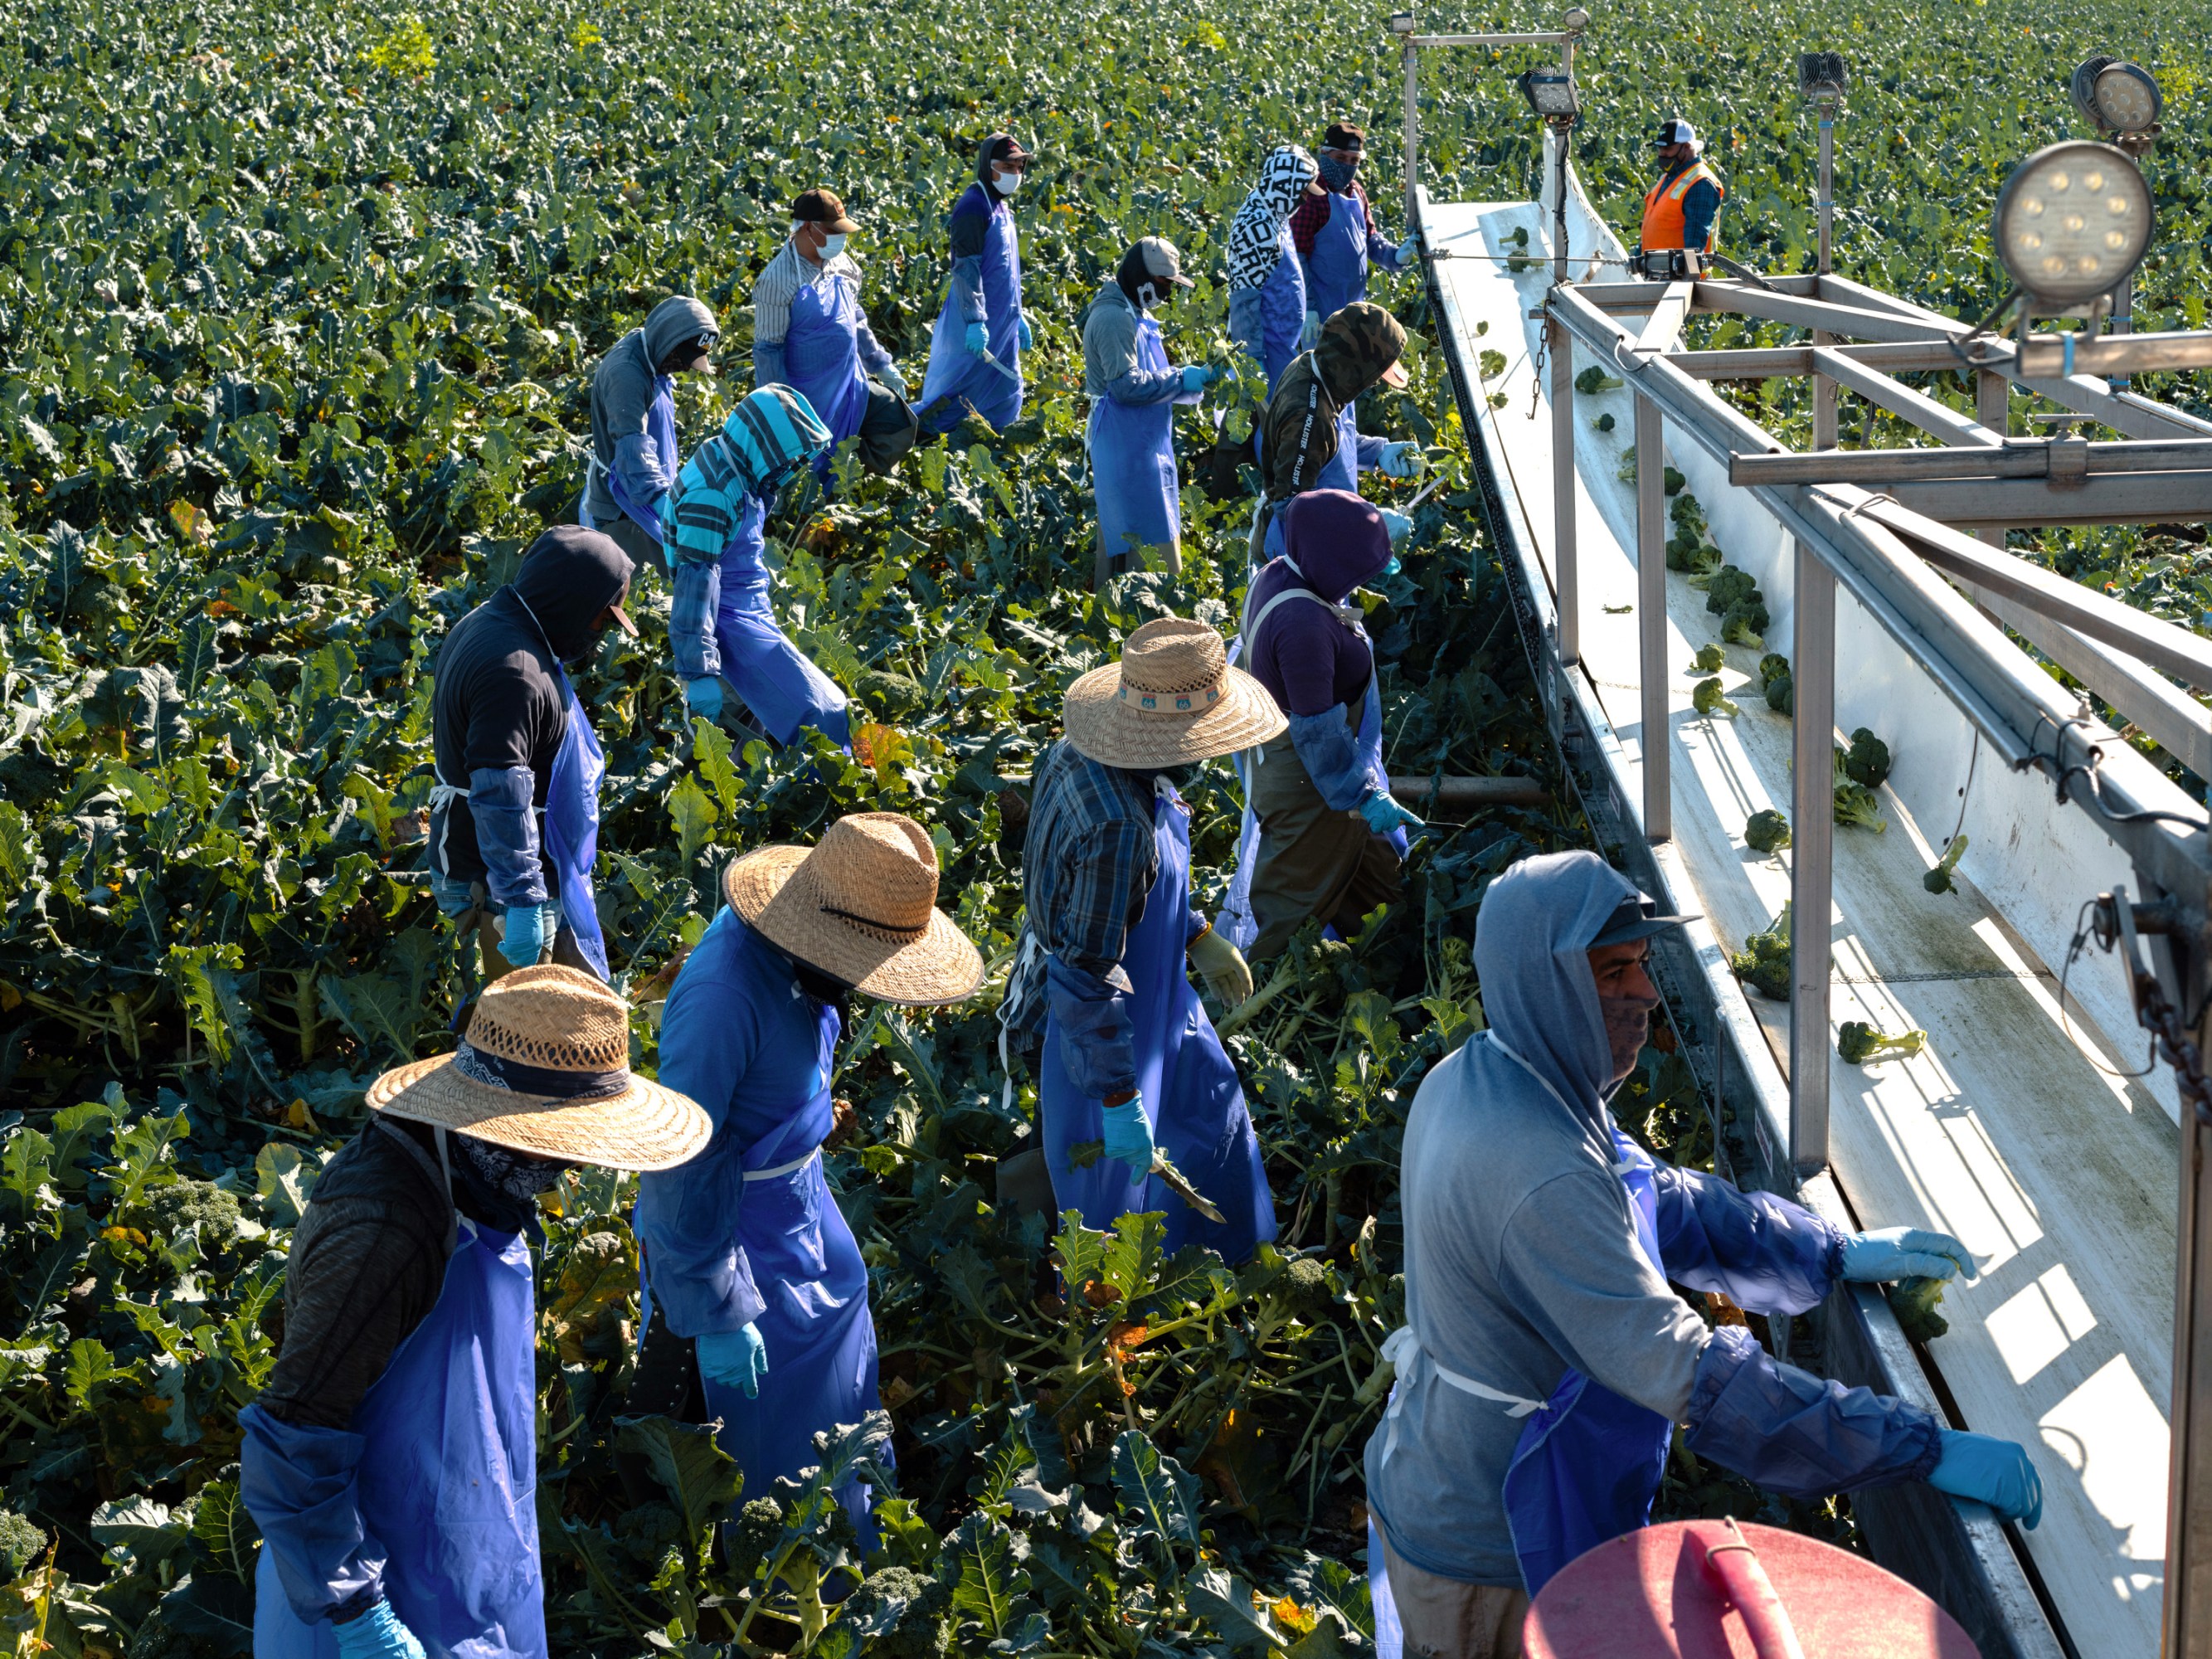
Workers harvest broccoli as part of a joint project between NASA and the University of California.

In high school, Alcántar often worked as a field hand on the farm where his father had become a foreman. He cut and weeded lettuce, stacked strawberry boxes after the harvest, drove a forklift in the warehouse. But when he turned 22 and saw friends he’d grown up with getting their first jobs after college, he decided he needed a plan to move on from manual labor. He got a commercial driver’s license and went to work for a robotics startup. 

During this first stint, Alcántar recalls, relatives sometimes chided him for helping to accelerate a machine takeover in the fields, where stooped, sweaty work had cleared a path for his family’s upward mobility. “You’re taking our jobs away!” they’d say. 

Five years later, Alcántar says, the conversation has shifted completely. Even FarmWise has struggled to find people willing to “walk behind the machine,” he says. “People would rather work at a fast food restaurant. In-N-Out is paying $17.50 an hour.”


II

Even up close, all kinds of things can foul the “vision” of the computers that power automated systems like the ones FarmWise uses. It’s hard for a computer to tell, for instance, whether a contiguous splotch of green lettuce leaves represents a single healthy seedling or a “double,” where two seeds germinated next to one another and will therefore stunt each other’s growth. Agricultural fields are bright, hot, and dusty: hardly ideal conditions for keeping computers running smoothly. A wheel gets stuck in the mud and temporarily upends the algorithm’s sense of distance: the left tires have now spun a quarter-­turn more than the right tires. 

Other ways of digital seeing have their own challenges. For satellites, there’s cloud cover to contend with; for drones and planes, wind and vibration from the engines that keep them aloft. For all three, image-recognition software must take into account the shifting appearance of the same fields at different times of day as the sun moves across the sky. And there’s always a trade-off between resolution and price. Farmers have to pay for drones, planes, or any field machinery. Satellite imagery, which has historically been produced, paid for, and shared freely by public space agencies, has been limited to infrequent images with coarse resolution.

NASA launched the first satellite for agricultural imagery, known as Landsat, in 1972. Clouds and slow download speeds conspired to limit coverage of most of the world’s farmland to a handful of images a year of any given site, with pixels from 30 to 120 meters per side.

A half-dozen more iterations of Landsat followed through the 1980s and ’90s, but it was only in 1999, with the Moderate Resolution Imaging Spectroradiometer, or MODIS, that a satellite could send farmers daily observations over most of the world’s land surface, albeit with a 250-meter pixel. As cameras and computing have improved side by side over the past 20 years, a parade of tech companies have become convinced there’s money to be made in providing insights derived from satellite and aircraft imagery, says Andy French, an expert in water conservation at the USDA’s Arid-Land Agricultural Research Center in Arizona. “They haven’t been successful,” he says. But as the frequency and resolution of satellite images both continue to increase, that could now change very quickly, he believes: “We’ve gone from Landsat going over our head every 16 days to having near-daily, one- to four-meter resolution.” 

“We’ve gone from Landsat going over our head every 16 days to having near-daily, one- to four-meter resolution.” 

Andy French

In 2014, Monsanto acquired a startup called the Climate Corporation, which billed itself as a “digital farming” company, for a billion dollars. “It was a bunch of Google guys who were experts in satellite imagery, saying ‘Can we make this useful to farmers?’” says Thad Simons, a longtime commodities executive who cofounded a venture capital firm called the Yield Lab. “That got everybody’s attention.” 

In the years since, Silicon Valley has sent forth a burst of venture-funded startups whose analytic and forecasting services rely on tools that can gather and process information autonomously or at a distance: not only imagery, but also things like soil sensors and moisture probes. “Once you see the conferences making more money than people actually doing work,” Simons says with a chuckle, “‘you know it’s a hot area.’’

A subset of these companies, like FarmWise, are working on something akin to hand-eye coordination, chasing the perennial goal of automating the most labor-intensive stages of fruit and vegetable farming—weeding and, above all, harvesting—against a backdrop of chronic farm labor shortages. But many others are focused exclusively on giving farmers better information. 

One way to understand farming is as a never­ending hedge against the uncertainties that affect the bottom line: weather, disease, the optimal dose and timing of fertilizer, pesticides, and irrigation, and huge fluctuations in price. Each one of these factors drives thousands of incremental decisions over the course of a season—decisions based on long years of trial and error, intuition, and hard-won expertise. So the tech question on farmers’ lips everywhere, as Andy French told me, is: “What are you telling us that we didn’t already know?”


III

Josh Ruiz, the vice president of ag operations for Church Brothers, which grows greens for the food service industry, manages more than a thousand separate blocks of farmland covering more than 20,000 acres. Affable, heavy-set, and easy to talk to, Ruiz is known across the industry as an early adopter who’s not afraid to experiment with new technology. Over the last few years, he has become a regular stop on the circuit that brings curious tech executives in Teslas down from San Francisco and Mountain View to stand in a lettuce field and ask questions about the farming business. “Trimble, Bosch, Amazon, Microsoft, Google—you name it, they’re all calling me,” Ruiz says. “You can get my attention real fast if you solve a problem for me, but what happens nine times out of 10 is the tech companies come to me and they solve a problem that wasn’t a problem.”

What everyone wants, in a word, is foresight. For more than a generation, the federal government has sheltered growers of corn, wheat, soybeans, and other commodities from the financial impact of pests and bad weather by offering subsidies to offset the cost of crop insurance and, in times of bountiful harvests, setting an artificial “floor” price at which the government steps in as a buyer of last resort. Fruits and vegetables do not enjoy the same protection: they account for less than 1% of the $25 billion the federal government spends on farm subsidies. As a result, the vegetable market is subject to wild variations based on weather and other only vaguely predictable factors.

Josh Ruiz with Big Red

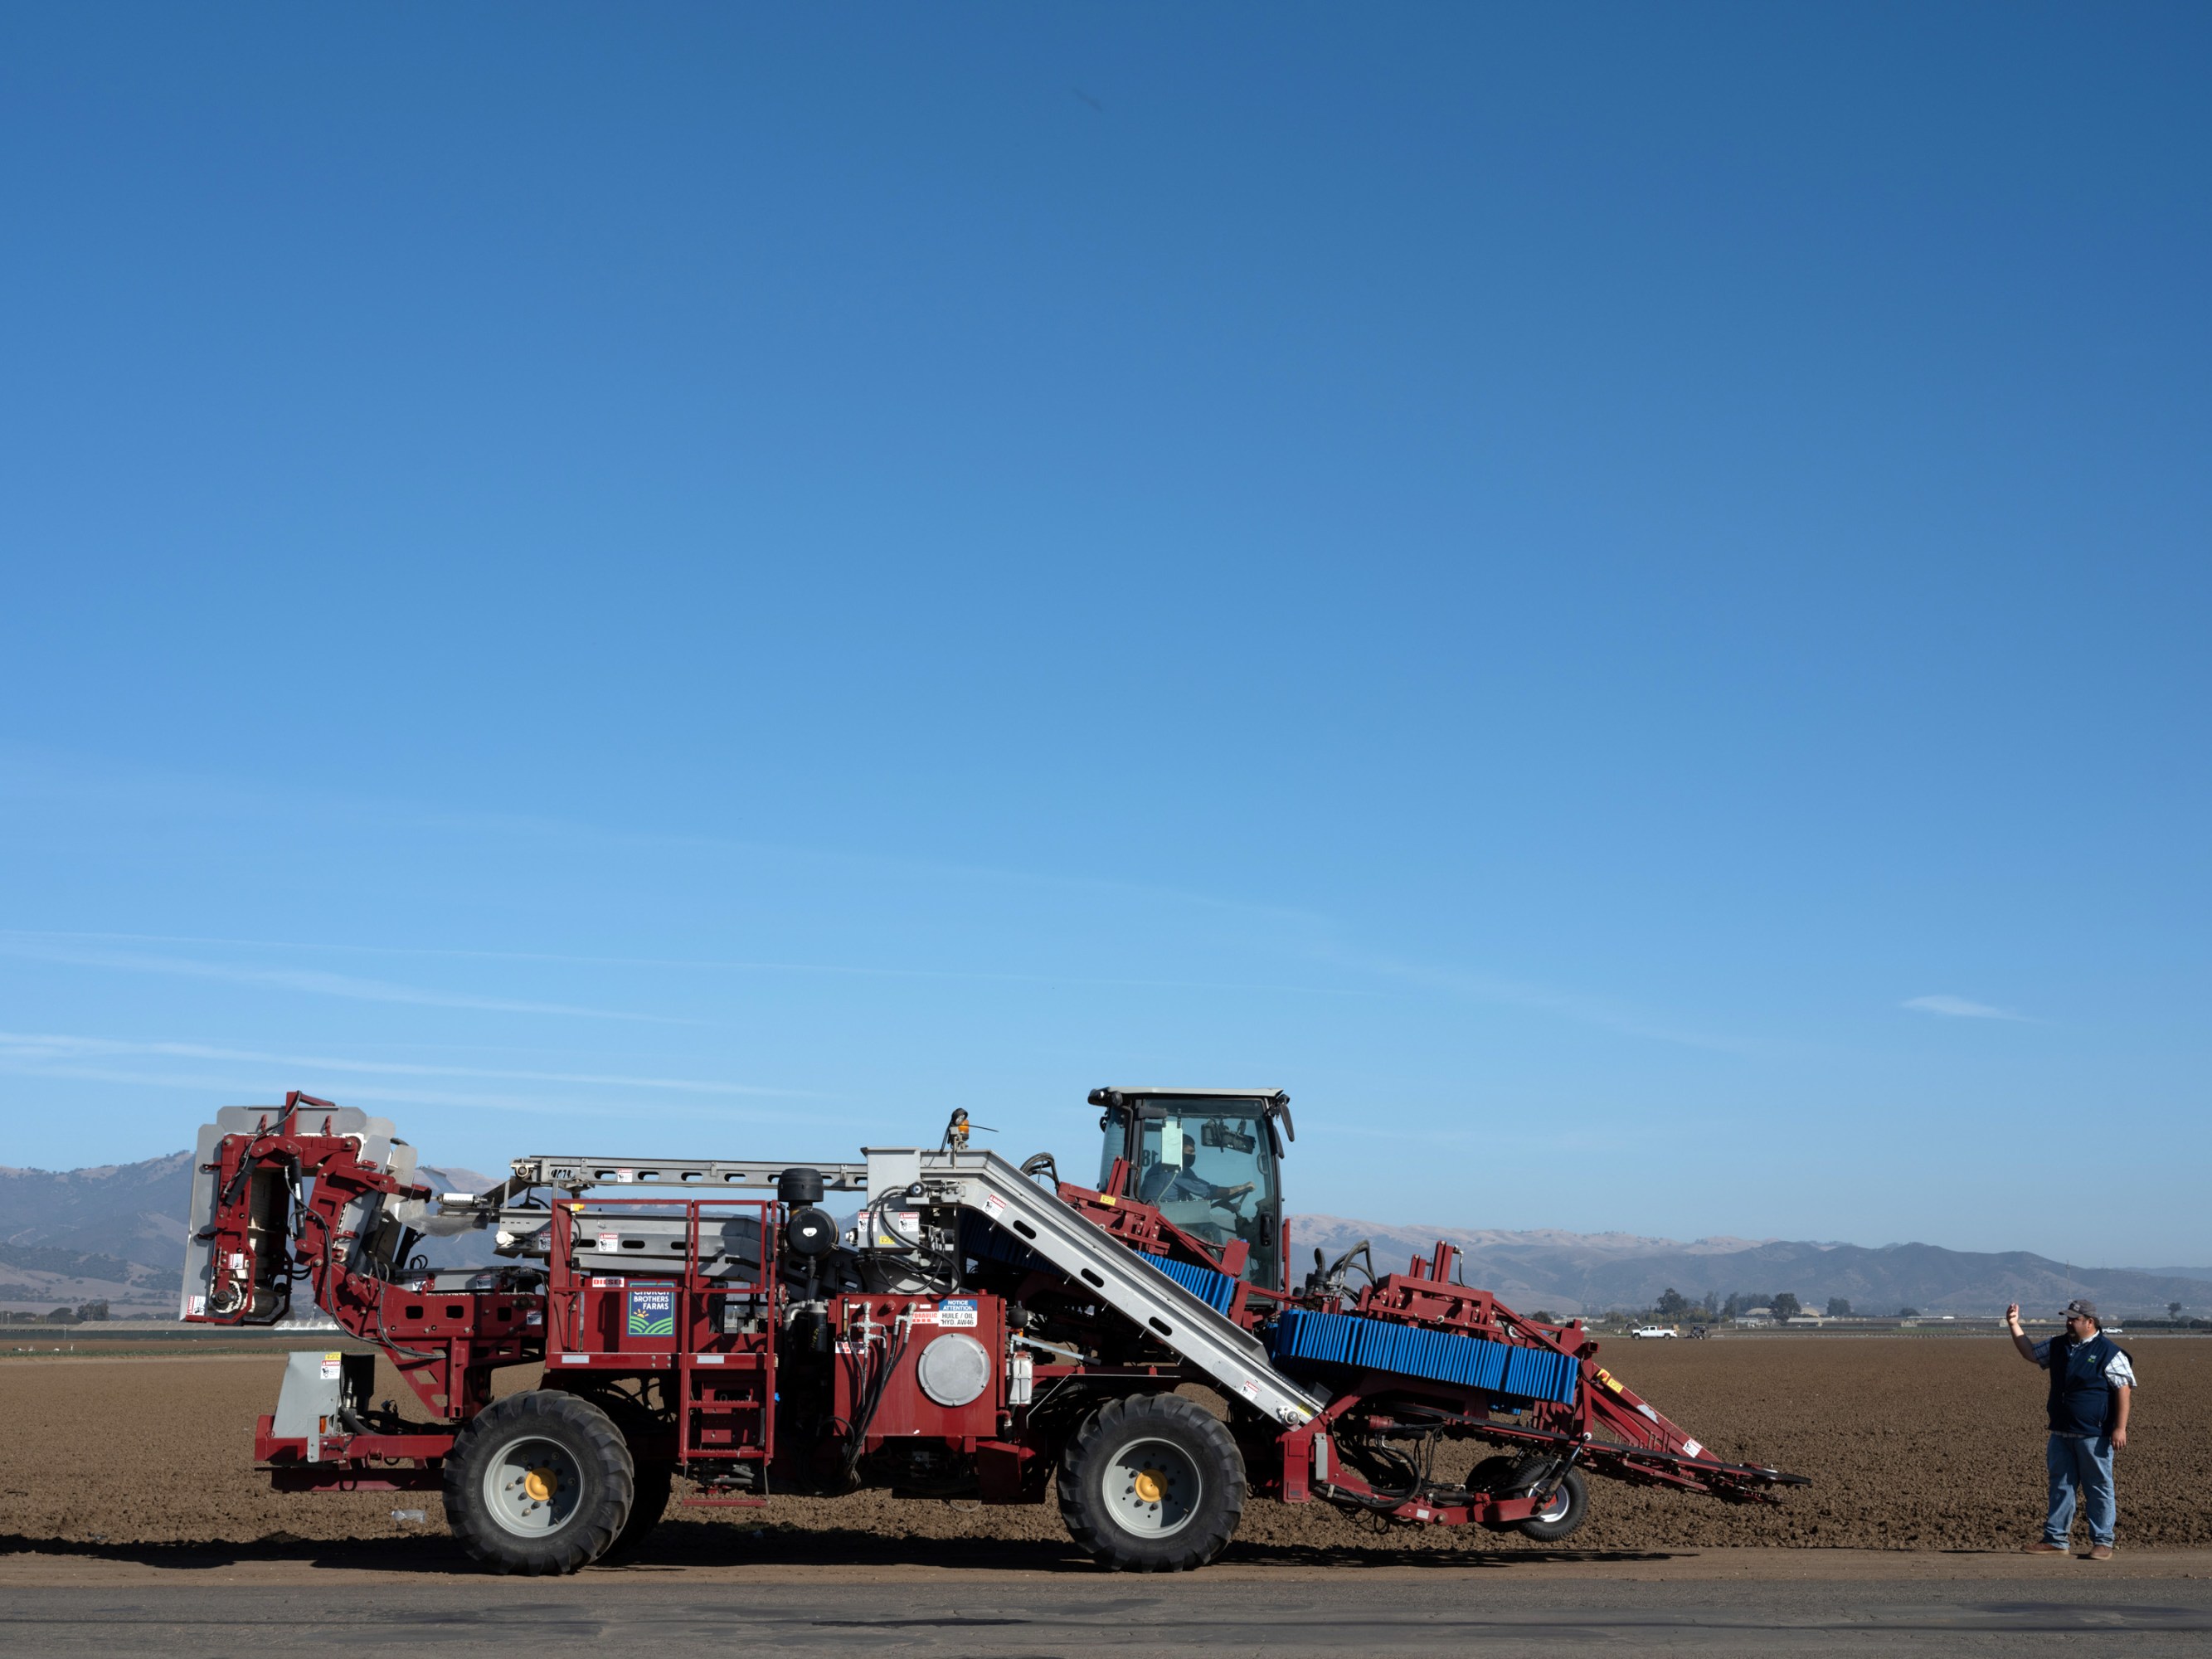
Josh Ruiz, the vice president of ag operations at Church Brothers, a greens-growing concern, with “Big Red,” an automated broccoli harvester of his design.

When I visited Salinas, in September, the lettuce industry was in the midst of a banner week price-wise, with whole heads of iceberg and romaine earning shippers as much as $30 a box, or roughly $30,000 an acre. “Right now, you have the chance to lose a fortune and make it back,” Ruiz said as we stood at the edge of a field. The swings can be dramatic: a few weeks earlier, he explained, iceberg was selling for a fraction of that amount—$5 a box, about half what it costs to produce and harvest. 

In the next field over, rows of young iceberg lettuce seedlings were ribbed with streaks of tawny brown—the mark of the impatiens necrotic spot virus, or INSV, which has been wreaking havoc on Salinas lettuce since the mid-aughts. These were the early signs. Come back after a couple more weeks, Ruiz said, and half the plants will be dead: it won’t be worthwhile to harvest at all. As it was, that outcome would represent a $5,000 loss, based on the costs of land, plowing, planting, and inputs. If they decided to weed and harvest, that loss could easily double. Ruiz said he wouldn’t have known he was wasting $5,000 if he hadn’t decided to take me on a drive that day. Multiply that across more than 20,000 acres. Assuming a firm could reliably deliver that kind of advance knowledge about INSV, how much would it be worth to him? 

One firm trying to find out is an imagery and analytics startup called GeoVisual Analytics, based in Colorado, which is working to refine algorithms that can project likely yields a few weeks ahead of time. It’s a hard thing to model well. A head of lettuce typically sees more than half its growth in the last three weeks before harvest; if it stays in the field just a couple of days longer, it could be too tough or spindly to sell. Any model the company builds has to account for factors like that and more. A ball of iceberg watered at the wrong time swells to a loose bouquet. Supermarket carrots are starved of water to make them longer. 

When GeoVisual first got to Salinas, in 2017, “we came in promising the future, and then we didn’t deliver,” says Charles McGregor, its 27-year-old general manager. Ruiz, less charitably, calls their first season an “epic fail.” But he gives McGregor credit for sticking around. “They listened and they fixed it,” he says. He’s just not sure what he’s willing to pay for it.

“We came in promising the future, and then we didn’t deliver.”

Charles McGregor

As it stands, the way field men arrive at yield forecasts is decidedly analog. Some count out heads of lettuce pace by pace and then extrapolate by measuring their boots. Others use a 30-foot section of sprinkler pipe. There’s no way methods like these can match the scale of what a drone or an airplane might capture, but the results have the virtue of a format growers can easily process, and they’re usually off by no more than 25 to 50 boxes an acre, or about 3% to 5%. They’re also part of a farming operation’s baseline expenses: if the same employee spots a broken irrigation valve or an empty fertilizer tank and makes sure the weeding crew starts on time, then asking him to deliver a decent harvest forecast isn’t necessarily an extra cost. By contrast, the pricing of tech-driven forecasts tends to be uneven. Tech salespeople lowball the cost of service in order to get new customers and then, eventually, have to figure out how to make money on what they sell.

“At 10 bucks an acre, I’ll tell [GeoVisual] to fly the whole thing, but at $50 an acre, I have to worry about it,” Ruiz told me. “If it costs me a hundred thousand dollars a year for two years, and then I have that aha! moment, am I gonna get my two hundred thousand dollars back?”


IV

All digital sensing for agriculture is a form of measurement by proxy: a way to translate slices of the electromagnetic spectrum into understanding of biological processes that affect plants. Thermal infrared reflectance correlates with land surface temperature, which correlates with soil moisture and, therefore, the amount of water available to plants’ roots. Measuring reflected waves of green, red, and near-infrared light is one way to estimate canopy cover, which helps researchers track evapotranspiration—that is, how much water evaporates through a plant’s leaves, a process with clear links to plant health.

Improving these chains of extrapolation is a call and response between data generated by new generations of sensors and the software models that help us understand them. Before the launch of the EU’s first Sentinel satellite in 2014, for instance, researchers had some understanding of what synthetic aperture radar, which builds high-resolution images by simulating large antennas, could reveal about plant biomass, but they lacked enough real-world data to validate their models. In the American West, there’s abundant imagery to track the movement of water over irrigated fields, but no crop model sufficiently advanced to reliably help farmers decide when to “order” irrigation water from the Colorado River, which is usually done days ahead of time. 

As with any Big Data frontier, part of what’s driving the explosion of interest in ag tech is simply the availability of unprecedented quantities of data. For the first time, technology can deliver snapshots of every individual broccoli crown on a 1,000-acre parcel and show which fields are most likely to see incursions from the deer and wild boars that live in the hills above the Salinas Valley. 

The problem is that turning such a firehose of 1s and 0s into any kind of useful insight—producing, say, a text alert about the top five fields with signs of drought stress—requires a more sophisticated understanding of the farming business than many startups seem to have. As Paul Fleming, a longtime farming consultant in Salinas, put it, “We only want to know about the things that didn’t go the way they’re supposed to.”

“We only want to know about the things that didn’t go the way they’re supposed to.”

Paul Fleming

And that’s just the beginning. Retail shippers get paid for each head of cauliflower or bundle of kale they produce; processors, who sell pre-cut broccoli crowns or bags of salad mix, are typically paid by weight. Contract farmers, hired to grow a crop for someone else for a per-acre fee, might never learn whether a given harvest was a “good” or a “bad” one, representing a profit or a loss for the shipper that hired them. It’s often in a shipper’s interest to keep individual farmers in the dark about where they stand relative to their nearby competitors.

In Salinas, the challenge of making big data relevant to farm managers is also about consolidating the universe of information farms already collect—or, perhaps, don’t. Aaron Magenheim, who grew up in his family’s irrigation business and now runs a consultancy focused on farm technology, says the particulars of irrigation, fertilizer, crop rotations, or any number of variables that can influence harvest tend to get lost in the hubbub of the season, if they’re ever captured at all. “Everyone thinks farmers know how they grow, but the reality is they’re pulling it out of the air. They don’t track that down to the lot level,” he told me, using an industry term for an individual tract of farmland. As many as 40 or 50 lots might share the same well and fertilizer tank, with no precise way of accounting for the details. “When you’re applying fertilizer, the reality is it’s a guy opening a valve on a tank and running it for 10 minutes, and saying, ‘Well that looks okay.’ Did Juan block number 6 or number 2 because of a broken pipe? Did they write it down?” Magenheim says. “No! Because they have too many things to do.”

Then there are the maps. Compared with corn and soybean operations, where the same crops get planted year after year, or vineyards and orchards, where plantings may not change for more than a generation, growers of specialty crops deal with a never-ending jigsaw puzzle of romaine following celery following broccoli, with plantings that change size and shape according to the market, and cycles as short as 30 days from seed to harvest.

worker harvests celery crop

For many companies in Salinas, the man standing astride the gap between what happens in the field and the record-keeping needs of a modern farming business is a 50-year-old technology consultant named Paul Mariottini. Mariottini—who planned to become a general contractor until he got a computer at age 18 and, as he puts it, “immediately stopped sleeping”—runs a one-man operation out of his home in Hollister, with a flip phone and a suite of bespoke templates and plug-ins he writes for Microsoft Access and Excel. When I asked the growers I met how they handled this part of the business, the reply, to a person, was: “Oh, we use Paul.”

Mariottini’s clients include some of the largest produce companies in the world, but only one uses tablets so that field supervisors can record the acreage and variety of each planting, the type and date of fertilizer and pesticide applications, and other basic facts about the work they supervise while it’s taking place. The rest take notes on paper, or enter the information from memory at the end of the day. 

When I asked Mariottini whether anyone used software to link paper maps to the spreadsheets showing what got planted where, he chuckled and said, “I’ve been doing this for 20 years trying to make that happen.” He once programmed a PalmPilot; he calls one of his plug-ins “Close-Enough GPS.” “The tech industry would probably laugh at it, but the thing that the tech industry doesn’t understand is the people you’re working with,” he said.


V

The goal of automation in farming is best understood as all encompassing. The brief weeks of harvest consume a disproportionate share of the overall budget—as much as half the cost of growing some crops. But there are also efforts to optimize and minimize labor throughout the growing cycle. Strawberries are being grown with spray-on, biodegradable weed barriers that could eliminate the need to spread plastic sheeting over every bed. Automated tractors will soon be able to plow vegetable fields to a smoother surface than a human driver could, improving germination rates. Even as analytics companies race to deliver platforms that can track the health of an individual head of lettuce from seed to supermarket and optimize the order in which fields get harvested, other startups are developing new “tapered” varieties of lettuce—similar to romaine—with a compact silhouette and leaves that rest higher off the ground, in order that they might be more easily “seen” and cut by a robot.

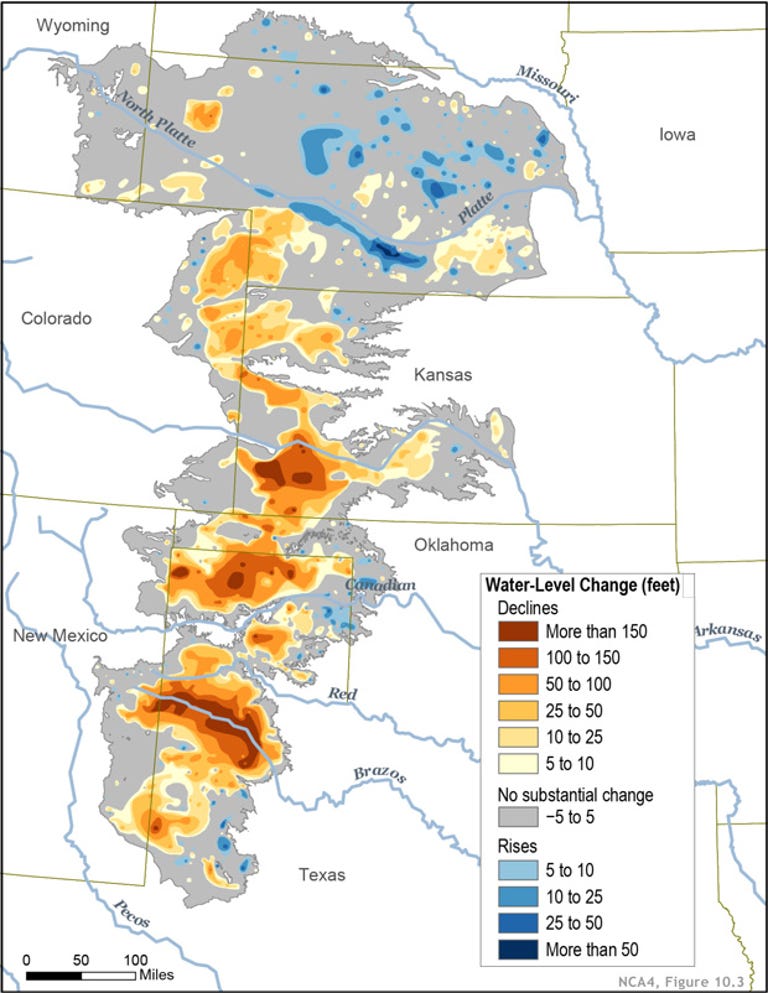
Overall, though, the problems with the American food system aren’t about technology so much as law and politics. We’ve known for a long time that the herbicide Roundup is tied to increased cancer rates, yet it remains widely used. We’ve known for more than 100 years that the West is short on water, yet we continue to grow alfalfa in the desert, and use increasingly sophisticated drilling techniques in a kind of water arms race. These are not problems caused by a lack of technology.

On my last day in Salinas, I met a grower named Mark Mason just off Highway 101, which cuts the valley in two, and followed him to a nine-acre block of celery featuring a tidy tower of meteorological equipment in the center. The equipment is owned by NASA, part of a joint project with the University of California’s Agriculture and Natural Resources cooperative extension office, or UCANR.

Eight years ago, amid news of droughts and forest fires across the West, Mason felt a gnawing sense that he ought to be a more careful steward of the groundwater he uses to irrigate, even if the economics suggested otherwise. That led him to contact Michael Cahn, a researcher at UCANR.

Historically, water in Salinas has always been cheap and abundant: the downside of under-irrigating, or of using too little fertilizer, has always been far larger than the potential savings. “Growers want to sell product; efficient use is secondary. They won’t cut it close and risk quality,” Cahn said. The risk might even extend to losing a crop. 

Of late, though, nitrate contamination of drinking water, caused by heavy fertilizer use and linked to thyroid disease and some types of cancer, has become a major political issue in Salinas. The local water quality control board is currently developing a new standard that will limit the amount of nitrogen fertilizer growers can apply to their fields, and it’s expected to be finalized in 2021. As Cahn explained, “You can’t control nitrogen without controlling your irrigation water.” In the meantime, Mason and a handful of other growers are working with UCANR on a software platform called Crop Manage, designed to ingest weather and soil data and deliver customized recommendations on irrigation and fertilizer use for each crop.

Michael Cahn

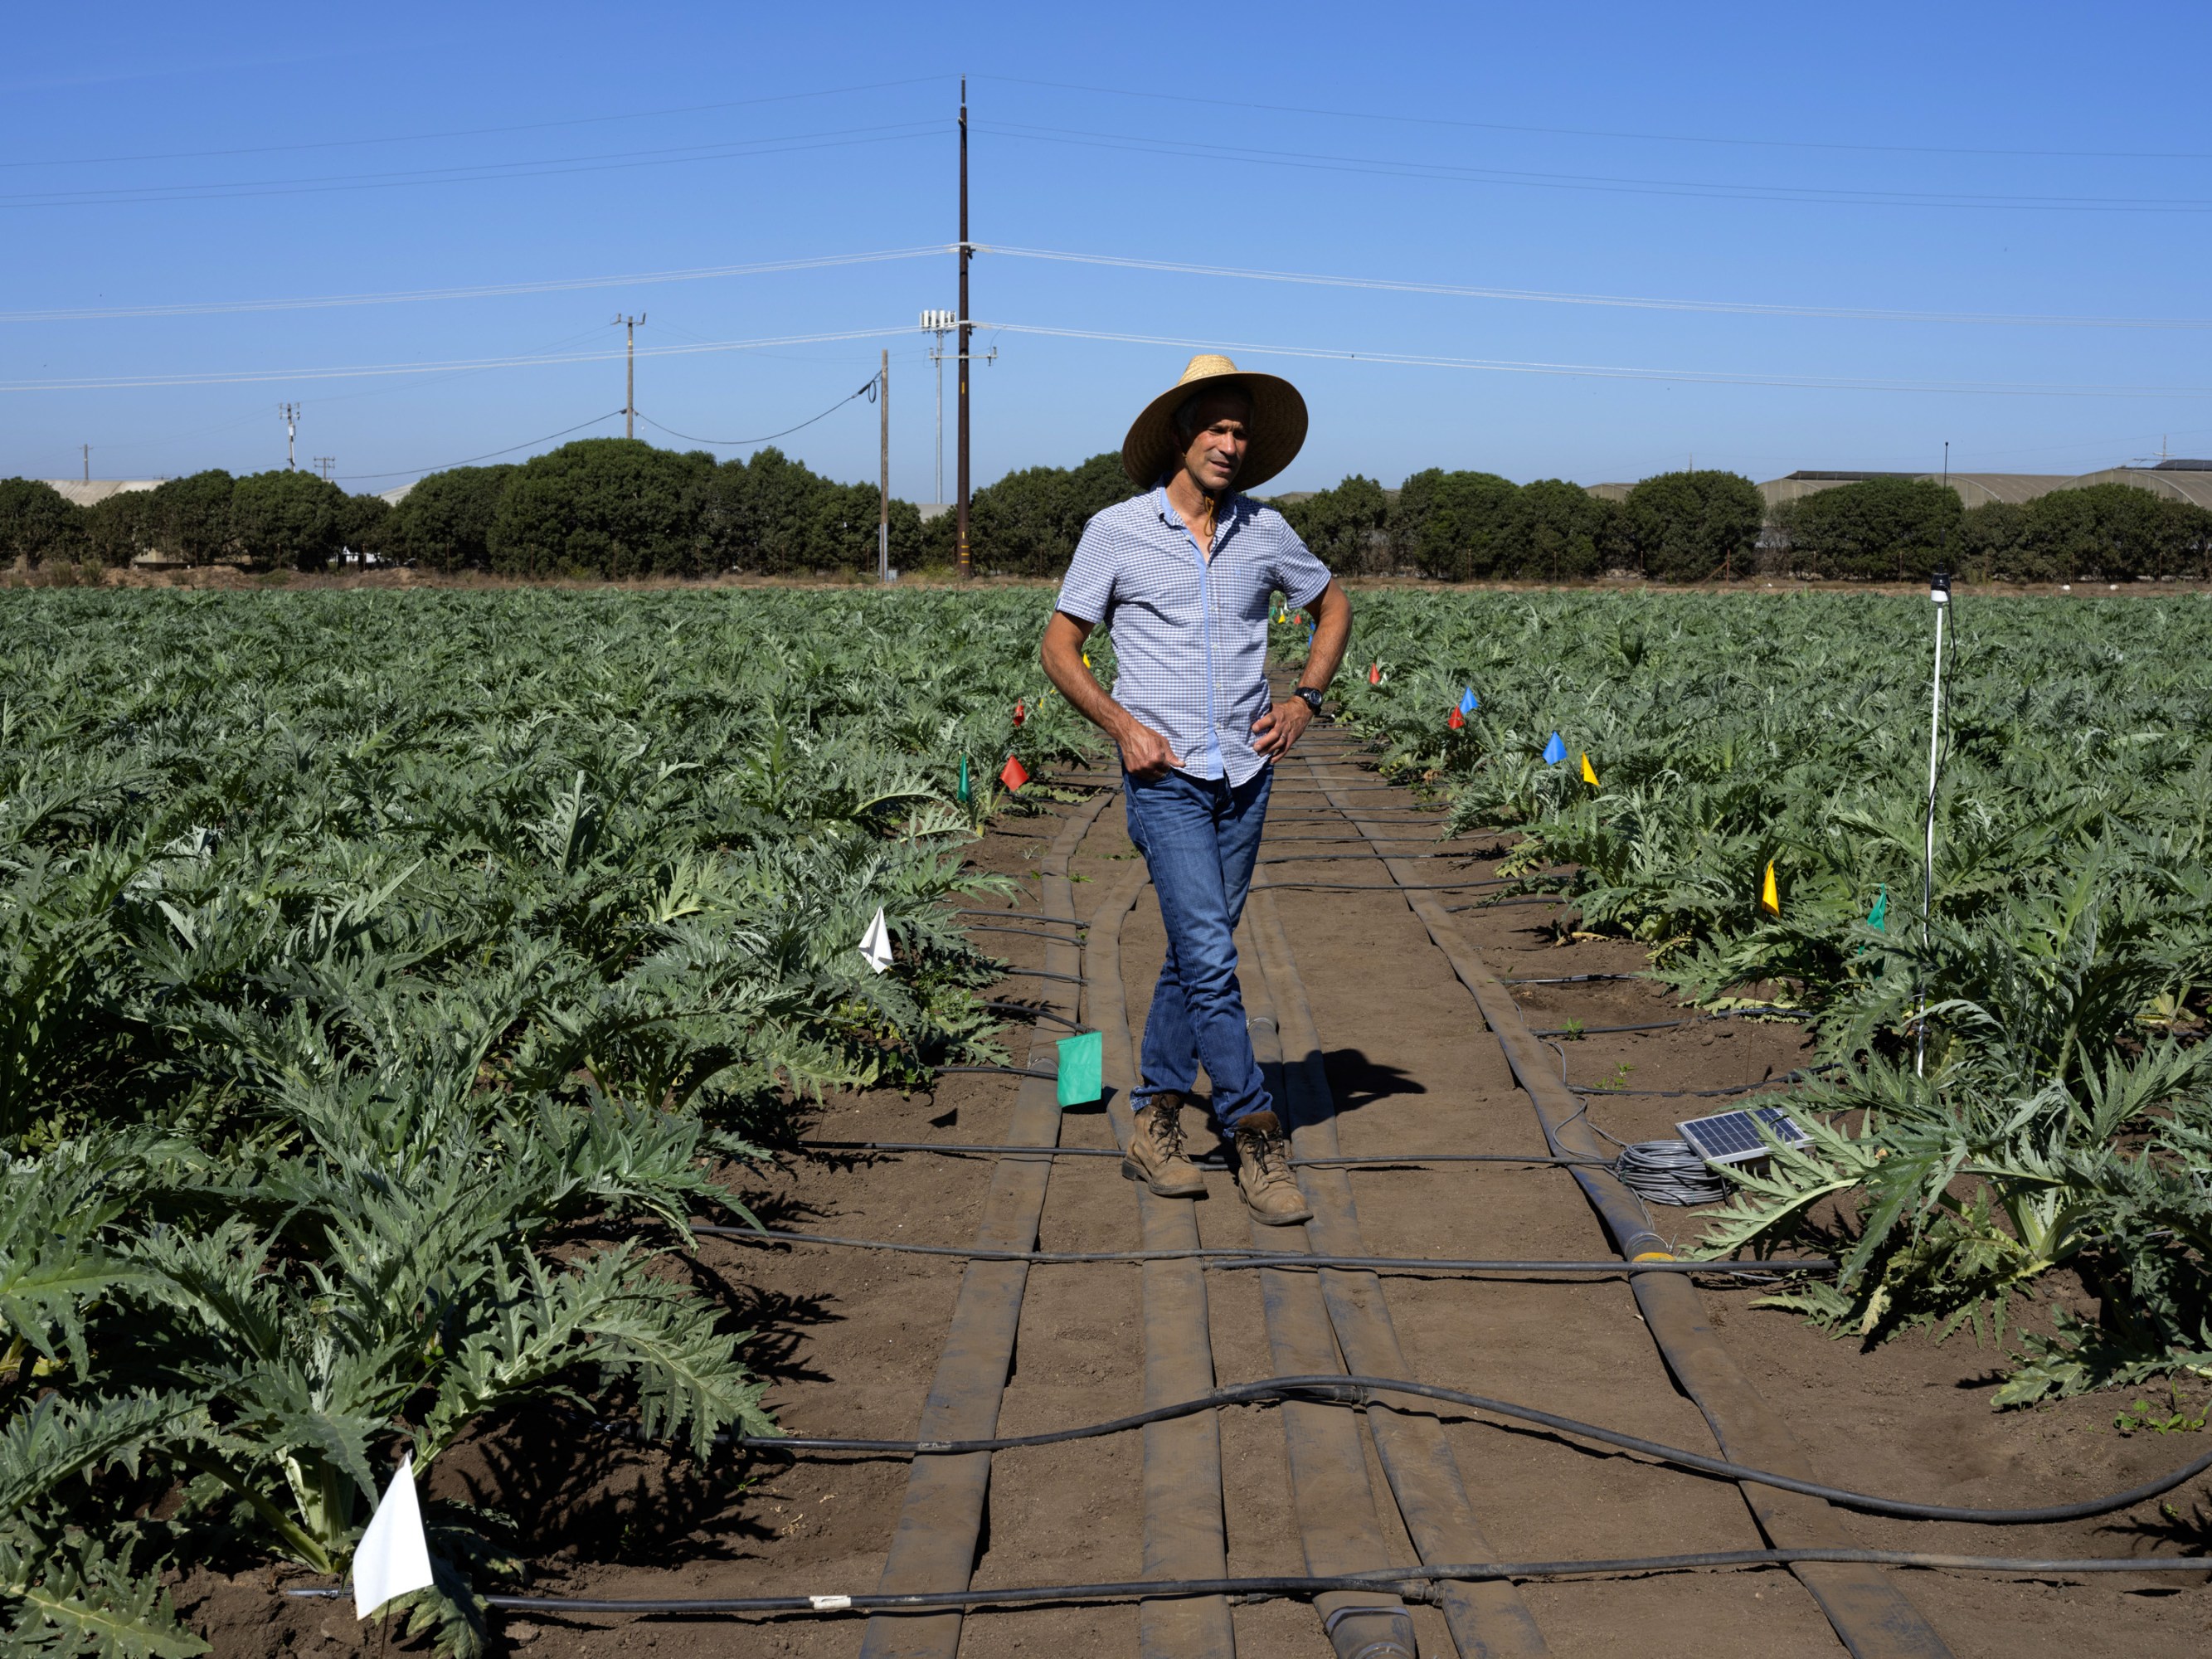
Michael Cahn, a researcher at the University of California who’s developing software to optimize water and fertilizer use, at a water trial for artichokes.

Cahn says he expects technological advances in water management to follow a course similar to the one being set by the threat of tighter regulations on nitrogen fertilizer. In both cases, the business argument for a fix and the technology required to get there lie somewhere downstream of politics. Outrage over lack of access to clean groundwater brought forth a new regulatory mechanism, which unlocked the funding to figure out how to measure it, and which will, in turn, inform the management approaches farmers use. 

In the end, then, it’s political pressure that has created the conditions for science and technology to advance. For now, venture capital and federal research grants continue to provide an artificial boost for ag tech while its potential buyers—such as lettuce growers—continue to treat it with a degree of caution. 

But just as new regulations can reshape the cost-benefit analysis around nitrogen or water use from one day to the next, so too can a product that brings clear returns on investment. All the growers I spoke to spend precious time keeping tabs on the startup world: taking phone calls, buying and testing tech-powered services on a sliver of their farms, making suggestions on how to target analytics or tweak a farm-facing app. Why? To have a say in how the future unfolds, or at least to get close enough to see it coming. One day soon, someone will make a lot of money following a computer’s advice about how high to price lettuce, or when to spray for a novel pest, or which fields to harvest and which ones to abandon. When that happens, these farmers want to be the first to know. 

How next-gen satellites are transforming our view of climate change (CNET)

cnet.com

Megan Wollerton – Jan. 18 2022


climate-change-maps.png
Robert Rodriguez/CNET
As more frequent and more severe storms erode coastlines, mapmakers must adapt quickly.

A shrinking swath of coastline in Washington state has a regrettable nickname: Washaway Beach. It’s named not for what’s there, but rather for what isn’t. Insatiable Pacific Ocean currents have taken greedy bites out of the land over the past century.

Washaway Beach’s disappearing shore isn’t measured in centimeters or inches. You can’t track the changes with a hardware store measuring stick. Residents of the area, roughly two and a half hours southwest of Seattle, are watching their homes and businesses get swallowed by the sea at an average rate of 100 feet per year; that’s about the height of a 10-story building. It’s the fastest-eroding place in the western United States.

Washaway Beach is an extreme case of erosion. Many factors contribute to its rapid decline. But the quickening march of climate change, including rising sea levels and more frequent and severe storms, poses a growing threat to coastal communities everywhere. 

I’ve never been to Washaway Beach. I’m hearing about it for the first time from Peter Doucette, the acting director for the Earth Resources Observation and Science Center at the US Geological Survey. Doucette is showing me over Zoom a colorful animated map of how the community changed between 1985 and 2017. The water eats away at the map’s multicolored patches. The brown beaches, red developed areas and light blue freshwater bogs evaporate in the Pacific’s 32-year sprint to wipe out the town. It’s jarring to watch how quickly the land dissolves into the deep blue as the ocean takes over. 

Watch Washaway Beach disappear. USGS

Scientists didn’t have the tech to visualize changes like this even five or 10 years ago, though they had the data. “This is the power of using the data from time; it’s taking advantage of the time dimension, which requires a lot of computing power … but we have that now,” Doucette explains. 

Faster satellites, sharper images taken in near real-time and advanced computing techniques are making it possible for mapmakers to redraw Washaway Beach as soon as coastal changes occur. Emerging technologies will help scientists predict what could happen to it in the future, just like a weather report. 

For coastal residents around the world, or anyone living in an area susceptible to extreme weather events, this type of mapping could save lives. Up-to-date maps can provide crucial information for first responders needing to traverse areas hit by natural disasters; residents and visitors need regular, ongoing updates to adapt to a changing landscape. 

For anyone living in areas less directly affected by the climate crisis, maps that show change over time provide a crucial bridge to understanding what’s really happening in other places, and how quickly. 

“By helping people visualize how the world is changing, maybe that will give them a better understanding of climate change as a whole,” says Tanya Harrison, director of science strategy at Planet, a private satellite imagery company. “How is your neighborhood being affected? How is your grandmother’s house being affected? Maybe she lives on the other side of the country or the other side of the world. In a way, that can kind of make this a little bit more personal.”

From clay tablets to satellites

Maps aren’t easy to define. They’re squishy things, molded by the minds of the people who create them. Imperfect representations of our world. One part art; one part science.

Still, they give us a baseline for decision-making, whether it’s finding the closest coffee shop, climbing a mountain or helping people understand something more serious, like climate change.

“[Maps are] such a great intuitive way to gather information and humans are really good at understanding spatial information presented in that way,” says Mike Tischler, director of the National Geospatial Program at the US Geological Survey. “You want to know what’s over the ridge, you want to know what’s around the bend, you want to know where things are.” That’s probably why maps have been around for thousands of years. 

A clay tablet known as the Babylonian Map of the World, or Imago Mundi, is the oldest known map of the world. It was discovered in Iraq and dates back to about 600 B.C.

404485001
The Babylonian Map of the World is the oldest map of the world. The Trustees of the British Museum

Modern mapmaking got its start in 1852, when French army officer Aimé Laussedat created the first maps with photographs. Laussedat also experimented with aerial photography, sticking cameras on kites and balloons. As air travel became more sophisticated, aerial photography transitioned from balloons to planes in World War I and World War II and, eventually, to satellites in the 1970s. 

Nowadays, aerial photography is more automated than it was when ground crews launched unsteady balloons into the air, hoping to get the right shots. Hundreds or thousands of images are taken automatically from planes and satellites to make maps. Now planes and satellites visit the same place regularly, reliably showing how land changes over time.

“Land change is really complex. … Tying it to climate, I’m not sure we’re there yet,” says Jesslyn Brown, research geographer for the Earth Resources Observation and Science Center at the US Geological Survey. You can’t identify patterns that could point to climate change without monitoring the same places at regular intervals.

“This might be a little controversial, but my opinion is that governments don’t find monitoring very sexy,” Brown says. “But it’s an absolute necessity because you can’t manage what you can’t measure, so we need to take these measurements in order to have the information to monitor the Earth and to monitor the effects of climate change.”

Chasing change 

In the US, Landsat is the best-known Earth-observing satellite for monitoring and mapping purposes. Landsat 7 and Landsat 8 circle the globe once every 99 minutes, traveling at 17,000 miles per hour. Each satellite covers the entire planet in 16 days. Together, they cover the Earth in eight days because they’re in reverse orbit. 

The satellites are “roughly the size of a small school bus,” says Doucette, the USGS director who showed me the map of Washaway Beach, and have a 30-meter resolution, “about the size of a baseball diamond per pixel.”

Generations of Landsat satellites have been doing this since 1972. That 50-year record makes it extremely valuable for tracking changes over time.

“[50 years of data] provides researchers the ability to go back through time and monitor what kinds of changes are going on on the land surface,” Doucette says. “That really wasn’t possible until just the last five to 10 years with the big data compute capabilities that have become available.”

l9-himalaya-hyperwall-rgb-nolabels
This image of the Himalayan Mountains is one of the first shots taken by Landsat 9.  NASA

NASA launched its newest satellite, Landsat 9, on Sept. 27. Soon, it will hand over control of Landsat 9 to the USGS. Then, Landsat 7, which has been orbiting the planet for 22 years, will be retired. Most old Landsat satellites go into “disposal orbits,” destined to circle the planet until they eventually reenter the atmosphere and burn up. Landsat 7 won’t have the same fate; it will be moved into a different orbit to help test NASA’s robotic refueling project, Doucette explains. 

Landsat is still the gold standard for satellite imagery, says Terry Sohl, acting branch chief for the Integrated Science and Applications Branch and research scientist at the USGS Earth Resources Observation and Science Center. “To be honest, I’m not sure that’s going to be the case in five years,” Sohl adds.

Private satellite companies are making it easier than ever to visualize changes worldwide almost as soon as they happen for much less money than Landsat. 

Smaller, faster, cheaper, sharper

“If you’ve got a satellite right now that covers the Earth every two weeks, you can have homes and cities destroyed in that time,” says Tischler, the USGS director of the National Geospatial Program. Private companies are sending larger numbers of tiny satellites into orbit that cost less to build, launch and operate, have very high-resolution cameras and cover more ground more quickly. 

One of the private companies, Planet, has two different types of satellites: Dove and Sky satellites. The 180 Dove satellites are the size of a loaf of bread; they orbit the globe every 90 minutes and have a three- to five-meter resolution, or about 10 to 16 feet. 

Fifteen of the Sky satellites orbit at the poles like the Dove satellites. The remaining six Sky satellites orbit at latitudes closer to where people live to capture images of cities. Combined, the Sky satellites orbit Earth 12 times per day. Sky satellites are about the size of a dishwasher and have a resolution of just 50 centimeters, or a little over a foot and a half. They capture details that Landsat’s baseball-diamond-size resolutions can’t. 

Planet satellites show the Milne Ice Shelf breaking apart in July 2020. Planet Labs PBC

Smaller satellites are cheaper, too. It costs about a billion dollars to design, build, test and deploy one Landsat satellite. One Planet satellite costs in the “low hundreds of thousands of dollars,” although the company wouldn’t say exactly how much. 

Having a lot of smaller satellites also makes it easier for the San Francisco-based team to build them locally and experiment with new technologies quickly. 

“If there’s something new that comes to the market that could lead to better image quality … we have the option to just switch that out in-house where we’re actually building the satellites in the basement of our headquarters in San Francisco and just say, ‘Hey, let’s put in a new sensor. Let’s launch that,'” says Harrison, Planet’s director of science strategy. 

That way, if they want to test something, they can try it on one satellite and see how it works, without having to update all 200 satellites in their fleet.

Its various satellites have observed many events related to the climate crisis all over the world. The most significant changes they’ve seen have taken place in the coldest regions.

In July 2020, Planet satellites captured the collapse of the last intact Arctic ice shelf. “That was obviously a big tragedy. It’s not the kind of thing that you want to see, but it’s something that we managed to capture,” Harrison says.

Seeing is believing

Newer satellites are giving us more data, more quickly. Advancements in computing are changing how mapmakers use that data to show how our planet is changing right now and how it could change in the future.

Doucette is showing me another map now, this time a projection of what the land near Lubbock, Texas, will look like decades from now. At some point, the Ogallala Aquifer, which supports cotton and other key crops in the region, is going to dry up. Scientists at the USGS worked with other government agencies to create forecasts of Lubbock between 2014 and the end of the century, drawing from Landsat data, socio-economic data and climate data.

The map shows the cotton crop disappearing in tandem with the Ogallala’s water. The projections will vary based on how water usage continues, so scientists create best, middle and worst case scenarios because of the uncertainty. 

“Climate is actually much more predictable than people. I don’t worry about the variability in a climate scenario; I worry about the variability of how people behave,” says Sohl, the USGS scientist. “There are all these things that happen that are just so totally unpredictable, like a new government policy that can have a huge impact on the landscape.”

ogallala-changes-620
What happens when the Ogallala Aquifer runs out of water? NOAA

Either way, the Ogallala’s water will disappear and it isn’t coming back.

Knowing this in advance gives people in Lubbock time to shift to other types of crops that don’t depend so heavily on water. Doucette suggests dryland wheat or returning the area to grassland.

“This is how we hope to use Landsat and other related Earth observation data so we can understand the causes of change in the past that kind of help us develop these models for projecting potential change going into the future,” Doucette says. 

Historic data from Landsat combined with sharper-resolution imagery from private satellite companies equips mapmakers to show climate change impacts now and model what could happen to the same areas decades or even centuries from now. “[Landsat and private satellite companies] really [are] a nice mix of where we’re going in the future,” says Sohl.

As Washaway Beach’s erosion cuts further into inland Washington state, the freshwater cranberry bogs the area is known for are increasingly threatened with contamination from salt water. But with these technologies, scientists can look at the models and make decisions before Washaway Beach, the Ogallala Aquifer and other places like them fall off the map. 

“Imagine being able to do this kind of projection … and doing it on a national scale or even a global scale,” Doucette adds. “That’s our hope; this is still kind of cutting-edge research.” 

Soon, satellites will be able to watch you everywhere all the time (MIT Technology Review)

Can privacy survive?

Christopher Beam

June 26, 2019


In 2013, police in Grants Pass, Oregon, got a tip that a man named Curtis W. Croft had been illegally growing marijuana in his backyard. So they checked Google Earth. Indeed, the four-month-old satellite image showed neat rows of plants growing on Croft’s property. The cops raided his place and seized 94 plants.

In 2018, Brazilian police in the state of Amapá used real-time satellite imagery to detect a spot where trees had been ripped out of the ground. When they showed up, they discovered that the site was being used to illegally produce charcoal, and arrested eight people in connection with the scheme.

Chinese government officials have denied or downplayed the existence of Uighur reeducation camps in Xinjiang province, portraying them as “vocational schools.” But human rights activists have used satellite imagery to show that many of the “schools” are surrounded by watchtowers and razor wire.

Every year, commercially available satellite images are becoming sharper and taken more frequently. In 2008, there were 150 Earth observation satellites in orbit; by now there are 768. Satellite companies don’t offer 24-hour real-time surveillance, but if the hype is to be believed, they’re getting close. Privacy advocates warn that innovation in satellite imagery is outpacing the US government’s (to say nothing of the rest of the world’s) ability to regulate the technology. Unless we impose stricter limits now, they say, one day everyone from ad companies to suspicious spouses to terrorist organizations will have access to tools previously reserved for government spy agencies. Which would mean that at any given moment, anyone could be watching anyone else.

The images keep getting clearer

Commercial satellite imagery is currently in a sweet spot: powerful enough to see a car, but not enough to tell the make and model; collected frequently enough for a farmer to keep tabs on crops’ health, but not so often that people could track the comings and goings of a neighbor. This anonymity is deliberate. US federal regulations limit images taken by commercial satellites to a resolution of 25 centimeters, or about the length of a man’s shoe. (Military spy satellites can capture images far more granular, although just how much more is classified.)

Ever since 2014, when the National Oceanic and Atmospheric Administration (NOAA) relaxed the limit from 50 to 25 cm, that resolution has been fine enough to satisfy most customers. Investors can predict oil supply from the shadows cast inside oil storage tanks. Farmers can monitor flooding to protect their crops. Human rights organizations have tracked the flows of refugees from Myanmar and Syria.

But satellite imagery is improving in a way that investors and businesses will inevitably want to exploit. The imaging company Planet Labs currently maintains 140 satellites, enough to pass over every place on Earth once a day. Maxar, formerly DigitalGlobe, which launched the first commercial Earth observation satellite in 1997, is building a constellation that will be able to revisit spots 15 times a day. BlackSky Global promises to revisit most major cities up to 70 times a day. That might not be enough to track an individual’s every move, but it would show what times of day someone’s car is typically in the driveway, for instance.

Some companies are even offering live video from space. As early as 2014, a Silicon Valley startup called SkyBox (later renamed Terra Bella and purchased by Google and then Planet) began touting HD video clips up to 90 seconds long. And a company called EarthNow says it will offer “continuous real-time” monitoring “with a delay as short as about one second,” though some think it is overstating its abilities. Everyone is trying to get closer to a “living map,” says Charlie Loyd of Mapbox, which creates custom maps for companies like Snapchat and the Weather Channel. But it won’t arrive tomorrow, or the next day: “We’re an extremely long way from high-res, full-time video of the Earth.”

Some of the most radical developments in Earth observation involve not traditional photography but rather radar sensing and hyperspectral images, which capture electromagnetic wavelengths outside the visible spectrum. Clouds can hide the ground in visible light, but satellites can penetrate them using synthetic aperture radar, which emits a signal that bounces off the sensed object and back to the satellite. It can determine the height of an object down to a millimeter. NASA has used synthetic aperture radar since the 1970s, but the fact that the US approved it for commercial use only last year is testament to its power—and political sensitivity. (In 1978, military officials supposedly blocked the release of radar satellite images that revealed the location of American nuclear submarines.)

While GPS data from cell phones is a legitimate privacy threat, you can at least decide to leave your phone at home. It’s harder to hide from a satellite camera.

Meanwhile, farmers can use hyperspectral sensing to tell where a crop is in its growth cycle, and geologists can use it to detect the texture of rock that might be favorable to excavation. But it could also be used, whether by military agencies or terrorists, to identify underground bunkers or nuclear materials. 

The resolution of commercially available imagery, too, is likely to improve further. NOAA’s 25-centimeter cap will come under pressure as competition from international satellite companies increases. And even if it doesn’t, there’s nothing to stop, say, a Chinese company from capturing and selling 10 cm images to American customers. “Other companies internationally are going to start providing higher-­resolution imagery than we legally allow,” says Therese Jones, senior director of policy for the Satellite Industry Association. “Our companies would want to push the limit down as far as they possibly could.”

What will make the imagery even more powerful is the ability to process it in large quantities. Analytics companies like Orbital Insight and SpaceKnow feed visual data into algorithms designed to let anyone with an internet connection understand the pictures en masse. Investors use this analysis to, for example, estimate the true GDP of China’s Guangdong province on the basis of the light it emits at night. But burglars could also scan a city to determine which families are out of town most often and for how long.

Satellite and analytics companies say they’re careful to anonymize their data, scrubbing it of identifying characteristics. But even if satellites aren’t recognizing faces, those images combined with other data streams—GPS, security cameras, social-media posts—could pose a threat to privacy. “People’s movements, what kinds of shops do you go to, where do your kids go to school, what kind of religious institutions do you visit, what are your social patterns,” says Peter Martinez, of the Secure World Foundation. “All of these kinds of questions could in principle be interrogated, should someone be interested.”

Like all tools, satellite imagery is subject to misuse. Its apparent objectivity can lead to false conclusions, as when the George W. Bush administration used it to make the case that Saddam Hussein was stockpiling chemical weapons in Iraq. Attempts to protect privacy can also backfire: in 2018, a Russian mapping firm blurred out the sites of sensitive military operations in Turkey and Israel—inadvertently revealing their existence, and prompting web users to locate the sites on other open-source maps.

Capturing satellite imagery with good intentions can have unintended consequences too. In 2012, as conflict raged on the border between Sudan and South Sudan, the Harvard-based Satellite Sentinel Project released an image that showed a construction crew building a tank-capable road leading toward an area occupied by the Sudanese People’s Liberation Army. The idea was to warn citizens about the approaching tanks so they could evacuate. But the SPLA saw the images too, and within 36 hours it attacked the road crew (which turned out to consist of Chinese civilians hired by the Sudanese government), killed some of them, and kidnapped the rest. As an activist, one’s instinct is often to release more information, says Nathaniel Raymond, a human rights expert who led the Sentinel project. But he’s learned that you have to take into account who else might be watching.

It’s expensive to watch you all the time

One thing that might save us from celestial scrutiny is the price. Some satellite entrepreneurs argue that there isn’t enough demand to pay for a constellation of satellites capable of round-the-clock monitoring at resolutions below 25 cm. “It becomes a question of economics,” says Walter Scott, founder of DigitalGlobe, now Maxar. While some companies are launching relatively cheap “nanosatellites” the size of toasters—the 120 Dove satellites launched by Planet, for example, are “orders of magnitude” cheaper than traditional satellites, according to a spokesperson—there’s a limit to how small they can get and still capture hyper-detailed images. “It is a fundamental fact of physics that aperture size determines the limit on the resolution you can get,” says Scott. “At a given altitude, you need a certain size telescope.” That is, in Maxar’s case, an aperture of about a meter across, mounted on a satellite the size of a small school bus. (While there are ways around this limit—interferometry, for example, uses multiple mirrors to simulate a much larger mirror—they’re complex and pricey.) Bigger satellites mean costlier launches, so companies would need a financial incentive to collect such granular data.

That said, there’s already demand for imagery with sub–25 cm resolution—and a supply of it. For example, some insurance underwriters need that level of detail to spot trees overhanging a roof, or to distinguish a skylight from a solar panel, and they can get it from airplanes and drones. But if the cost of satellite images came down far enough, insurance companies would presumably switch over.

Of course, drones can already collect better images than satellites ever will. But drones are limited in where they can go. In the US, the Federal Aviation Administration forbids flying commercial drones over groups of people, and you have to register a drone that weighs more than half a pound (227 grams) or so. There are no such restrictions in space. The Outer Space Treaty, signed in 1967 by the US, the Soviet Union, and dozens of UN member states, gives all states free access to space, and subsequent agreements on remote sensing have enshrined the principle of “open skies.” During the Cold War this made sense, as it allowed superpowers to monitor other countries to verify that they were sticking to arms agreements. But the treaty didn’t anticipate that it would one day be possible for anyone to get detailed images of almost any location.

And then there are the tracking devices we carry around in our pockets, a.k.a. smartphones. But while the GPS data from cell  phones is a legitimate privacy threat, you can at least decide to leave your phone at home. It’s harder to hide from a satellite camera. “There’s some element of ground truth—no pun intended—that satellites have that maybe your cell phone or digital record or what happens on Twitter [doesn’t],” says Abraham Thomas, chief data officer at the analytics company Quandl. “The data itself tends to be innately more accurate.”

The future of human freedom

American privacy laws are vague when it comes to satellites. Courts have generally allowed aerial surveillance, though in 2015 the New Mexico Supreme Court ruled that an “aerial search” by police without a warrant was unconstitutional. Cases often come down to whether an act of surveillance violates someone’s “reasonable expectation of privacy.” A picture taken on a public sidewalk: fair game. A photo shot by a drone through someone’s bedroom window: probably not. A satellite orbiting hundreds of miles up, capturing video of a car pulling into the driveway? Unclear.

That doesn’t mean the US government is powerless. It has no jurisdiction over Chinese or Russian satellites, but it can regulate how American customers use foreign imagery. If US companies are profiting from it in a way that violates the privacy of US citizens, the government could step in.

Raymond argues that protecting ourselves will mean rethinking privacy itself. Current privacy laws, he says, focus on threats to the rights of individuals. But those protections “are anachronistic in the face of AI, geospatial technologies, and mobile technologies, which not only use group data, they run on group data as gas in the tank,” Raymond says. Regulating these technologies will mean conceiving of privacy as applying not just to individuals, but to groups as well. “You can be entirely ethical about personally identifiable information and still kill people,” he says.

Until we can all agree on data privacy norms, Raymond says, it will be hard to create lasting rules around satellite imagery. “We’re all trying to figure this out,” he says. “It’s not like anything’s riding on it except the future of human freedom.”

Christopher Beam is a writer based in Los Angeles.

The space issue

This story was part of our July 2019 issue

Historic First Weather Satellite Image (Discovery)

By Tom Yulsman | April 2, 2013 7:46 pm

The first image ever transmitted back to Earth from a weather satellite. It was captured by TIROS-1. (Image: CIMSS Satellite Blog)

The awesome folks over at the satellite blog of the Cooperative Institute for Meteorological Satellite Studies posted this historic image yesterday — and I just couldn’t let it go without giving it more exposure.

The first weather satellite image ever, it was captured by TIROS-1 on April 1, 1960 — meaning yesterday was the 53rd anniversary of the event.

Okay, that may not be as significant as, say, the 50th anniversary was. But this is still a great opportunity to see how far we’ve come with remote sensing of the home planet.

On the same day that the satellite sent back this image, the U.S. Census Bureau determined that the resident population of the United States was 179,245,000. As I write this post, the bureau estimates the population to be 315,602,806. (By the time you read this, the population will be even larger!)

Thanks in part to the pioneering efforts of TIROS-1, and weather satellites that followed, today we have access to advanced warming of extreme events like hurricanes — a capability that has saved many lives.

“TIROS” stands for Television Infrared Observation Satellite Program. Here’s how NASA describes its mission:

The TIROS Program . . . was NASA’s first experimental step to determine if satellites could be useful in the study of the Earth. At that time, the effectiveness of satellite observations was still unproven. Since satellites were a new technology, the TIROS Program also tested various design issues for spacecraft: instruments, data and operational parameters. The goal was to improve satellite applications for Earth-bound decisions, such as “should we evacuate the coast because of the hurricane?”.

Here is the second image taken by Tiros-1 — 53 years ago today:

Tiros-1 transmitted a second weather image on April 2, 1960, 53 years ago today.

Head over to the CIMSS satellite blog for more details. The post there includes  spectacular comparison images from the SUOMI NPP satellite of the same general area: Maine and the Canadian Maritime provinces. One of them is a “visual image at night,” meaning it was shot under moonlight. You can see the sparkling lights of cities.