Filantropos e acadêmicos dizem que está na hora de um novo conjunto de ideias orientar a economia
O salário da maioria dos americanos está estagnado há décadas. A desigualdade aumentou acentuadamente. A globalização e a tecnologia enriqueceram alguns, mas também provocaram a perda de empregos e o empobrecimento de comunidades.
Esses problemas, segundo muitos economistas, são em parte subprodutos de políticas governamentais e práticas corporativas moldadas por um conjunto de ideias que defendiam o livre mercado, o livre comércio e um papel de não interferência do governo na economia. Seu rótulo mais comum é o “neoliberalismo”.
Um grupo de filantropos e acadêmicos diz que está na hora de um novo conjunto de ideias orientar a economia. Para pensar em alternativas, as fundações William and Flora Hewlett e Omidyar Network anunciaram nesta quarta-feira (16) que estão investindo mais de US$ 41 milhões (R$ 212 milhões) em pesquisas econômicas e políticas com esse objetivo.
“O neoliberalismo está morto, mas não criamos um substituto“, disse Larry Kramer, presidente da Fundação Hewlett.
Os destinatários iniciais das doações para criar programas de pesquisa são a Escola Kennedy da Universidade Harvard, a Universidade Howard, a Universidade Johns Hopkins, além do MIT (Instituto de Tecnologia de Massachusetts) e o Instituto Santa Fé.
Segundo Kramer, a Fundação Ford e a Open Society Foundations também se comprometeram a aderir à iniciativa e fazer doações ainda este ano para centros de pesquisa no exterior.
As universidades concordaram não só em fornecer um espaço para os centros de pesquisa, mas em reunir acadêmicos e estudantes de várias disciplinas, comunicar suas descobertas e arrecadar fundos para manter os programas em andamento.
A expectativa é de que outros financiadores e universidades façam o mesmo. “Nosso papel é fornecer fertilizante e água para cultivar algo diferente”, disse Kramer. “Achamos que esta é a próxima onda intelectual.”
O esforço, com amplo financiamento, se baseia na tese de que as ideias fornecem a estrutura para as políticas e os limites do debate público. A visão de mundo do livre mercado foi promovida com mais empenho nas décadas de 1960 e 1970 por um grupo de economistas da Universidade de Chicago, liderado por Milton Friedman, que ficou conhecida como Escola de Chicago.
Na década de 1980, o governo de Ronald Reagan, nos EUA, e o de Margaret Thatcher, na Grã-Bretanha, abraçaram com entusiasmo o modelo neoliberal. Foi também a mentalidade principal do governo Clinton para acordos de livre comércio e desregulamentação financeira. Isso também valeu para o governo Obama de modo geral, em áreas como comércio, resgate de bancos e fiscalização antitruste.
Não é tanto o caso do governo Biden. Jennifer Harris, que liderou o programa de economia e sociedade na Hewlett, onde começou o trabalho na nova iniciativa, juntou-se à equipe do Conselho Econômico Nacional do governo no ano passado.
Nos últimos anos, muitos economistas proeminentes questionaram a prudência de se deixar tantas realizações humanas ao sabor dos mercados. Os economistas estão pesquisando cada vez mais a desigualdade, e esse é um foco das universidades que recebem as bolsas.
“Reduzir a desigualdade deve ser uma meta do progresso econômico”, disse Dani Rodrik, economista da Escola Kennedy em Harvard e líder no projeto de reimaginação da economia. “Temos toda essa nova tecnologia, mas ela não abrange partes extensas da força de trabalho nem partes suficientes do país.”
Os beneficiários das doações são entusiastas qualificados do mercado. “Os mercados são ótimos, mas temos que superar essa noção de que ‘os mercados são autônomos, então deixe que o mercado resolva'”, disse David Autor, economista do trabalho no MIT. “Esse fatalismo é uma decisão.”
Autor é um dos líderes do programa do MIT para moldar o futuro do trabalho. “Estamos chamando isso de ‘moldagem’ porque é intervencionista”, disse ele.
O projeto do MIT pesquisará os desafios enfrentados por trabalhadores sem diploma universitário de quatro anos —quase dois terços da força de trabalho dos EUA— e medidas que podem melhorar seus empregos ou levá-los a ocupações mais bem remuneradas.
O grupo do MIT também vai explorar políticas e incentivos para orientar o desenvolvimento tecnológico de forma a aumentar a produtividade dos trabalhadores, em vez de substituí-los.
Cada um dos centros terá uma abordagem diferente. O programa de Howard examinará as desigualdades raciais e econômicas. O centro Johns Hopkins vai explorar a ascensão e disseminação do neoliberalismo e as lições aprendidas. E o Instituto Santa Fé desenvolverá novos modelos econômicos —atualizados com insights e dados da economia comportamental, estudos de inovação e a concorrência nos mercados digitais.
A Hewlett está contribuindo com US$ 35 milhões (R$ 181 milhões) em doações para as quatro universidades, e a Omidyar Network está fazendo uma de US$ 6,5 milhões (R$ 33,6 milhões) para o Santa Fe Institute.
A Fundação Hewlett, criada em 1966 por um cofundador da Hewlett-Packard e sua mulher, é uma das maiores entidades filantrópicas dos Estados Unidos. A Omidyar Network, criada em 2004 por Pierre Omidyar, fundador do eBay, e sua mulher, Pam, inclui uma fundação e um braço de investimento que apoia empreendimentos de impacto social com fins lucrativos.
Ambas as fundações são identificadas como de esquerda porque apoiam o trabalho em áreas como mudança climática, igualdade de gêneros e justiça econômica. Mas Mike Kubzansky, CEO da Omidyar Network, disse que os desafios econômicos de hoje superam as divisões partidárias.
“Acho que há um amplo consenso de que o conjunto tradicional de ideias econômicas já passou do prazo de validade”, disse.
Summary: Community structure, including relationships between and within groups, is foundational to our understanding of the world around us.
Community structure, including relationships between and within groups, is foundational to our understanding of the world around us. New research by mathematics and statistics professor Kenneth Berenhaut, along with former postdoctoral fellow Katherine Moore and graduate student Ryan Melvin, sheds new light on some fundamental statistical questions.
“When we encounter complex data in areas such as public health, economics or elsewhere, it can be valuable to address questions regarding the presence of discernable groups, and the inherent “cohesion” or glue that holds these groups together. In considering such concepts, socially, the terms “communities,” “networks” and “relationships” may come to mind,” said Berenhaut.
The research leverages abstracted social ideas of conflict, alignment, prominence and support, to tap into the mathematical interplay between distance and cohesiveness — the sort evident when, say, comparing urban and rural settings. This enables adaptations to varied local perspectives.
“For example, we considered psychological survey-based data reflecting differences and similarities in cultural values between regions around the world — in the U.S., China, India and the EU,” Berenhaut said. “We observed distinct cultural groups, with rich internal network structure, despite the analytical challenges caused by the fact that some cohesive groups (such as India and the EU) are far more culturally diverse than others. Mark Twain once referred to India as ‘the country of a hundred nations and a hundred tongues, of a thousand religions and two million gods.’ Regions (such as the Southeast and California in the U.S.) can be perceived as locally distinct, despite their relative similarity in a global context. It is these sorts of characteristics that we are attempting to detect and understand.”
The paper, “A social perspective on perceived distances reveals deep community structure,” published by PNAS (Proceedings of the National Academy of Sciences of the United States) can be found here.
“I am excited by the manner in which a social perspective, along with a probabilistic approach, can illuminate aspects of communities inherent in data from a variety of fields,” said Berenhaut. “The concept of data communities proposed in the paper is derived from and aligns with a shared human social perspective. The work crosses areas with connections to ideas in sociology, psychology, mathematics, physics, statistics and elsewhere.”
Leveraging our experiences and perspectives can lead to valuable mathematical and statistical insights.
Story Source:
Materials provided by Wake Forest University. Original written by Kim McGrath. Note: Content may be edited for style and length.
Journal Reference:
Kenneth S. Berenhaut, Katherine E. Moore, Ryan L. Melvin. A social perspective on perceived distances reveals deep community structure. Proceedings of the National Academy of Sciences, 2022; 119 (4): e2003634119 DOI: 10.1073/pnas.2003634119
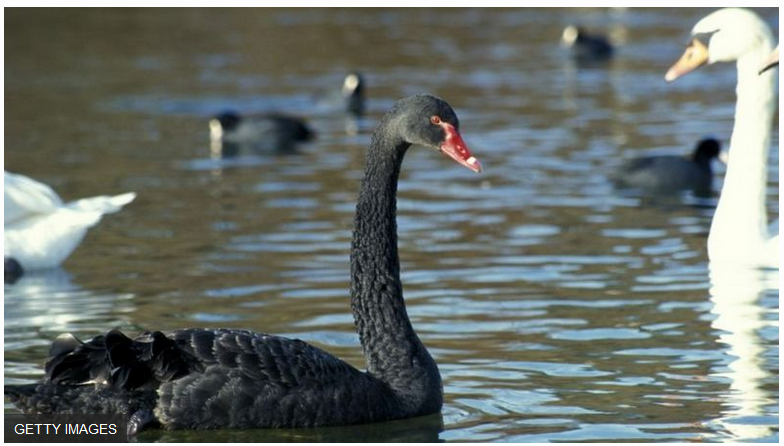
O que o surgimento da internet, os ataques de 11 de setembro de 2001 e a crise econômica de 2008 têm em comum?
Foram eventos extremamente raros e surpreendentes que tiveram um forte impacto na história.
Acontecimentos deste tipo costumam ser chamados de “cisnes negros”.
Alguns argumentam que a recente pandemia de covid-19 também pode ser considerada um deles, mas nem todo mundo concorda.
A “teoria do cisne negro” foi desenvolvida pelo professor, escritor e ex-operador da bolsa libanês-americano Nassim Taleb em 2007.
E possui três componentes, como o próprio Taleb explicou em um artigo no jornal americano The New York Times no mesmo ano:
– Em primeiro lugar, é algo atípico, já que está fora do âmbito das expectativas habituais, porque nada no passado pode apontar de forma convincente para sua possibilidade.
– Em segundo lugar, tem um impacto extremo.
– Em terceiro lugar, apesar de seu status atípico, a natureza humana nos faz inventar explicações para sua ocorrência após o fato em si, tornando-o explicável e previsível.
A tese de Taleb está geralmente associada à economia, mas se aplica a qualquer área.
E uma vez que as consequências costumam ser catastróficas, é importante aceitar que a ocorrência de um evento”cisne negro” é possível — e por isso é necessário ter um plano para lidar com o mesmo.
Em suma, o “cisne negro” representa uma metáfora para algo imprevisível e muito estranho, mas não impossível.
Por que são chamados assim?
No fim do século 17, navios europeus embarcaram na aventura de explorar a Austrália.
Em 1697, enquanto navegava nas águas de um rio desconhecido no sudoeste da Austrália Ocidental, o capitão holandês Willem de Vlamingh avistou vários cisnes negros, sendo possivelmente o primeiro europeu a observá-los.
Como consequência, Vlamingh deu ao rio o nome de Zwaanenrivier (Rio dos Cisnes, em holandês) por causa do grande número de cisnes negros que havia ali.
Tratava-se de um acontecimento inesperado e novo. Até aquele momento, a ciência só havia registrado cisnes brancos.
A primeira referência conhecida ao termo “cisne negro” associado ao significado de raridade vem de uma frase do poeta romano Décimo Júnio Juvenal (60-128).
Desesperado para encontrar uma esposa com todas as “qualidades certas” da época, ele escreveu em latim que esta mulher era rara avis in terris, nigroque simillima cygno (“uma ave rara nestas terras, como um cisne negro”), detalha o dicionário de Oxford.
Porque naquela época e até cerca de 1,6 mil anos depois, para os europeus, não existiam cisnes negros.
Prevendo os ‘cisnes negros’
Um grupo de cientistas da Universidade de Stanford, nos Estados Unidos, está trabalhando para prever o imprevisível.
Ou seja, para se antecipar aos “cisnes negros” — não às aves, mas aos estranhos eventos que acontecem na história.
Embora sua análise primária tenha sido baseada em três ambientes diferentes na natureza, o método computacional que eles criaram pode ser aplicado a qualquer área, incluindo economia e política.
“Ao analisar dados de longo prazo de três ecossistemas, pudemos demonstrar que as flutuações que ocorrem em diferentes espécies biológicas são estatisticamente iguais em diferentes ecossistemas”, afirmou Samuel Bray, assistente de pesquisa no laboratório de Bo Wang, professor de bioengenharia na Universidade de Stanford.
“Isso sugere que existem certos processos universais que podemos utilizar para prever esse tipo de comportamento extremo”, acrescentou Bray, conforme publicado no site da universidade.
Para desenvolver o método de previsão, os pesquisadores procuraram sistemas biológicos que vivenciaram eventos “cisne negro” e como foram os contextos em que ocorreram.
Eles se basearam então em ecossistemas monitorados de perto por muitos anos.
Os exemplos incluíram: um estudo de oito anos do plâncton do Mar Báltico com níveis de espécies medidos duas vezes por semana; medições de carbono de um bosque da Universidade de Harvard, nos EUA, que foram coletadas a cada 30 minutos desde 1991; e medições de cracas (mariscos), algas e mexilhões na costa da Nova Zelândia, feitas mensalmente por mais de 20 anos, detalha o estudo publicado na revista científica Plos Computational Biology.
Os pesquisadores aplicaram a estas bases de dados a teoria física por trás de avalanches e terremotos que, assim como os “cisnes negros”, mostram um comportamento extremo, repentino e de curto prazo.
A partir desta análise, os especialistas desenvolveram um método para prever eventos “cisne negro” que fosse flexível entre espécies e períodos de tempo e também capaz de trabalhar com dados muito menos detalhados e mais complexos.
Posteriormente, conseguiram prever com precisão eventos extremos que ocorreram nesses sistemas.
Até agora, “os métodos se baseavam no que vimos para prever o que pode acontecer no futuro, e é por isso que não costumam identificar os eventos ‘cisne negro'”, diz Wang.
Mas este novo mecanismo é diferente, segundo o professor de Stanford, “porque parte do pressuposto de que estamos vendo apenas parte do mundo”.
“Extrapola um pouco do que falta e ajuda enormemente em termos de previsão”, acrescenta.
Então, os “cisnes negros” poderiam ser detectados em outras áreas, como finanças ou economia?
“Aplicamos nosso método às flutuações do mercado de ações e funcionou muito bem”, disse Wang à BBC News Mundo, serviço de notícias em espanhol da BBC, por e-mail.
Os pesquisadores analisaram os índices Nasdaq, Dow Jones Industrial Average e S&P 500.
“Embora a principal tendência do mercado seja o crescimento exponencial de longo prazo, as flutuações em torno dessa tendência seguem as mesmas trajetórias e escalas médias que vimos nos sistemas ecológicos”, explica.
Mas “embora as semelhanças entre as variações na bolsa e ecológicas sejam interessantes, nosso método de previsão é mais útil nos casos em que os dados são escassos e as flutuações geralmente vão além dos registros históricos (o que não é o caso do mercado de ações)”, adverte Wang.
Por isso, temos que continuar atentos para saber se o próximo “cisne negro” vai nos pegar de surpresa… ou talvez não.
DOES ANYONE really understand what is going on in the world economy? The pandemic has made plenty of observers look clueless. Few predicted $80 oil, let alone fleets of container ships waiting outside Californian and Chinese ports. As covid-19 let rip in 2020, forecasters overestimated how high unemployment would be by the end of the year. Today prices are rising faster than expected and nobody is sure if inflation and wages will spiral upward. For all their equations and theories, economists are often fumbling in the dark, with too little information to pick the policies that would maximise jobs and growth.
Yet, as we report this week, the age of bewilderment is starting to give way to greater enlightenment. The world is on the brink of a real-time revolution in economics, as the quality and timeliness of information are transformed. Big firms from Amazon to Netflix already use instant data to monitor grocery deliveries and how many people are glued to “Squid Game”. The pandemic has led governments and central banks to experiment, from monitoring restaurant bookings to tracking card payments. The results are still rudimentary, but as digital devices, sensors and fast payments become ubiquitous, the ability to observe the economy accurately and speedily will improve. That holds open the promise of better public-sector decision-making—as well as the temptation for governments to meddle.
The desire for better economic data is hardly new. America’s GNP estimates date to 1934 and initially came with a 13-month time lag. In the 1950s a young Alan Greenspan monitored freight-car traffic to arrive at early estimates of steel production. Ever since Walmart pioneered supply-chain management in the 1980s private-sector bosses have seen timely data as a source of competitive advantage. But the public sector has been slow to reform how it works. The official figures that economists track—think of GDP or employment—come with lags of weeks or months and are often revised dramatically. Productivity takes years to calculate accurately. It is only a slight exaggeration to say that central banks are flying blind.
Bad and late data can lead to policy errors that cost millions of jobs and trillions of dollars in lost output. The financial crisis would have been a lot less harmful had the Federal Reserve cut interest rates to near zero in December 2007, when America entered recession, rather than in December 2008, when economists at last saw it in the numbers. Patchy data about a vast informal economy and rotten banks have made it harder for India’s policymakers to end their country’s lost decade of low growth. The European Central Bank wrongly raised interest rates in 2011 amid a temporary burst of inflation, sending the euro area back into recession. The Bank of England may be about to make a similar mistake today.
The pandemic has, however, become a catalyst for change. Without the time to wait for official surveys to reveal the effects of the virus or lockdowns, governments and central banks have experimented, tracking mobile phones, contactless payments and the real-time use of aircraft engines. Instead of locking themselves in their studies for years writing the next “General Theory”, today’s star economists, such as Raj Chetty at Harvard University, run well-staffed labs that crunch numbers. Firms such as JPMorgan Chase have opened up treasure chests of data on bank balances and credit-card bills, helping reveal whether people are spending cash or hoarding it.
These trends will intensify as technology permeates the economy. A larger share of spending is shifting online and transactions are being processed faster. Real-time payments grew by 41% in 2020, according to McKinsey, a consultancy (India registered 25.6bn such transactions). More machines and objects are being fitted with sensors, including individual shipping containers that could make sense of supply-chain blockages. Govcoins, or central-bank digital currencies (CBDCs), which China is already piloting and over 50 other countries are considering, might soon provide a goldmine of real-time detail about how the economy works.
Timely data would cut the risk of policy cock-ups—it would be easier to judge, say, if a dip in activity was becoming a slump. And the levers governments can pull will improve, too. Central bankers reckon it takes 18 months or more for a change in interest rates to take full effect. But Hong Kong is trying out cash handouts in digital wallets that expire if they are not spent quickly. CBDCs might allow interest rates to fall deeply negative. Good data during crises could let support be precisely targeted; imagine loans only for firms with robust balance-sheets but a temporary liquidity problem. Instead of wasteful universal welfare payments made through social-security bureaucracies, the poor could enjoy instant income top-ups if they lost their job, paid into digital wallets without any paperwork.
The real-time revolution promises to make economic decisions more accurate, transparent and rules-based. But it also brings dangers. New indicators may be misinterpreted: is a global recession starting or is Uber just losing market share? They are not as representative or free from bias as the painstaking surveys by statistical agencies. Big firms could hoard data, giving them an undue advantage. Private firms such as Facebook, which launched a digital wallet this week, may one day have more insight into consumer spending than the Fed does.
Know thyself
The biggest danger is hubris. With a panopticon of the economy, it will be tempting for politicians and officials to imagine they can see far into the future, or to mould society according to their preferences and favour particular groups. This is the dream of the Chinese Communist Party, which seeks to engage in a form of digital central planning.
In fact no amount of data can reliably predict the future. Unfathomably complex, dynamic economies rely not on Big Brother but on the spontaneous behaviour of millions of independent firms and consumers. Instant economics isn’t about clairvoyance or omniscience. Instead its promise is prosaic but transformative: better, timelier and more rational decision-making. ■
AS PART OF his plan for socialism in the early 1970s, Salvador Allende created Project Cybersyn. The Chilean president’s idea was to offer bureaucrats unprecedented insight into the country’s economy. Managers would feed information from factories and fields into a central database. In an operations room bureaucrats could see if production was rising in the metals sector but falling on farms, or what was happening to wages in mining. They would quickly be able to analyse the impact of a tweak to regulations or production quotas.
Cybersyn never got off the ground. But something curiously similar has emerged in Salina, a small city in Kansas. Salina311, a local paper, has started publishing a “community dashboard” for the area, with rapid-fire data on local retail prices, the number of job vacancies and more—in effect, an electrocardiogram of the economy.
What is true in Salina is true for a growing number of national governments. When the pandemic started last year bureaucrats began studying dashboards of “high-frequency” data, such as daily airport passengers and hour-by-hour credit-card-spending. In recent weeks they have turned to new high-frequency sources, to get a better sense of where labour shortages are worst or to estimate which commodity price is next in line to soar. Economists have seized on these new data sets, producing a research boom (see chart 1). In the process, they are influencing policy as never before.
This fast-paced economics involves three big changes. First, it draws on data that are not only abundant but also directly relevant to real-world problems. When policymakers are trying to understand what lockdowns do to leisure spending they look at live restaurant reservations; when they want to get a handle on supply-chain bottlenecks they look at day-by-day movements of ships. Troves of timely, granular data are to economics what the microscope was to biology, opening a new way of looking at the world.
Second, the economists using the data are keener on influencing public policy. More of them do quick-and-dirty research in response to new policies. Academics have flocked to Twitter to engage in debate.
And, third, this new type of economics involves little theory. Practitioners claim to let the information speak for itself. Raj Chetty, a Harvard professor and one of the pioneers, has suggested that controversies between economists should be little different from disagreements among doctors about whether coffee is bad for you: a matter purely of evidence. All this is causing controversy among dismal scientists, not least because some, such as Mr Chetty, have done better from the shift than others: a few superstars dominate the field.
Their emerging discipline might be called “third wave” economics. The first wave emerged with Adam Smith and the “Wealth of Nations”, published in 1776. Economics mainly involved books or papers written by one person, focusing on some big theoretical question. Smith sought to tear down the monopolistic habits of 18th-century Europe. In the 20th century John Maynard Keynes wanted people to think differently about the government’s role in managing the economic cycle. Milton Friedman aimed to eliminate many of the responsibilities that politicians, following Keynes’s ideas, had arrogated to themselves.
All three men had a big impact on policies—as late as 1850 Smith was quoted 30 times in Parliament—but in a diffuse way. Data were scarce. Even by the 1970s more than half of economics papers focused on theory alone, suggests a study published in 2012 by Daniel Hamermesh, an economist.
That changed with the second wave of economics. By 2011 purely theoretical papers accounted for only 19% of publications. The growth of official statistics gave wonks more data to work with. More powerful computers made it easier to spot patterns and ascribe causality (this year’s Nobel prize was awarded for the practice of identifying cause and effect). The average number of authors per paper rose, as the complexity of the analysis increased (see chart 2). Economists had greater involvement in policy: rich-world governments began using cost-benefit analysis for infrastructure decisions from the 1950s.
Second-wave economics nonetheless remained constrained by data. Most national statistics are published with lags of months or years. “The traditional government statistics weren’t really all that helpful—by the time they came out, the data were stale,” says Michael Faulkender, an assistant treasury secretary in Washington at the start of the pandemic. The quality of official local economic data is mixed, at best; they do a poor job of covering the housing market and consumer spending. National statistics came into being at a time when the average economy looked more industrial, and less service-based, than it does now. The Standard Industrial Classification, introduced in 1937-38 and still in use with updates, divides manufacturing into 24 subsections, but the entire financial industry into just three.
The mists of time
Especially in times of rapid change, policymakers have operated in a fog. “If you look at the data right now…we are not in what would normally be characterised as a recession,” argued Edward Lazear, then chairman of the White House Council of Economic Advisers, in May 2008. Five months later, after Lehman Brothers had collapsed, the IMF noted that America was “not necessarily” heading for a deep recession. In fact America had entered a recession in December 2007. In 2007-09 there was no surge in economics publications. Economists’ recommendations for policy were mostly based on judgment, theory and a cursory reading of national statistics.
The gap between official data and what is happening in the real economy can still be glaring. Walk around a Walmart in Kansas and many items, from pet food to bottled water, are in short supply. Yet some national statistics fail to show such problems. Dean Baker of the Centre for Economic and Policy Research, using official data, points out that American real inventories, excluding cars and farm products, are barely lower than before the pandemic.
There were hints of an economics third wave before the pandemic. Some economists were finding new, extremely detailed streams of data, such as anonymised tax records and location information from mobile phones. The analysis of these giant data sets requires the creation of what are in effect industrial labs, teams of economists who clean and probe the numbers. Susan Athey, a trailblazer in applying modern computational methods in economics, has 20 or so non-faculty researchers at her Stanford lab (Mr Chetty’s team boasts similar numbers). Of the 20 economists with the most cited new work during the pandemic, three run industrial labs.
More data sprouted from firms. Visa and Square record spending patterns, Apple and Google track movements, and security companies know when people go in and out of buildings. “Computers are in the middle of every economic arrangement, so naturally things are recorded,” says Jon Levin of Stanford’s Graduate School of Business. Jamie Dimon, the boss of JPMorgan Chase, a bank, is an unlikely hero of the emergence of third-wave economics. In 2015 he helped set up an institute at his bank which tapped into data from its network to analyse questions about consumer finances and small businesses.
The Brexit referendum of June 2016 was the first big event when real-time data were put to the test. The British government and investors needed to get a sense of this unusual shock long before Britain’s official GDP numbers came out. They scraped web pages for telltale signs such as restaurant reservations and the number of supermarkets offering discounts—and concluded, correctly, that though the economy was slowing, it was far from the catastrophe that many forecasters had predicted.
Real-time data might have remained a niche pursuit for longer were it not for the pandemic. Chinese firms have long produced granular high-frequency data on everything from cinema visits to the number of glasses of beer that people are drinking daily. Beer-and-movie statistics are a useful cross-check against sometimes dodgy official figures. China-watchers turned to them in January 2020, when lockdowns began in Hubei province. The numbers showed that the world’s second-largest economy was heading for a slump. And they made it clear to economists elsewhere how useful such data could be.
Vast and fast
In the early days of the pandemic Google started releasing anonymised data on people’s physical movements; this has helped researchers produce a day-by-day measure of the severity of lockdowns (see chart 3). OpenTable, a booking platform, started publishing daily information on restaurant reservations. America’s Census Bureau quickly introduced a weekly survey of households, asking them questions ranging from their employment status to whether they could afford to pay the rent.
In May 2020 Jose Maria Barrero, Nick Bloom and Steven Davis, three economists, began a monthly survey of American business practices and work habits. Working-age Americans are paid to answer questions on how often they plan to visit the office, say, or how they would prefer to greet a work colleague. “People often complete a survey during their lunch break,” says Mr Bloom, of Stanford University. “They sit there with a sandwich, answer some questions, and that pays for their lunch.”
Demand for research to understand a confusing economic situation jumped. The first analysis of America’s $600 weekly boost to unemployment insurance, implemented in March 2020, was published in weeks. The British government knew by October 2020 that a scheme to subsidise restaurant attendance in August 2020 had probably boosted covid infections. Many apparently self-evident things about the pandemic—that the economy collapsed in March 2020, that the poor have suffered more than the rich, or that the shift to working from home is turning out better than expected—only seem obvious because of rapid-fire economic research.
It is harder to quantify the policy impact. Some economists scoff at the notion that their research has influenced politicians’ pandemic response. Many studies using real-time data suggested that the Paycheck Protection Programme, an effort to channel money to American small firms, was doing less good than hoped. Yet small-business lobbyists ensured that politicians did not get rid of it for months. Tyler Cowen, of George Mason University, points out that the most significant contribution of economists during the pandemic involved recommending early pledges to buy vaccines—based on older research, not real-time data.
Still, Mr Faulkender says that the special support for restaurants that was included in America’s stimulus was influenced by a weak recovery in the industry seen in the OpenTable data. Research by Mr Chetty in early 2021 found that stimulus cheques sent in December boosted spending by lower-income households, but not much for richer households. He claims this informed the decision to place stronger income limits on the stimulus cheques sent in March.
Shaping the economic conversation
As for the Federal Reserve, in May 2020 the Dallas and New York regional Feds and James Stock, a Harvard economist, created an activity index using data from SafeGraph, a data provider that tracks mobility using mobile-phone pings. The St Louis Fed used data from Homebase to track employment numbers daily. Both showed shortfalls of economic activity in advance of official data. This led the Fed to communicate its doveish policy stance faster.
Speedy data also helped frame debate. Everyone realised the world was in a deep recession much sooner than they had in 2007-09. In the IMF’s overviews of the global economy in 2009, 40% of the papers cited had been published in 2008-09. In the overview published in October 2020, by contrast, over half the citations were for papers published that year.
The third wave of economics has been better for some practitioners than others. As lockdowns began, many male economists found themselves at home with no teaching responsibilities and more time to do research. Female ones often picked up the slack of child care. A paper in Covid Economics, a rapid-fire journal, finds that female authors accounted for 12% of economics working-paper submissions during the pandemic, compared with 20% before. Economists lucky enough to have researched topics before the pandemic which became hot, from home-working to welfare policy, were suddenly in demand.
There are also deeper shifts in the value placed on different sorts of research. The Economist has examined rankings of economists from IDEAS RePEC, a database of research, and citation data from Google Scholar. We divided economists into three groups: “lone wolves” (who publish with less than one unique co-author per paper on average); “collaborators” (those who tend to work with more than one unique co-author per paper, usually two to four people); and “lab leaders” (researchers who run a large team of dedicated assistants). We then looked at the top ten economists for each as measured by RePEC author rankings for the past ten years.
Collaborators performed far ahead of the other two groups during the pandemic (see chart 4). Lone wolves did worst: working with large data sets benefits from a division of labour. Why collaborators did better than lab leaders is less clear. They may have been more nimble in working with those best suited for the problems at hand; lab leaders are stuck with a fixed group of co-authors and assistants.
The most popular types of research highlight another aspect of the third wave: its usefulness for business. Scott Baker, another economist, and Messrs Bloom and Davis—three of the top four authors during the pandemic compared with the year before—are all “collaborators” and use daily newspaper data to study markets. Their uncertainty index has been used by hedge funds to understand the drivers of asset prices. The research by Messrs Bloom and Davis on working from home has also gained attention from businesses seeking insight on the transition to remote work.
But does it work in theory?
Not everyone likes where the discipline is going. When economists say that their fellows are turning into data scientists, it is not meant as a compliment. A kinder interpretation is that the shift to data-heavy work is correcting a historical imbalance. “The most important problem with macro over the past few decades has been that it has been too theoretical,” says Jón Steinsson of the University of California, Berkeley, in an essay published in July. A better balance with data improves theory. Half of the recent Nobel prize went for the application of new empirical methods to labour economics; the other half was for the statistical theory around such methods.
Some critics question the quality of many real-time sources. High-frequency data are less accurate at estimating levels (for example, the total value of GDP) than they are at estimating changes, and in particular turning-points (such as when growth turns into recession). In a recent review of real-time indicators Samuel Tombs of Pantheon Macroeconomics, a consultancy, pointed out that OpenTable data tended to exaggerate the rebound in restaurant attendance last year.
Others have worries about the new incentives facing economists. Researchers now race to post a working paper with America’s National Bureau of Economic Research in order to stake their claim to an area of study or to influence policymakers. The downside is that consumers of fast-food academic research often treat it as if it is as rigorous as the slow-cooked sort—papers which comply with the old-fashioned publication process involving endless seminars and peer review. A number of papers using high-frequency data which generated lots of clicks, including one which claimed that a motorcycle rally in South Dakota had caused a spike in covid cases, have since been called into question.
Whatever the concerns, the pandemic has given economists a new lease of life. During the Chilean coup of 1973 members of the armed forces broke into Cybersyn’s operations room and smashed up the slides of graphs—not only because it was Allende’s creation, but because the idea of an electrocardiogram of the economy just seemed a bit weird. Third-wave economics is still unusual, but ever less odd. ■
A new paper explores how the opinions of an electorate may be reflected in a mathematical model ‘inspired by models of simple magnetic systems’
Date: October 8, 2021
Source: University at Buffalo
Summary: A study leverages concepts from physics to model how campaign strategies influence the opinions of an electorate in a two-party system.
A study in the journal Physica A leverages concepts from physics to model how campaign strategies influence the opinions of an electorate in a two-party system.
Researchers created a numerical model that describes how external influences, modeled as a random field, shift the views of potential voters as they interact with each other in different political environments.
The model accounts for the behavior of conformists (people whose views align with the views of the majority in a social network); contrarians (people whose views oppose the views of the majority); and inflexibles (people who will not change their opinions).
“The interplay between these behaviors allows us to create electorates with diverse behaviors interacting in environments with different levels of dominance by political parties,” says first author Mukesh Tiwari, PhD, associate professor at the Dhirubhai Ambani Institute of Information and Communication Technology.
“We are able to model the behavior and conflicts of democracies, and capture different types of behavior that we see in elections,” says senior author Surajit Sen, PhD, professor of physics in the University at Buffalo College of Arts and Sciences.
Sen and Tiwari conducted the study with Xiguang Yang, a former UB physics student. Jacob Neiheisel, PhD, associate professor of political science at UB, provided feedback to the team, but was not an author of the research. The study was published online in Physica A in July and will appear in the journal’s Nov. 15 volume.
The model described in the paper has broad similarities to the random field Ising model, and “is inspired by models of simple magnetic systems,” Sen says.
The team used this model to explore a variety of scenarios involving different types of political environments and electorates.
Among key findings, as the authors write in the abstract: “In an electorate with only conformist agents, short-duration high-impact campaigns are highly effective. … In electorates with both conformist and contrarian agents and varying level(s) of dominance due to local factors, short-term campaigns are effective only in the case of fragile dominance of a single party. Strong local dominance is relatively difficult to influence and long-term campaigns with strategies aimed to impact local level politics are seen to be more effective.”
“I think it’s exciting that physicists are thinking about social dynamics. I love the big tent,” Neiheisel says, noting that one advantage of modeling is that it could enable researchers to explore how opinions might change over many election cycles — the type of longitudinal data that’s very difficult to collect.
Mathematical modeling has some limitations: “The real world is messy, and I think we should embrace that to the extent that we can, and models don’t capture all of this messiness,” Neiheisel says.
But Neiheisel was excited when the physicists approached him to talk about the new paper. He says the model provides “an interesting window” into processes associated with opinion dynamics and campaign effects, accurately capturing a number of effects in a “neat way.”
“The complex dynamics of strongly interacting, nonlinear and disordered systems have been a topic of interest for a long time,” Tiwari says. “There is a lot of merit in studying social systems through mathematical and computational models. These models provide insight into short- and long-term behavior. However, such endeavors can only be successful when social scientists and physicists come together to collaborate.”
Journal Reference:
Mukesh Tiwari, Xiguang Yang, Surajit Sen. Modeling the nonlinear effects of opinion kinematics in elections: A simple Ising model with random field based study. Physica A: Statistical Mechanics and its Applications, 2021; 582: 126287 DOI: 10.1016/j.physa.2021.126287


Você precisa fazer login para comentar.