Arquivo da tag: Big data

6 Things You Need to Know About Climate Change Now (Columbia Magazine)

magazine.columbia.edu

With global warming no longer just a threat but a full-blown crisis, Columbia experts are on the frontlines, documenting the dangers and developing solutions.

By David J. Craig | Winter 2021-22

David Swanson / Reuters

1. More scientists are investigating ways to help people adapt

Over the past half century, thousands of scientists around the world have dedicated their careers to documenting the link between climate change and human activity. A remarkable amount of this work has been done at Columbia’s Lamont-Doherty Earth Observatory, in Palisades, New York. Indeed, one of the founders of modern climate science, the late Columbia geochemist Wally Broecker ’53CC, ’58GSAS, popularized the term “global warming” and first alerted the broader scientific community to the emerging climate crisis in a landmark 1975 paper. He and other Columbia researchers then set about demonstrating that rising global temperatures could not be explained by the earth’s natural long-term climate cycles. For evidence, they relied heavily on Columbia’s world-class collections of tree-ring samples and deep-sea sediment cores, which together provide a unique window into the earth’s climate history.

Today, experts say, the field of climate science is in transition. Having settled the question of whether humans are causing climate change — the evidence is “unequivocal,” according to the UN’s Intergovernmental Panel on Climate Change (IPCC) — many scientists have been branching out into new areas, investigating the myriad ways that global warming is affecting our lives. Columbia scholars from fields as diverse as public health, agriculture, economics, law, political science, urban planning, finance, and engineering are now teaming up with climate scientists to learn how communities can adapt to the immense challenges they are likely to confront.

The University is taking bold steps to support such interdisciplinary thinking. Its new Columbia Climate School, established last year, is designed to serve as a hub for research and education on climate sustainability. Here a new generation of students will be trained to find creative solutions to the climate crisis. Its scholars are asking questions such as: How can communities best protect themselves from rising sea levels and intensifying storm surges, droughts, and heat waves? When extreme weather occurs, what segments of society are most vulnerable? And what types of public policies and ethical principles are needed to ensure fair and equitable adaptation strategies? At the same time, Columbia engineers, physicists, chemists, data scientists, and others are working with entrepreneurs to develop the new technologies that are urgently needed to scale up renewable-energy systems and curb emissions.

“The challenges that we’re facing with climate change are so huge, and so incredibly complex, that we need to bring people together from across the entire University to tackle them,” says Alex Halliday, the founding dean of the Columbia Climate School and the director of the Earth Institute. “Success will mean bringing the resources, knowledge, and capacity of Columbia to the rest of the world and guiding society toward a more sustainable future.”

For climate scientists who have been at the forefront of efforts to document the effects of fossil-fuel emissions on our planet, the shift toward helping people adapt to climate change presents new scientific challenges, as well as the opportunity to translate years of basic research into practical, real-world solutions.

“A lot of climate research has traditionally looked at how the earth’s climate system operates at a global scale and predicted how a given amount of greenhouse-gas emissions will affect global temperatures,” says Adam Sobel, a Columbia applied physicist, mathematician, and climate scientist. “The more urgent questions we face now involve how climate hazards vary across the planet, at local or regional scales, and how those variations translate into specific risks to human society. We also need to learn to communicate climate risks in ways that can facilitate actions to reduce them. This is where climate scientists need to focus more of our energy now, if we’re to maximize the social value of our work.”

A firefighter battles the Caldor Fire in Grizzly Flats, California in 2021
A firefighter battles the Caldor Fire in Grizzly Flats, California, last summer. (Fred Greaves / Reuters)
2. Big data will enable us to predict extreme weather

Just a few years ago, scientists couldn’t say with any confidence how climate change was affecting storms, floods, droughts, and other extreme weather around the world. But now, armed with unprecedented amounts of real-time and historical weather data, powerful new supercomputers, and a rapidly evolving understanding of how different parts of our climate system interact, researchers are routinely spotting the fingerprints of global warming on our weather.

“Of course, no individual weather event can be attributed solely to climate change, because weather systems are highly dynamic and subject to natural variability,” says Sobel, who studies global warming’s impact on extreme weather. “But data analysis clearly shows that global warming is tilting the scales of nature in a way that is increasing both the frequency and intensity of certain types of events, including heat waves, droughts, and floods.”

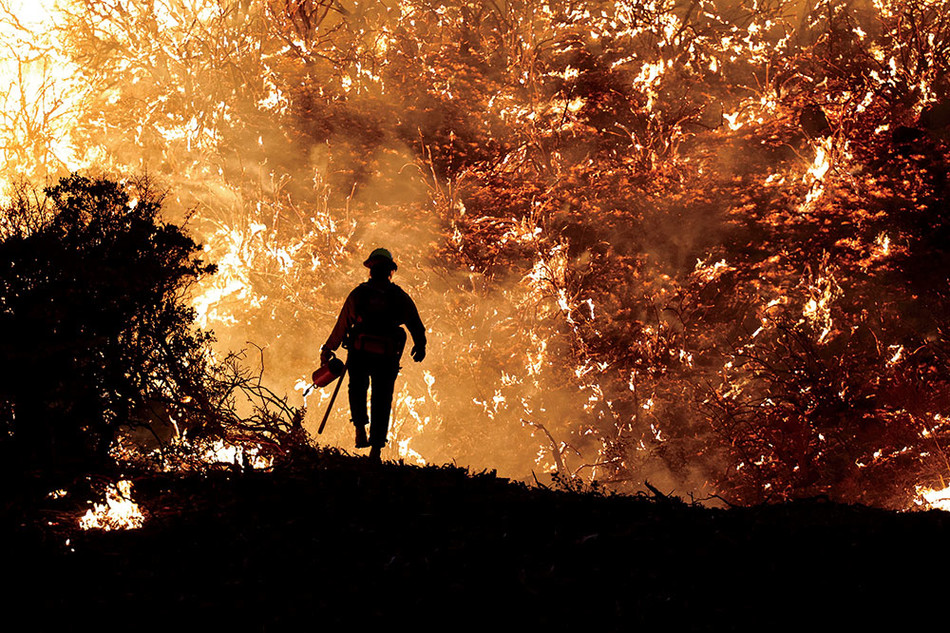
According to the World Meteorological Organization, the total number of major weather-related disasters to hit the world annually has increased five-fold since the 1970s. In 2021, the US alone endured eighteen weather-related disasters that caused at least $1 billion in damages. Those included Hurricanes Ida and Nicholas; tropical storms Fred and Elsa; a series of thunderstorms that devastated broad swaths of the Midwest; floods that overwhelmed the coasts of Texas and Louisiana; and a patchwork of wildfires that destroyed parts of California, Oregon, Washington, Idaho, Montana, and Arizona. In 2020, twenty-two $1 billion events struck this country — the most ever.

“The pace and magnitude of the weather disasters we’ve seen over the past couple of years are just bonkers,” says Sobel, who studies the atmospheric dynamics behind hurricanes. (He notes that while hurricanes are growing stronger as a result of climate change, scientists are not yet sure if they are becoming more common.) “Everybody I know who studies this stuff is absolutely stunned by it. When non-scientists ask me what I think about the weather these days, I say, ‘If it makes you worried for the future, it should, because the long-term trend is terrifying.’”

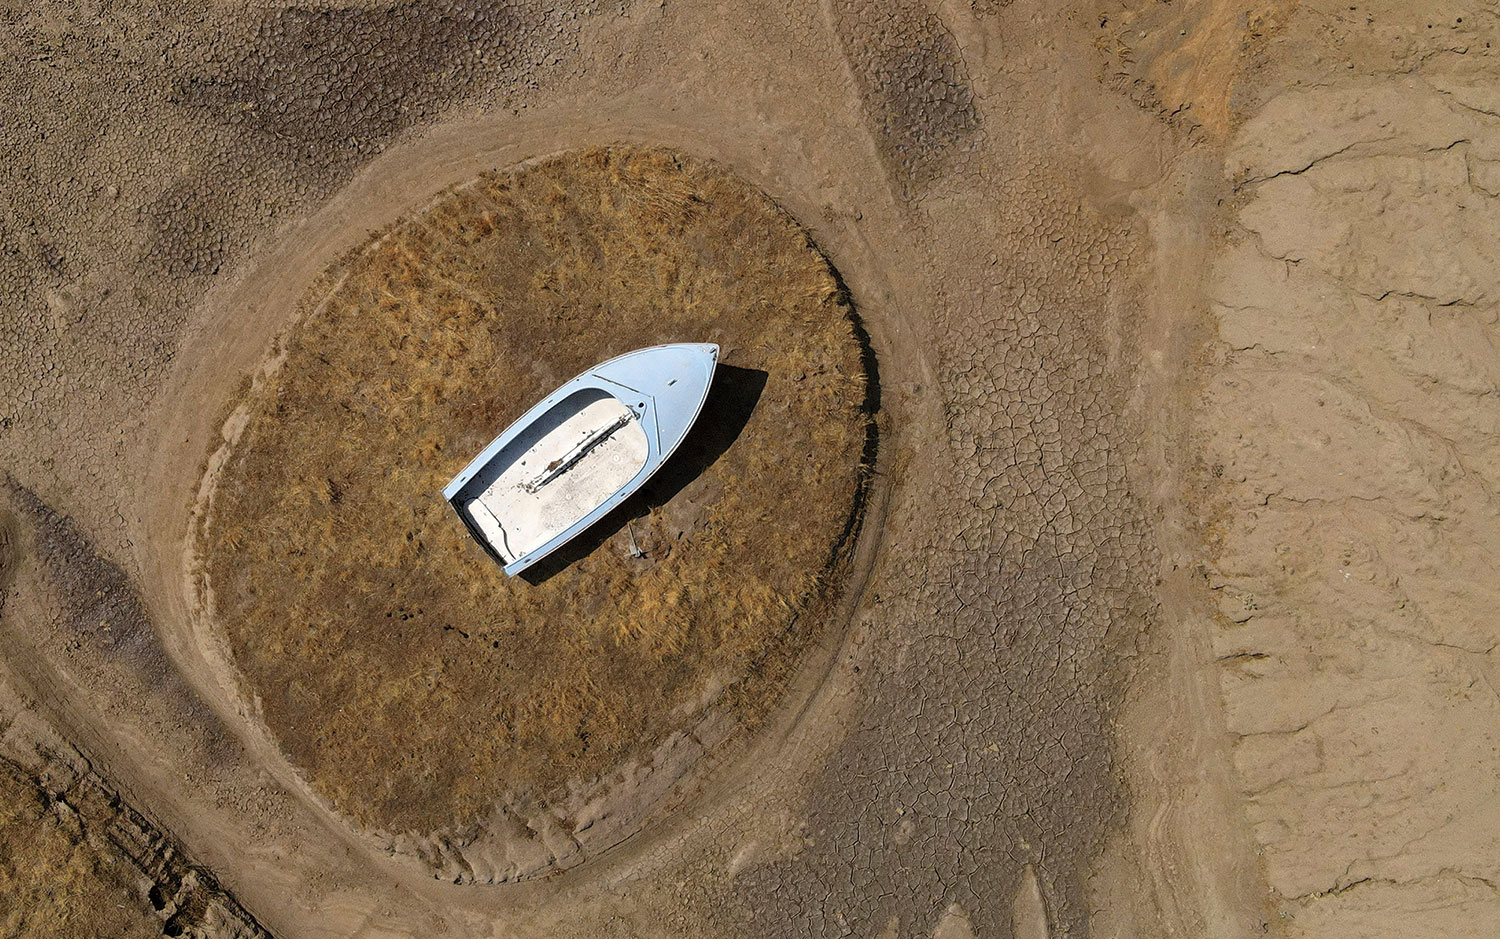
The increasing ferocity of our weather, scientists say, is partly attributable to the fact that warmer air can hold more moisture. This means that more water is evaporating off oceans, lakes, and rivers and accumulating in the sky, resulting in heavier rainstorms. And since hot air also wicks moisture out of soil and vegetation, regions that tend to receive less rainfall, like the American West, North Africa, the Middle East, and Central Asia, are increasingly prone to drought and all its attendant risks. “Climate change is generally making wet areas wetter and dry regions drier,” Sobel says.

Rescue workers helping a flood victim in China’s Henan Province in July 2021
Flooding killed at least three hundred people in China’s Henan Province in July. (Cai Yang / Xinhua via Getty Images)

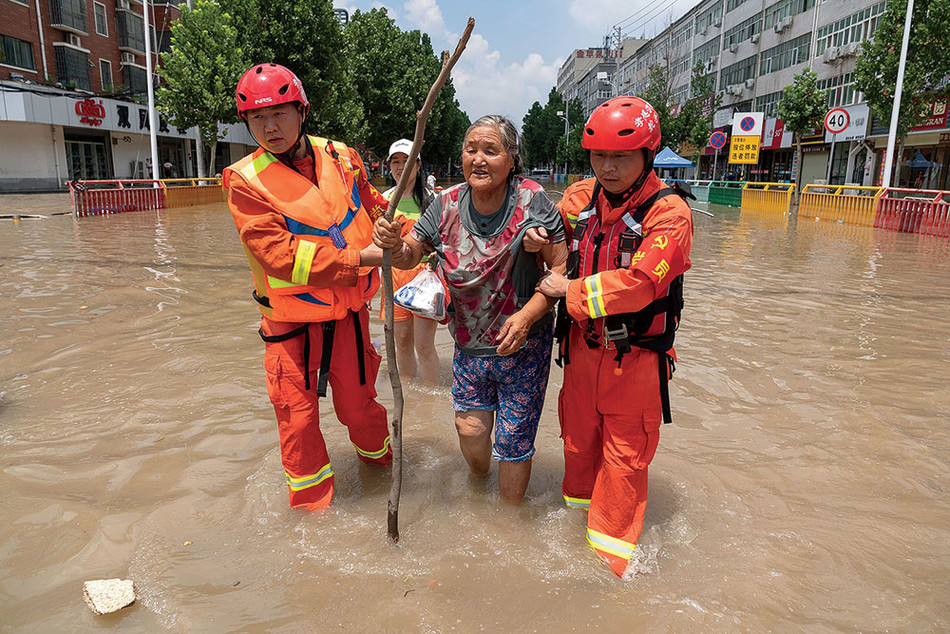
But global warming is also altering the earth’s climate system in more profound ways. Columbia glaciologist Marco Tedesco, among others, has found evidence that rising temperatures in the Arctic are weakening the North Atlantic jet stream, a band of westerly winds that influence much of the Northern Hemisphere’s weather. These winds are produced when cold air from the Arctic clashes with warm air coming up from the tropics. But because the Arctic is warming much faster than the rest of the world, the temperature differential between these air flows is diminishing and causing the jet stream to slow down and follow a more wobbly path. As a result, scientists have discovered, storm systems and pockets of hot or cold air that would ordinarily be pushed along quickly by the jet stream are now sometimes hovering over particular locations for days, amplifying their impact. Experts say that the jet stream’s new snail-like pace may explain why a heavy rainstorm parked itself over Zhengzhou, China, for three days last July, dumping an entire year’s worth of precipitation, and why a heat wave that same month brought 120-degree temperatures and killed an estimated 1,400 people in the northwestern US and western Canada.

Many Columbia scientists are pursuing research projects aimed at helping communities prepare for floods, droughts, heat waves, and other threats. Sobel and his colleagues, for example, have been using their knowledge of hurricane dynamics to develop an open-source computer-based risk-assessment model that could help policymakers in coastal cities from New Orleans to Mumbai assess their vulnerability to cyclones as sea levels rise and storms grow stronger. “The goal is to create analytic tools that will reveal how much wind and flood damage would likely occur under different future climate scenarios, as well as the human and economic toll,” says Sobel, whose team has sought input from public-health researchers, urban planners, disaster-management specialists, and civil engineers and is currently collaborating with insurance companies as well as the World Bank, the International Red Cross, and the UN Capital Development Fund. “Few coastal cities have high-quality information of this type, which is necessary for making rational adaptation decisions.”

Radley Horton ’07GSAS, another Columbia climatologist who studies weather extremes; Christian Braneon, a Columbia civil engineer and climate scientist; and Kim Knowlton ’05PH and Thomas Matte, Columbia public-health researchers, are members of the New York City Panel on Climate Change, a scientific advisory body that is helping local officials prepare for increased flooding, temperature spikes, and other climate hazards. New York City has acted decisively to mitigate and adapt to climate change, in part by drawing on the expertise of scientists from Columbia and other local institutions, and its city council recently passed a law requiring municipal agencies to develop a comprehensive long-term plan to protect all neighborhoods against climate threats. The legislation encourages the use of natural measures, like wetland restoration and expansion, to defend against rising sea levels. “There’s a growing emphasis on attending to issues of racial justice as the city develops its adaptation strategies,” says Horton. “In part, that means identifying communities that are most vulnerable to climate impacts because of where they’re located or because they lack resources. We want to make sure that everybody is a part of the resilience conversation and has input about what their neighborhoods need.”

Horton is also conducting basic research that he hopes will inform the development of more geographically targeted climate models. For example, in a series of recent papers on the atmospheric and geographic factors that influence heat waves, he and his team discovered that warm regions located near large bodies of water have become susceptible to heat waves of surprising intensity, accompanied by dangerous humidity. His team has previously shown that in some notoriously hot parts of the world — like northern India, Bangladesh, and the Persian Gulf — the cumulative physiological impact of heat and humidity can approach the upper limits of human tolerance. “We’re talking about conditions in which a perfectly healthy person could actually die of the heat, simply by being outside for several hours, even if they’re resting and drinking plenty of water,” says Horton, explaining that when it is extremely humid, the body loses its ability to sufficiently perspire, which is how it cools itself. Now his team suspects that similarly perilous conditions could in the foreseeable future affect people who live near the Mediterranean, the Black Sea, the Caspian Sea, or even the Great Lakes. “Conditions in these places probably won’t be quite as dangerous as what we’re seeing now in South Asia or the Middle East, but people who are old, sick, or working outside will certainly be at far greater risk than they are today,” Horton says. “And communities will be unprepared, which increases the danger.”

How much worse could the weather get? Over the long term, that will depend on us and how decisively we act to reduce our fossil-fuel emissions. But conditions are likely to continue to deteriorate over the next two to three decades no matter what we do, since the greenhouse gases that we have already added to the atmosphere will take years to dissipate. And the latest IPCC report states that every additional increment of warming will have a larger, more destabilizing impact. Of particular concern, the report cautions, is that in the coming years we are bound to experience many more “compound events,” such as when heat waves and droughts combine to fuel forest fires, or when coastal communities get hit by tropical storms and flooding rivers simultaneously.

“A lot of the extreme weather events that we’ve been experiencing lately are so different from anything we’ve seen that nobody saw them coming,” says Horton, who points out that climate models, which remain our best tool for projecting future climate risks, must constantly be updated with new data as real-world conditions change. “What’s happening now is that the conditions are evolving so rapidly that we’re having to work faster, with larger and more detailed data sets, to keep pace.”

Soybeans
Soybean yields in many parts of the world are expected to drop as temperatures rise. (Rory Doyle / Bloomberg via Getty Images)
3. The world’s food supply is under threat

“A warmer world could also be a hungry one, even in the rich countries,” writes the Columbia environmental economist Geoffrey Heal in his latest book, Endangered Economies: How the Neglect of Nature Threatens Our Prosperity. “A small temperature rise and a small increase in CO2 concentrations may be good for crops, but beyond a point that we will reach quickly, the productivity of our present crops will drop, possibly sharply.”

Indeed, a number of studies, including several by Columbia scientists, have found that staple crops like corn, rice, wheat, and soybeans are becoming more difficult to cultivate as the planet warms. Wolfram Schlenker, a Columbia economist who studies the impact of climate change on agriculture, has found that corn and soybean plants exposed to temperatures of 90°F or higher for just a few consecutive days will generate much less yield. Consequently, he has estimated that US output of corn and soybeans could decline by 30 to 80 percent this century, depending on how high average temperatures climb.

“This will reduce food availability and push up prices worldwide, since the US is the largest producer and exporter of these commodities,” Schlenker says.

There is also evidence that climate change is reducing the nutritional value of our food. Lewis Ziska, a Columbia professor of environmental health sciences and an expert on plant physiology, has found that as CO2 levels rise, rice plants are producing grains that contain less protein and fewer vitamins and minerals. “Plant biology is all about balance, and when crops suddenly have access to more CO2 but the same amount of soil nutrients, their chemical composition changes,” he says. “The plants look the same, and they may even grow a little bit faster, but they’re not as good for you. They’re carbon-rich and nutrient-poor.” Ziska says that the molecular changes in rice that he has observed are fairly subtle, but he expects that as CO2 levels continue to rise over the next two to three decades, the changes will become more pronounced and have a significant impact on human health. “Wheat, barley, potatoes, and carrots are also losing some of their nutritional value,” he says. “This is going to affect everybody — but especially people in developing countries who depend on grains like wheat and rice for most of their calories.”

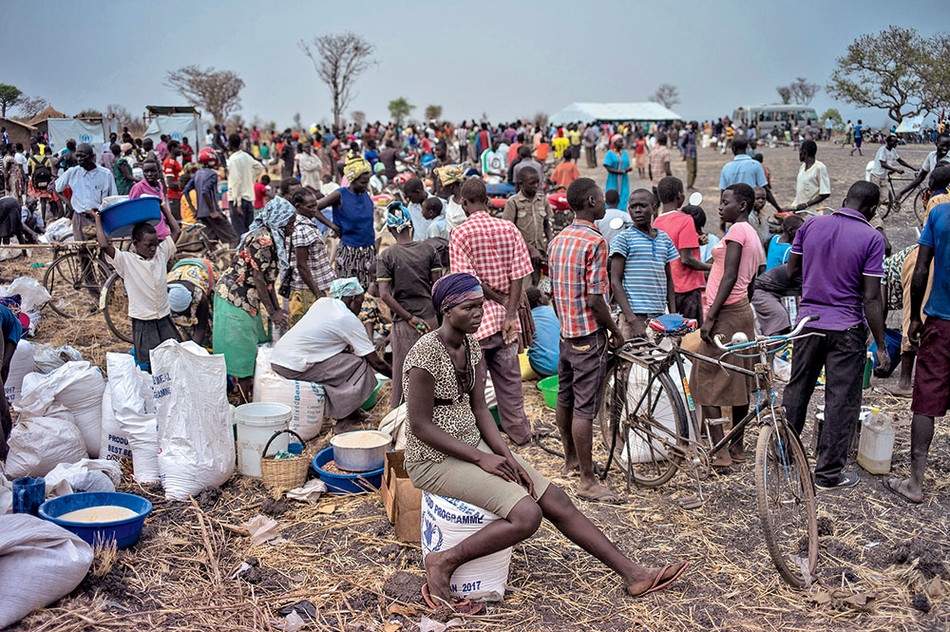
Experts also worry that droughts, heat waves, and floods driven by climate change could destroy harvests across entire regions, causing widespread food shortages. A major UN report coauthored by Columbia climate scientist Cynthia Rosenzweig in 2019 described the growing threat of climate-induced hunger, identifying Africa, South America, and Asia as the areas of greatest susceptibility, in part because global warming is accelerating desertification there. Already, some eight hundred million people around the world are chronically undernourished, and that number could grow by 20 percent as a result of climate change in the coming decades, the report found.

In hopes of reversing this trend, Columbia scientists are now spearheading ambitious efforts to improve the food security of some of the world’s most vulnerable populations. For example, at the International Research Institute for Climate and Society (IRI), which is part of the Earth Institute, multidisciplinary teams of climatologists and social scientists are working in Ethiopia, Senegal, Colombia, Guatemala, Bangladesh, and Vietnam to minimize the types of crop losses that often occur when climate change brings more sporadic rainfall. The IRI experts, whose work is supported by Columbia World Projects, are training local meteorologists, agricultural officials, and farmers to use short-term climate-prediction systems to anticipate when an upcoming season’s growing conditions necessitate using drought-resistant or flood-resistant seeds. They can also suggest more favorable planting schedules. To date, they have helped boost crop yields in dozens of small agricultural communities.

“This is a versatile approach that we’re modeling in six nations, with the hope of rolling it out to many others,” says IRI director John Furlow. “Agriculture still dominates the economies of most developing countries, and in order to succeed despite increasingly erratic weather, farmers need to be able to integrate science into their decision-making.”

South Sudanese refugees gathering at a camp in Uganda
South Sudanese refugees gather at a camp in Uganda. (Dan Kitwood / Getty Images)
4. We need to prepare for massive waves of human migration

For thousands of years,the vast majority of the human population has lived in a surprisingly narrow environmental niche, on lands that are fairly close to the equator and offer warm temperatures, ample fresh water, and fertile soils.

But now, suddenly, the environment is changing. The sun’s rays burn hotter, and rainfall is erratic. Some areas are threatened by rising sea levels, and in others the land is turning to dust, forests to kindling. What will people do in the coming years? Will they tough it out and try to adapt, or will they migrate in search of more hospitable territory?

Alex de Sherbinin, a Columbia geographer, is among the first scientists attempting to answer this question empirically. In a series of groundbreaking studies conducted with colleagues at the World Bank, the Potsdam Institute for Climate Impact Research, New York University, Baruch College, and other institutions, he has concluded that enormous waves of human migration will likely occur this century unless governments act quickly to shift their economies away from fossil fuels and thereby slow the pace of global warming. His team’s latest report, published this fall and based on a comprehensive analysis of climatic, demographic, agricultural, and water-use data, predicts that up to 215 million people from Asia, Eastern Europe, Africa, and Latin America — mostly members of agricultural communities, but also some city dwellers on shorelines — will permanently abandon their homes as a result of droughts, crop failures, and sea-level rise by 2050.

“And that’s a conservative estimate,” says de Sherbinin, a senior research scientist at Columbia’s Center for International Earth Science Information Network. “We’re only looking at migration that will occur as the result of the gradual environmental changes occurring where people live, not massive one-time relocations that might be prompted by natural disasters like typhoons or wildfires.”

De Sherbinin and his colleagues do not predict how many climate migrants will ultimately cross international borders in search of greener pastures. Their work to date has focused on anticipating population movements within resource-poor countries in order to help governments develop strategies for preventing exoduses of their own citizens, such as by providing struggling farmers with irrigation systems or crop insurance. They also identify cities that are likely to receive large numbers of new residents from the surrounding countryside, so that local governments can prepare to accommodate them. Among the regions that will see large-scale population movements, the researchers predict, is East Africa, where millions of smallholder farmers will abandon drought-stricken lands and flock to cities like Kampala, Nairobi, and Lilongwe. Similarly, agricultural communities across Latin America, devastated by plummeting corn, bean, and coffee yields, will leave their fields and depart for urban centers. And in Southeast Asia, rice farmers and fishing families in increasingly flood-prone coastal zones like Vietnam’s Mekong Delta, home to twenty-one million people, will retreat inland.

But these migrations, if they do occur, do not necessarily need to be tragic or chaotic affairs, according to de Sherbinin. In fact, he says that with proper planning, and with input from those who are considering moving, it is even possible that large-scale relocations could be organized in ways that ultimately benefit everybody involved, offering families of subsistence farmers who would otherwise face climate-induced food shortages a new start in more fertile locations or in municipalities that offer more education, job training, health care, and other public services.

“Of course, wealthy nations should be doing more to stop climate change and to help people in developing countries adapt to environmental changes, so they have a better chance of thriving where they are,” he says. “But the international community also needs to help poorer countries prepare for these migrations. If and when large numbers of people do find that their lands are no longer habitable, there should be systems in place to help them relocate in ways that work for them, so that they’re not spontaneously fleeing droughts or floods as refugees but are choosing to safely move somewhere they want to go, to a place that’s ready to receive them.”

Man cooling off in a fire hydrant
Temperatures have become especially dangerous in inner cities as a result of the “urban heat island” effect. (Nina Westervelt / Bloomberg via Getty Images)
5. Rising temperatures are already making people sick

One of the deadliest results of climate change, and also one of the most insidious and overlooked, experts say, is the public-health threat posed by rising temperatures and extreme heat.

“Hot weather can trigger changes in the body that have both acute and chronic health consequences,” says Cecilia Sorensen, a Columbia emergency-room physician and public-health researcher. “It actually alters your blood chemistry in ways that make it prone to clotting, which can lead to heart attacks or strokes, and it promotes inflammation, which can contribute to a host of other problems.”

Exposure to severe heat, Sorensen says, has been shown to exacerbate cardiovascular disease, asthma, chronic obstructive pulmonary disease, arthritis, migraines, depression, and anxiety, among other conditions. “So if you live in a hot climate and lack access to air conditioning, or work outdoors, you’re more likely to get sick.”

By destabilizing the natural environment and our relationship to it, climate change is endangering human health in numerous ways. Researchers at Columbia’s Mailman School of Public Health, which launched its innovative Climate and Health Program in 2010, have shown that rising temperatures are making air pollution worse, in part because smog forms faster in warmer weather and because wildfires are spewing enormous amounts of particulate matter into the atmosphere. Global warming is also contributing to food and drinking-water shortages, especially in developing countries. And it is expected to fuel transmission of dengue fever, Lyme disease, West Nile virus, and other diseases by expanding the ranges of mosquitoes and ticks. But experts say that exposure to extreme heat is one of the least understood and fastest growing threats.

“Health-care professionals often fail to notice when heat stress is behind a patient’s chief complaint,” says Sorensen, who directs the Mailman School’s Global Consortium on Climate and Health Education, an initiative launched in 2017 to encourage other schools of public health and medicine to train practitioners to recognize when environmental factors are driving patients’ health problems. “If I’m seeing someone in the ER with neurological symptoms in the middle of a heat wave, for example, I need to quickly figure out whether they’re having a cerebral stroke or a heat stroke, which itself can be fatal if you don’t cool the body down quickly. And then I need to check to see if they’re taking any medications that can cause dehydration or interfere with the body’s ability to cool itself. But these steps aren’t always taken.”

Sorensen says there is evidence to suggest that climate change, in addition to aggravating existing medical conditions, is causing new types of heat-related illnesses to emerge. She points out that tens of thousands of agricultural workers in Central America have died of an enigmatic new kidney ailment that has been dubbed Mesoamerican nephropathy or chronic kidney disease of unknown origin (CKDu), which appears to be the result of persistent heat-induced inflammation. Since CKDu was first observed among sugarcane workers in El Salvador in the 1990s, Sorensen says, it has become endemic in those parts of Central America where heat waves have grown the most ferocious.

“It’s also been spotted among rice farmers in Sri Lanka and laborers in India and Egypt,” says Sorensen, who is collaborating with physicians in Guatemala to develop an occupational-health surveillance system to spot workers who are at risk of developing CKDu. “In total, we think that at least fifty thousand people have died of this condition worldwide.”

Heat waves are now also killing hundreds of Americans each year. Particularly at risk, experts say, are people who live in dense urban neighborhoods that lack trees, open space, reflective rooftops, and other infrastructure that can help dissipate the heat absorbed by asphalt, concrete, and brick. Research has shown that temperatures in such areas can get up to 15°F hotter than in surrounding neighborhoods on summer days. The fact that these so-called “urban heat islands” are inhabited largely by Black and Latino people is now seen as a glaring racial inequity that should be redressed by investing in public-infrastructure projects that would make the neighborhoods cooler and safer.

“It isn’t a coincidence that racially segregated neighborhoods in US cities are much hotter, on average, than adjacent neighborhoods,” says Joan Casey, a Columbia epidemiologist who studies how our natural and built environments influence human health. In fact, in one recent study, Casey and several colleagues showed that urban neighborhoods that lack green space are by and large the same as those that in the 1930s and 1940s were subject to the racist practice known as redlining, in which banks and municipalities designated minority neighborhoods as off-limits for private lending and public investment. “There’s a clear link between that history of institutionalized racism and the subpar public infrastructure we see in these neighborhoods today,” she says.

Extreme heat is hardly the only environmental health hazard faced by residents of historically segregated neighborhoods. Research by Columbia scientists and others has shown that people in these areas are often exposed to dirty air, partly as a result of the large numbers of trucks and buses routed through their streets, and to toxins emanating from industrial sites. But skyrocketing temperatures are exacerbating all of these other health risks, according to Sorensen.

“A big push now among climate scientists and public-health researchers is to gather more street-by-street climate data in major cities so that we know exactly where people are at the greatest risk of heat stress and can more effectively advocate for major infrastructure upgrades in those places,” she says. “In the meantime, there are relatively small things that cities can do now to save lives in the summer — like providing people free air conditioners, opening community cooling centers, and installing more water fountains.”

Workers installing solar panels on the roof of a fish-processing plant in Zhoushan, China
Workers install solar panels on the roof of a fish-processing plant in Zhoushan, China. (Yao Feng / VCG via Getty Images)
6. We’re curbing emissions but need to act faster

Since the beginning ofthe industrial revolution, humans have caused the planet to warm 1.1°C (or about 2°F), mainly by burning coal, oil, and gas for energy. Current policies put the world on pace to increase global temperatures by about 2.6°C over pre-industrial levels by the end of the century. But to avoid the most catastrophic consequences of climate change, we must try to limit the warming to 1.5°C, scientists say. This will require that we retool our energy systems, dramatically expanding the use of renewable resources and eliminating nearly all greenhouse-gas emissions by mid-century.

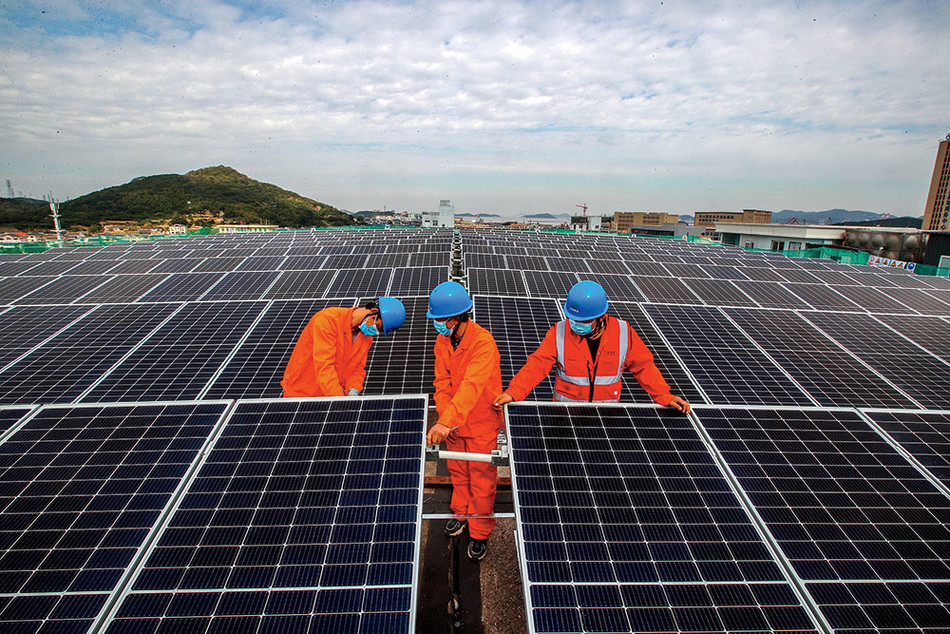
“We’ll have to build the equivalent of the world’s largest solar park every day for the next thirty years to get to net zero by 2050,” says Jason Bordoff, co-dean of the Columbia Climate School. A leading energy-policy expert, Bordoff served on the National Security Council of President Barack Obama ’83CC. “We’ll also have to ramp up global investments in clean energy R&D from about $2 trillion to $5 trillion per year,” he adds, citing research from the International Energy Agency. “The challenge is enormous.”

Over the past few years, momentum for a clean-energy transition has been accelerating. In the early 2000s, global emissions were increasing 3 percent each year. Now they are rising just 1 percent annually, on average, with some projections indicating that they will peak in the mid-2020s and then start to decline. This is the result of a variety of policies that countries have taken to wean themselves off fossil fuels. European nations, for example, have set strict limits on industrial emissions. South Africa, Chile, New Zealand, and Canada have taken significant steps to phase out coal-fired power plants. And the US and China have enacted fuel-efficiency standards and invested in the development of renewable solar, wind, and geothermal energy — which, along with hydropower, account for nearly 30 percent of all electricity production in the world.

“It’s remarkable how efficient renewables have become over the past decade,” says Bordoff, noting that the costs of solar and wind power have dropped by roughly 90 percent and 70 percent, respectively, in that time. “They’re now competing quite favorably against fossil fuels in many places, even without government subsidies.”

But in the race to create a carbon-neutral global economy, Bordoff says, the biggest hurdles are ahead of us. He points out that we currently have no affordable ways to decarbonize industries like shipping, trucking, air travel, and cement and steel production, which require immense amounts of energy that renewables cannot yet provide. “About half of all the emission reductions that we’ll need to achieve between now and 2050 must come from technologies that aren’t yet available at commercial scale,” says Bordoff.

In order to fulfill the potential of solar and wind energy, we must also improve the capacity of electrical grids to store power. “We need new types of batteries capable of storing energy for longer durations, so that it’s available even on days when it isn’t sunny or windy,” he says.

Perhaps the biggest challenge, Bordoff says, will be scaling up renewable technologies quickly enough to meet the growing demand for electricity in developing nations, which may otherwise choose to build more coal- and gas-fueled power plants. “There are large numbers of people around the world today who have almost no access to electricity, and who in the coming years are going to want to enjoy some of the basic conveniences that we often take for granted, like refrigeration, Internet access, and air conditioning,” he says. “Finding sustainable ways to meet their energy needs is a matter of equity and justice.”

Bordoff, who is co-leading the new Climate School alongside geochemist Alex Halliday, environmental geographer Ruth DeFries, and marine geologist Maureen Raymo ’89GSAS, is also the founding director of SIPA’s Center on Global Energy Policy, which supports research aimed at identifying evidence-based, actionable solutions to the world’s energy needs. With more than fifty affiliate scholars, the center has, since its creation in 2013, established itself as an intellectual powerhouse in the field of energy policy, publishing a steady stream of definitive reports on topics such as the future of coal; the potential for newer, safer forms of nuclear energy to help combat climate change; and the geopolitical ramifications of the shift away from fossil fuels. One of the center’s more influential publications, Energizing America, from 2020, provides a detailed roadmap for how the US can assert itself as an international leader in clean-energy systems by injecting more federal money into the development of technologies that could help decarbonize industries like construction, transportation, agriculture, and manufacturing. President Joe Biden’s $1 trillion Infrastructure Investment and Jobs Act, signed into law in November, incorporates many of the report’s recommendations, earmarking tens of billions of dollars for scientific research in these areas.

“When we sat down to work on that project, my colleagues and I asked ourselves: If an incoming administration wanted to go really big on climate, what would it do? How much money would you need, and where exactly would you put it?” Bordoff says. “I think that’s one of our successes.”

Which isn’t to say that Bordoff considers the climate initiatives currently being pursued by the Biden administration to be sufficient to combat global warming. The vast majority of the climate-mitigation measures contained in the administration’s first two major legislative packages — the infrastructure plan and the more ambitious Build Back Better social-spending bill, which was still being debated in Congress when this magazine went to press — are designed to reward businesses and consumers for making more sustainable choices, like switching to renewable energy sources and purchasing electric vehicles. A truly transformative climate initiative, Bordoff says, would also discourage excessive use of fossil fuels. “Ideally, you’d want to put a price on emissions, such as with a carbon tax or a gasoline tax, so that the biggest emitters are forced to internalize the social costs they’re imposing on everyone else,” he says.

Bordoff is a pragmatist, though, and ever mindful of the fact that public policy is only as durable as it is popular. “I think the American people are more divided on this than we sometimes appreciate,” he says. “Support for climate action is growing in the US, but we have to be cognizant of how policy affects everyday people. There would be concern, maybe even outrage, if electric or gas bills suddenly increased. And that would make it much, much harder to gain and keep support during this transition.”

Today, researchers from across the entire University are working together to pursue a multitude of strategies that may help alleviate the climate crisis. Some are developing nanomaterials for use in ultra-efficient solar cells. Others are inventing methods to suck CO2 out of the air and pump it underground, where it will eventually turn into chalk. Bordoff gets particularly excited when describing the work of engineers at the Columbia Electrochemical Energy Center who are designing powerful new batteries to store solar and wind power. “This is a team of more than a dozen people who are the top battery experts in the world,” he says. “Not only are they developing technologies to create long-duration batteries, but they’re looking for ways to produce them without having to rely on critical minerals like cobalt and lithium, which are in short supply.”

In his own work, Bordoff has recently been exploring the geopolitical ramifications of the energy transition, with an eye toward helping policymakers navigate the shifting international power dynamics that are likely to occur as attention tilts away from fossil fuels in favor of other natural resources.

But he believes the best ideas will come from the next generation of young people, who, like the students in the Climate School’s inaugural class this year, are demanding a better future. “When I see the growing sense of urgency around the world, especially among the younger demographics, it gives me hope,” he says. “The pressure for change is building. Our climate policies don’t go far enough yet, so something is eventually going to have to give — and I don’t think it’s going to be the will and determination of the young people. Sooner or later, they’re going to help push through the more stringent policies that we need. The question is whether it will be in time.” 

How technology might finally start telling farmers things they didn’t already know (MIT Technology Review)

technologyreview.com

In the Salinas Valley, America’s “Salad Bowl,” startups selling machine learning and remote sensing are finding customers.

Rowan Moore Gerety – Dec. 18, 2020


As a machine operator for the robotics startup FarmWise, Diego Alcántar spends each day walking behind a hulking robot that resembles a driverless Zamboni, helping it learn to do the work of a 30-person weeding crew. 

On a Tuesday morning in September, I met Alcántar in a gigantic cauliflower field in the hills outside Santa Maria, at the southern end of the vast checkerboard of vegetable farms that line California’s central coast, running from Oxnard north to Salinas and Watsonville. Cooled by coastal mists rolling off the Pacific, the Salinas valley is sometimes called America’s Salad Bowl. Together with two adjacent counties to the south, the area around Salinas produces the vast majority of lettuce grown in the US during the summer months, along with most of the cauliflower, celery, and broccoli, and a good share of the berries. 

It was the kind of Goldilocks weather that the central coast is known for—warm but not hot, dry but not parched, with a gentle breeze gliding in from the coast. Nearby, a harvest crew in straw hats and long sleeves was making quick work of an inconceivable quantity of iceberg lettuce, stacking boxes 10 high on the backs of tractor-trailers lining a dirt road. 

In another three months, the same scene would unfold in the cauliflower field where Alcántar now stood, surrounded by tens of thousands of two- and three-leaf seedlings. First, though, it had to be weeded. 

The robot straddled a planted bed three rows wide with its wheels in adjacent furrows. Alcántar followed a few paces back, holding an iPad with touch-screen controls like a joystick’s. Under the hood, the robot’s cameras flashed constantly. Bursts of air, like the pistons in a whack-a-mole arcade game, guided sets of L-shaped blades in precise, short strokes between the cauliflower seedlings, scraping the soil to uproot tiny weeds and then parting every 12 inches so that only the cauliflower remained, unscathed.

Periodically, Alcántar stopped the machine and kneeled in the furrow, bending to examine a “kill”—spots where the robot’s array of cameras and blades had gone ever so slightly out of alignment and uprooted the seedling itself. Alcántar was averaging about an acre an hour, and only one kill out of every thousand plants. The kills often came in sets of twos and threes, marking spots where one wheel had crept out of the furrow and onto the bed itself, or where the blades had parted a fraction of a second too late.

Taking an iPhone out of his pocket, Alcántar pulled up a Slack channel called #field-de-bugging and sent a note to a colleague 150 miles away about five kills in a row, with a hypothesis about the cause (latency between camera and blade) and a time stamp so he could find the images and see what had gone wrong.

In this field, and many others like it, the ground had been prepared by a machine, the seedlings transplanted by a machine, and the pesticides and fertilizers applied by a machine. Irrigation crews still laid sprinkler pipe manually, and farmworkers would harvest this cauliflower crop when the time came, but it isn’t a stretch to think that one day, no person will ever lay a hand to the ground around these seedlings. 

Technology’s race to disrupt one of the planet’s oldest and largest occupations centers on the effort to imitate, and ultimately outdo, the extraordinary powers of two human body parts: the hand, able to use tweezers or hold a baby, catch or throw a football, cut lettuce or pluck a ripe strawberry with its calyx intact; and the eye, which is increasingly being challenged by a potent combination of cloud computing, digital imagery, and machine learning.

The term “ag tech” was coined at a conference in Salinas almost 15 years ago; boosters have been promising a surge of gadgets and software that would remake the farming industry for at least that long. And although ag tech startups have tended to have an easier time finding investors than customers, the boosters may finally be on to something. 

Ag tech boosters have been promising a surge of gadgets and software that would remake the farming industry for at least 15 years. They may finally be on to something. 

Silicon Valley is just over the hill from Salinas. But by the standards of the Grain Belt, the Salad Bowl is a relative backwater—worth about $10 billion a year, versus nearly $100 billion for commodity crops in the Midwest. Nobody trades lettuce futures like soybean futures; behemoths like Cargill and Conagra mostly stay away. But that’s why the “specialty crop” industry seemed to me like the best place to chart the evolution of precision farming: if tech’s tools can work along California’s central coast, on small plots with short growing cycles, then perhaps they really are ready to stage a broader takeover.

Alcántar, who is 28, was born in Mexico and came to the US as a five-year-old in 1997, walking across the Sonoran Desert into Arizona with his uncle and his younger sister. His parents, who are from the central Mexican state of Michoacán, were busily setting up the ingredients for a new life as farmworkers in Salinas, sleeping in a relative’s walk-in closet before renting a converted garage apartment. Alcántar spent the first year at home, watching TV and looking after his sister while his parents worked: there was a woman living in the main house who checked on them and kept them fed during the day, but no one who could drive them to elementary school.

workers harvest broccoli

Workers harvest broccoli as part of a joint project between NASA and the University of California.

In high school, Alcántar often worked as a field hand on the farm where his father had become a foreman. He cut and weeded lettuce, stacked strawberry boxes after the harvest, drove a forklift in the warehouse. But when he turned 22 and saw friends he’d grown up with getting their first jobs after college, he decided he needed a plan to move on from manual labor. He got a commercial driver’s license and went to work for a robotics startup. 

During this first stint, Alcántar recalls, relatives sometimes chided him for helping to accelerate a machine takeover in the fields, where stooped, sweaty work had cleared a path for his family’s upward mobility. “You’re taking our jobs away!” they’d say. 

Five years later, Alcántar says, the conversation has shifted completely. Even FarmWise has struggled to find people willing to “walk behind the machine,” he says. “People would rather work at a fast food restaurant. In-N-Out is paying $17.50 an hour.”


II

Even up close, all kinds of things can foul the “vision” of the computers that power automated systems like the ones FarmWise uses. It’s hard for a computer to tell, for instance, whether a contiguous splotch of green lettuce leaves represents a single healthy seedling or a “double,” where two seeds germinated next to one another and will therefore stunt each other’s growth. Agricultural fields are bright, hot, and dusty: hardly ideal conditions for keeping computers running smoothly. A wheel gets stuck in the mud and temporarily upends the algorithm’s sense of distance: the left tires have now spun a quarter-­turn more than the right tires. 

Other ways of digital seeing have their own challenges. For satellites, there’s cloud cover to contend with; for drones and planes, wind and vibration from the engines that keep them aloft. For all three, image-recognition software must take into account the shifting appearance of the same fields at different times of day as the sun moves across the sky. And there’s always a trade-off between resolution and price. Farmers have to pay for drones, planes, or any field machinery. Satellite imagery, which has historically been produced, paid for, and shared freely by public space agencies, has been limited to infrequent images with coarse resolution.

NASA launched the first satellite for agricultural imagery, known as Landsat, in 1972. Clouds and slow download speeds conspired to limit coverage of most of the world’s farmland to a handful of images a year of any given site, with pixels from 30 to 120 meters per side.

A half-dozen more iterations of Landsat followed through the 1980s and ’90s, but it was only in 1999, with the Moderate Resolution Imaging Spectroradiometer, or MODIS, that a satellite could send farmers daily observations over most of the world’s land surface, albeit with a 250-meter pixel. As cameras and computing have improved side by side over the past 20 years, a parade of tech companies have become convinced there’s money to be made in providing insights derived from satellite and aircraft imagery, says Andy French, an expert in water conservation at the USDA’s Arid-Land Agricultural Research Center in Arizona. “They haven’t been successful,” he says. But as the frequency and resolution of satellite images both continue to increase, that could now change very quickly, he believes: “We’ve gone from Landsat going over our head every 16 days to having near-daily, one- to four-meter resolution.” 

“We’ve gone from Landsat going over our head every 16 days to having near-daily, one- to four-meter resolution.” 

Andy French

In 2014, Monsanto acquired a startup called the Climate Corporation, which billed itself as a “digital farming” company, for a billion dollars. “It was a bunch of Google guys who were experts in satellite imagery, saying ‘Can we make this useful to farmers?’” says Thad Simons, a longtime commodities executive who cofounded a venture capital firm called the Yield Lab. “That got everybody’s attention.” 

In the years since, Silicon Valley has sent forth a burst of venture-funded startups whose analytic and forecasting services rely on tools that can gather and process information autonomously or at a distance: not only imagery, but also things like soil sensors and moisture probes. “Once you see the conferences making more money than people actually doing work,” Simons says with a chuckle, “‘you know it’s a hot area.’’

A subset of these companies, like FarmWise, are working on something akin to hand-eye coordination, chasing the perennial goal of automating the most labor-intensive stages of fruit and vegetable farming—weeding and, above all, harvesting—against a backdrop of chronic farm labor shortages. But many others are focused exclusively on giving farmers better information. 

One way to understand farming is as a never­ending hedge against the uncertainties that affect the bottom line: weather, disease, the optimal dose and timing of fertilizer, pesticides, and irrigation, and huge fluctuations in price. Each one of these factors drives thousands of incremental decisions over the course of a season—decisions based on long years of trial and error, intuition, and hard-won expertise. So the tech question on farmers’ lips everywhere, as Andy French told me, is: “What are you telling us that we didn’t already know?”


III

Josh Ruiz, the vice president of ag operations for Church Brothers, which grows greens for the food service industry, manages more than a thousand separate blocks of farmland covering more than 20,000 acres. Affable, heavy-set, and easy to talk to, Ruiz is known across the industry as an early adopter who’s not afraid to experiment with new technology. Over the last few years, he has become a regular stop on the circuit that brings curious tech executives in Teslas down from San Francisco and Mountain View to stand in a lettuce field and ask questions about the farming business. “Trimble, Bosch, Amazon, Microsoft, Google—you name it, they’re all calling me,” Ruiz says. “You can get my attention real fast if you solve a problem for me, but what happens nine times out of 10 is the tech companies come to me and they solve a problem that wasn’t a problem.”

What everyone wants, in a word, is foresight. For more than a generation, the federal government has sheltered growers of corn, wheat, soybeans, and other commodities from the financial impact of pests and bad weather by offering subsidies to offset the cost of crop insurance and, in times of bountiful harvests, setting an artificial “floor” price at which the government steps in as a buyer of last resort. Fruits and vegetables do not enjoy the same protection: they account for less than 1% of the $25 billion the federal government spends on farm subsidies. As a result, the vegetable market is subject to wild variations based on weather and other only vaguely predictable factors.

Josh Ruiz with Big Red

Josh Ruiz, the vice president of ag operations at Church Brothers, a greens-growing concern, with “Big Red,” an automated broccoli harvester of his design.

When I visited Salinas, in September, the lettuce industry was in the midst of a banner week price-wise, with whole heads of iceberg and romaine earning shippers as much as $30 a box, or roughly $30,000 an acre. “Right now, you have the chance to lose a fortune and make it back,” Ruiz said as we stood at the edge of a field. The swings can be dramatic: a few weeks earlier, he explained, iceberg was selling for a fraction of that amount—$5 a box, about half what it costs to produce and harvest. 

In the next field over, rows of young iceberg lettuce seedlings were ribbed with streaks of tawny brown—the mark of the impatiens necrotic spot virus, or INSV, which has been wreaking havoc on Salinas lettuce since the mid-aughts. These were the early signs. Come back after a couple more weeks, Ruiz said, and half the plants will be dead: it won’t be worthwhile to harvest at all. As it was, that outcome would represent a $5,000 loss, based on the costs of land, plowing, planting, and inputs. If they decided to weed and harvest, that loss could easily double. Ruiz said he wouldn’t have known he was wasting $5,000 if he hadn’t decided to take me on a drive that day. Multiply that across more than 20,000 acres. Assuming a firm could reliably deliver that kind of advance knowledge about INSV, how much would it be worth to him? 

One firm trying to find out is an imagery and analytics startup called GeoVisual Analytics, based in Colorado, which is working to refine algorithms that can project likely yields a few weeks ahead of time. It’s a hard thing to model well. A head of lettuce typically sees more than half its growth in the last three weeks before harvest; if it stays in the field just a couple of days longer, it could be too tough or spindly to sell. Any model the company builds has to account for factors like that and more. A ball of iceberg watered at the wrong time swells to a loose bouquet. Supermarket carrots are starved of water to make them longer. 

When GeoVisual first got to Salinas, in 2017, “we came in promising the future, and then we didn’t deliver,” says Charles McGregor, its 27-year-old general manager. Ruiz, less charitably, calls their first season an “epic fail.” But he gives McGregor credit for sticking around. “They listened and they fixed it,” he says. He’s just not sure what he’s willing to pay for it.

“We came in promising the future, and then we didn’t deliver.”

Charles McGregor

As it stands, the way field men arrive at yield forecasts is decidedly analog. Some count out heads of lettuce pace by pace and then extrapolate by measuring their boots. Others use a 30-foot section of sprinkler pipe. There’s no way methods like these can match the scale of what a drone or an airplane might capture, but the results have the virtue of a format growers can easily process, and they’re usually off by no more than 25 to 50 boxes an acre, or about 3% to 5%. They’re also part of a farming operation’s baseline expenses: if the same employee spots a broken irrigation valve or an empty fertilizer tank and makes sure the weeding crew starts on time, then asking him to deliver a decent harvest forecast isn’t necessarily an extra cost. By contrast, the pricing of tech-driven forecasts tends to be uneven. Tech salespeople lowball the cost of service in order to get new customers and then, eventually, have to figure out how to make money on what they sell.

“At 10 bucks an acre, I’ll tell [GeoVisual] to fly the whole thing, but at $50 an acre, I have to worry about it,” Ruiz told me. “If it costs me a hundred thousand dollars a year for two years, and then I have that aha! moment, am I gonna get my two hundred thousand dollars back?”


IV

All digital sensing for agriculture is a form of measurement by proxy: a way to translate slices of the electromagnetic spectrum into understanding of biological processes that affect plants. Thermal infrared reflectance correlates with land surface temperature, which correlates with soil moisture and, therefore, the amount of water available to plants’ roots. Measuring reflected waves of green, red, and near-infrared light is one way to estimate canopy cover, which helps researchers track evapotranspiration—that is, how much water evaporates through a plant’s leaves, a process with clear links to plant health.

Improving these chains of extrapolation is a call and response between data generated by new generations of sensors and the software models that help us understand them. Before the launch of the EU’s first Sentinel satellite in 2014, for instance, researchers had some understanding of what synthetic aperture radar, which builds high-resolution images by simulating large antennas, could reveal about plant biomass, but they lacked enough real-world data to validate their models. In the American West, there’s abundant imagery to track the movement of water over irrigated fields, but no crop model sufficiently advanced to reliably help farmers decide when to “order” irrigation water from the Colorado River, which is usually done days ahead of time. 

As with any Big Data frontier, part of what’s driving the explosion of interest in ag tech is simply the availability of unprecedented quantities of data. For the first time, technology can deliver snapshots of every individual broccoli crown on a 1,000-acre parcel and show which fields are most likely to see incursions from the deer and wild boars that live in the hills above the Salinas Valley. 

The problem is that turning such a firehose of 1s and 0s into any kind of useful insight—producing, say, a text alert about the top five fields with signs of drought stress—requires a more sophisticated understanding of the farming business than many startups seem to have. As Paul Fleming, a longtime farming consultant in Salinas, put it, “We only want to know about the things that didn’t go the way they’re supposed to.”

“We only want to know about the things that didn’t go the way they’re supposed to.”

Paul Fleming

And that’s just the beginning. Retail shippers get paid for each head of cauliflower or bundle of kale they produce; processors, who sell pre-cut broccoli crowns or bags of salad mix, are typically paid by weight. Contract farmers, hired to grow a crop for someone else for a per-acre fee, might never learn whether a given harvest was a “good” or a “bad” one, representing a profit or a loss for the shipper that hired them. It’s often in a shipper’s interest to keep individual farmers in the dark about where they stand relative to their nearby competitors.

In Salinas, the challenge of making big data relevant to farm managers is also about consolidating the universe of information farms already collect—or, perhaps, don’t. Aaron Magenheim, who grew up in his family’s irrigation business and now runs a consultancy focused on farm technology, says the particulars of irrigation, fertilizer, crop rotations, or any number of variables that can influence harvest tend to get lost in the hubbub of the season, if they’re ever captured at all. “Everyone thinks farmers know how they grow, but the reality is they’re pulling it out of the air. They don’t track that down to the lot level,” he told me, using an industry term for an individual tract of farmland. As many as 40 or 50 lots might share the same well and fertilizer tank, with no precise way of accounting for the details. “When you’re applying fertilizer, the reality is it’s a guy opening a valve on a tank and running it for 10 minutes, and saying, ‘Well that looks okay.’ Did Juan block number 6 or number 2 because of a broken pipe? Did they write it down?” Magenheim says. “No! Because they have too many things to do.”

Then there are the maps. Compared with corn and soybean operations, where the same crops get planted year after year, or vineyards and orchards, where plantings may not change for more than a generation, growers of specialty crops deal with a never-ending jigsaw puzzle of romaine following celery following broccoli, with plantings that change size and shape according to the market, and cycles as short as 30 days from seed to harvest.

worker harvests celery crop

For many companies in Salinas, the man standing astride the gap between what happens in the field and the record-keeping needs of a modern farming business is a 50-year-old technology consultant named Paul Mariottini. Mariottini—who planned to become a general contractor until he got a computer at age 18 and, as he puts it, “immediately stopped sleeping”—runs a one-man operation out of his home in Hollister, with a flip phone and a suite of bespoke templates and plug-ins he writes for Microsoft Access and Excel. When I asked the growers I met how they handled this part of the business, the reply, to a person, was: “Oh, we use Paul.”

Mariottini’s clients include some of the largest produce companies in the world, but only one uses tablets so that field supervisors can record the acreage and variety of each planting, the type and date of fertilizer and pesticide applications, and other basic facts about the work they supervise while it’s taking place. The rest take notes on paper, or enter the information from memory at the end of the day. 

When I asked Mariottini whether anyone used software to link paper maps to the spreadsheets showing what got planted where, he chuckled and said, “I’ve been doing this for 20 years trying to make that happen.” He once programmed a PalmPilot; he calls one of his plug-ins “Close-Enough GPS.” “The tech industry would probably laugh at it, but the thing that the tech industry doesn’t understand is the people you’re working with,” he said.


V

The goal of automation in farming is best understood as all encompassing. The brief weeks of harvest consume a disproportionate share of the overall budget—as much as half the cost of growing some crops. But there are also efforts to optimize and minimize labor throughout the growing cycle. Strawberries are being grown with spray-on, biodegradable weed barriers that could eliminate the need to spread plastic sheeting over every bed. Automated tractors will soon be able to plow vegetable fields to a smoother surface than a human driver could, improving germination rates. Even as analytics companies race to deliver platforms that can track the health of an individual head of lettuce from seed to supermarket and optimize the order in which fields get harvested, other startups are developing new “tapered” varieties of lettuce—similar to romaine—with a compact silhouette and leaves that rest higher off the ground, in order that they might be more easily “seen” and cut by a robot.

Overall, though, the problems with the American food system aren’t about technology so much as law and politics. We’ve known for a long time that the herbicide Roundup is tied to increased cancer rates, yet it remains widely used. We’ve known for more than 100 years that the West is short on water, yet we continue to grow alfalfa in the desert, and use increasingly sophisticated drilling techniques in a kind of water arms race. These are not problems caused by a lack of technology.

On my last day in Salinas, I met a grower named Mark Mason just off Highway 101, which cuts the valley in two, and followed him to a nine-acre block of celery featuring a tidy tower of meteorological equipment in the center. The equipment is owned by NASA, part of a joint project with the University of California’s Agriculture and Natural Resources cooperative extension office, or UCANR.

Eight years ago, amid news of droughts and forest fires across the West, Mason felt a gnawing sense that he ought to be a more careful steward of the groundwater he uses to irrigate, even if the economics suggested otherwise. That led him to contact Michael Cahn, a researcher at UCANR.

Historically, water in Salinas has always been cheap and abundant: the downside of under-irrigating, or of using too little fertilizer, has always been far larger than the potential savings. “Growers want to sell product; efficient use is secondary. They won’t cut it close and risk quality,” Cahn said. The risk might even extend to losing a crop. 

Of late, though, nitrate contamination of drinking water, caused by heavy fertilizer use and linked to thyroid disease and some types of cancer, has become a major political issue in Salinas. The local water quality control board is currently developing a new standard that will limit the amount of nitrogen fertilizer growers can apply to their fields, and it’s expected to be finalized in 2021. As Cahn explained, “You can’t control nitrogen without controlling your irrigation water.” In the meantime, Mason and a handful of other growers are working with UCANR on a software platform called Crop Manage, designed to ingest weather and soil data and deliver customized recommendations on irrigation and fertilizer use for each crop.

Michael Cahn

Michael Cahn, a researcher at the University of California who’s developing software to optimize water and fertilizer use, at a water trial for artichokes.

Cahn says he expects technological advances in water management to follow a course similar to the one being set by the threat of tighter regulations on nitrogen fertilizer. In both cases, the business argument for a fix and the technology required to get there lie somewhere downstream of politics. Outrage over lack of access to clean groundwater brought forth a new regulatory mechanism, which unlocked the funding to figure out how to measure it, and which will, in turn, inform the management approaches farmers use. 

In the end, then, it’s political pressure that has created the conditions for science and technology to advance. For now, venture capital and federal research grants continue to provide an artificial boost for ag tech while its potential buyers—such as lettuce growers—continue to treat it with a degree of caution. 

But just as new regulations can reshape the cost-benefit analysis around nitrogen or water use from one day to the next, so too can a product that brings clear returns on investment. All the growers I spoke to spend precious time keeping tabs on the startup world: taking phone calls, buying and testing tech-powered services on a sliver of their farms, making suggestions on how to target analytics or tweak a farm-facing app. Why? To have a say in how the future unfolds, or at least to get close enough to see it coming. One day soon, someone will make a lot of money following a computer’s advice about how high to price lettuce, or when to spray for a novel pest, or which fields to harvest and which ones to abandon. When that happens, these farmers want to be the first to know. 

A real-time revolution will up-end the practice of macroeconomics (The Economist)

economist.com

The Economist Oct 23rd 2021


DOES ANYONE really understand what is going on in the world economy? The pandemic has made plenty of observers look clueless. Few predicted $80 oil, let alone fleets of container ships waiting outside Californian and Chinese ports. As covid-19 let rip in 2020, forecasters overestimated how high unemployment would be by the end of the year. Today prices are rising faster than expected and nobody is sure if inflation and wages will spiral upward. For all their equations and theories, economists are often fumbling in the dark, with too little information to pick the policies that would maximise jobs and growth.

Yet, as we report this week, the age of bewilderment is starting to give way to greater enlightenment. The world is on the brink of a real-time revolution in economics, as the quality and timeliness of information are transformed. Big firms from Amazon to Netflix already use instant data to monitor grocery deliveries and how many people are glued to “Squid Game”. The pandemic has led governments and central banks to experiment, from monitoring restaurant bookings to tracking card payments. The results are still rudimentary, but as digital devices, sensors and fast payments become ubiquitous, the ability to observe the economy accurately and speedily will improve. That holds open the promise of better public-sector decision-making—as well as the temptation for governments to meddle.

The desire for better economic data is hardly new. America’s GNP estimates date to 1934 and initially came with a 13-month time lag. In the 1950s a young Alan Greenspan monitored freight-car traffic to arrive at early estimates of steel production. Ever since Walmart pioneered supply-chain management in the 1980s private-sector bosses have seen timely data as a source of competitive advantage. But the public sector has been slow to reform how it works. The official figures that economists track—think of GDP or employment—come with lags of weeks or months and are often revised dramatically. Productivity takes years to calculate accurately. It is only a slight exaggeration to say that central banks are flying blind.

Bad and late data can lead to policy errors that cost millions of jobs and trillions of dollars in lost output. The financial crisis would have been a lot less harmful had the Federal Reserve cut interest rates to near zero in December 2007, when America entered recession, rather than in December 2008, when economists at last saw it in the numbers. Patchy data about a vast informal economy and rotten banks have made it harder for India’s policymakers to end their country’s lost decade of low growth. The European Central Bank wrongly raised interest rates in 2011 amid a temporary burst of inflation, sending the euro area back into recession. The Bank of England may be about to make a similar mistake today.

The pandemic has, however, become a catalyst for change. Without the time to wait for official surveys to reveal the effects of the virus or lockdowns, governments and central banks have experimented, tracking mobile phones, contactless payments and the real-time use of aircraft engines. Instead of locking themselves in their studies for years writing the next “General Theory”, today’s star economists, such as Raj Chetty at Harvard University, run well-staffed labs that crunch numbers. Firms such as JPMorgan Chase have opened up treasure chests of data on bank balances and credit-card bills, helping reveal whether people are spending cash or hoarding it.

These trends will intensify as technology permeates the economy. A larger share of spending is shifting online and transactions are being processed faster. Real-time payments grew by 41% in 2020, according to McKinsey, a consultancy (India registered 25.6bn such transactions). More machines and objects are being fitted with sensors, including individual shipping containers that could make sense of supply-chain blockages. Govcoins, or central-bank digital currencies (CBDCs), which China is already piloting and over 50 other countries are considering, might soon provide a goldmine of real-time detail about how the economy works.

Timely data would cut the risk of policy cock-ups—it would be easier to judge, say, if a dip in activity was becoming a slump. And the levers governments can pull will improve, too. Central bankers reckon it takes 18 months or more for a change in interest rates to take full effect. But Hong Kong is trying out cash handouts in digital wallets that expire if they are not spent quickly. CBDCs might allow interest rates to fall deeply negative. Good data during crises could let support be precisely targeted; imagine loans only for firms with robust balance-sheets but a temporary liquidity problem. Instead of wasteful universal welfare payments made through social-security bureaucracies, the poor could enjoy instant income top-ups if they lost their job, paid into digital wallets without any paperwork.

The real-time revolution promises to make economic decisions more accurate, transparent and rules-based. But it also brings dangers. New indicators may be misinterpreted: is a global recession starting or is Uber just losing market share? They are not as representative or free from bias as the painstaking surveys by statistical agencies. Big firms could hoard data, giving them an undue advantage. Private firms such as Facebook, which launched a digital wallet this week, may one day have more insight into consumer spending than the Fed does.

Know thyself

The biggest danger is hubris. With a panopticon of the economy, it will be tempting for politicians and officials to imagine they can see far into the future, or to mould society according to their preferences and favour particular groups. This is the dream of the Chinese Communist Party, which seeks to engage in a form of digital central planning.

In fact no amount of data can reliably predict the future. Unfathomably complex, dynamic economies rely not on Big Brother but on the spontaneous behaviour of millions of independent firms and consumers. Instant economics isn’t about clairvoyance or omniscience. Instead its promise is prosaic but transformative: better, timelier and more rational decision-making. ■

economist.com

Enter third-wave economics

Oct 23rd 2021


AS PART OF his plan for socialism in the early 1970s, Salvador Allende created Project Cybersyn. The Chilean president’s idea was to offer bureaucrats unprecedented insight into the country’s economy. Managers would feed information from factories and fields into a central database. In an operations room bureaucrats could see if production was rising in the metals sector but falling on farms, or what was happening to wages in mining. They would quickly be able to analyse the impact of a tweak to regulations or production quotas.

Cybersyn never got off the ground. But something curiously similar has emerged in Salina, a small city in Kansas. Salina311, a local paper, has started publishing a “community dashboard” for the area, with rapid-fire data on local retail prices, the number of job vacancies and more—in effect, an electrocardiogram of the economy.

What is true in Salina is true for a growing number of national governments. When the pandemic started last year bureaucrats began studying dashboards of “high-frequency” data, such as daily airport passengers and hour-by-hour credit-card-spending. In recent weeks they have turned to new high-frequency sources, to get a better sense of where labour shortages are worst or to estimate which commodity price is next in line to soar. Economists have seized on these new data sets, producing a research boom (see chart 1). In the process, they are influencing policy as never before.

This fast-paced economics involves three big changes. First, it draws on data that are not only abundant but also directly relevant to real-world problems. When policymakers are trying to understand what lockdowns do to leisure spending they look at live restaurant reservations; when they want to get a handle on supply-chain bottlenecks they look at day-by-day movements of ships. Troves of timely, granular data are to economics what the microscope was to biology, opening a new way of looking at the world.

Second, the economists using the data are keener on influencing public policy. More of them do quick-and-dirty research in response to new policies. Academics have flocked to Twitter to engage in debate.

And, third, this new type of economics involves little theory. Practitioners claim to let the information speak for itself. Raj Chetty, a Harvard professor and one of the pioneers, has suggested that controversies between economists should be little different from disagreements among doctors about whether coffee is bad for you: a matter purely of evidence. All this is causing controversy among dismal scientists, not least because some, such as Mr Chetty, have done better from the shift than others: a few superstars dominate the field.

Their emerging discipline might be called “third wave” economics. The first wave emerged with Adam Smith and the “Wealth of Nations”, published in 1776. Economics mainly involved books or papers written by one person, focusing on some big theoretical question. Smith sought to tear down the monopolistic habits of 18th-century Europe. In the 20th century John Maynard Keynes wanted people to think differently about the government’s role in managing the economic cycle. Milton Friedman aimed to eliminate many of the responsibilities that politicians, following Keynes’s ideas, had arrogated to themselves.

All three men had a big impact on policies—as late as 1850 Smith was quoted 30 times in Parliament—but in a diffuse way. Data were scarce. Even by the 1970s more than half of economics papers focused on theory alone, suggests a study published in 2012 by Daniel Hamermesh, an economist.

That changed with the second wave of economics. By 2011 purely theoretical papers accounted for only 19% of publications. The growth of official statistics gave wonks more data to work with. More powerful computers made it easier to spot patterns and ascribe causality (this year’s Nobel prize was awarded for the practice of identifying cause and effect). The average number of authors per paper rose, as the complexity of the analysis increased (see chart 2). Economists had greater involvement in policy: rich-world governments began using cost-benefit analysis for infrastructure decisions from the 1950s.

Second-wave economics nonetheless remained constrained by data. Most national statistics are published with lags of months or years. “The traditional government statistics weren’t really all that helpful—by the time they came out, the data were stale,” says Michael Faulkender, an assistant treasury secretary in Washington at the start of the pandemic. The quality of official local economic data is mixed, at best; they do a poor job of covering the housing market and consumer spending. National statistics came into being at a time when the average economy looked more industrial, and less service-based, than it does now. The Standard Industrial Classification, introduced in 1937-38 and still in use with updates, divides manufacturing into 24 subsections, but the entire financial industry into just three.

The mists of time

Especially in times of rapid change, policymakers have operated in a fog. “If you look at the data right now…we are not in what would normally be characterised as a recession,” argued Edward Lazear, then chairman of the White House Council of Economic Advisers, in May 2008. Five months later, after Lehman Brothers had collapsed, the IMF noted that America was “not necessarily” heading for a deep recession. In fact America had entered a recession in December 2007. In 2007-09 there was no surge in economics publications. Economists’ recommendations for policy were mostly based on judgment, theory and a cursory reading of national statistics.

The gap between official data and what is happening in the real economy can still be glaring. Walk around a Walmart in Kansas and many items, from pet food to bottled water, are in short supply. Yet some national statistics fail to show such problems. Dean Baker of the Centre for Economic and Policy Research, using official data, points out that American real inventories, excluding cars and farm products, are barely lower than before the pandemic.

There were hints of an economics third wave before the pandemic. Some economists were finding new, extremely detailed streams of data, such as anonymised tax records and location information from mobile phones. The analysis of these giant data sets requires the creation of what are in effect industrial labs, teams of economists who clean and probe the numbers. Susan Athey, a trailblazer in applying modern computational methods in economics, has 20 or so non-faculty researchers at her Stanford lab (Mr Chetty’s team boasts similar numbers). Of the 20 economists with the most cited new work during the pandemic, three run industrial labs.

More data sprouted from firms. Visa and Square record spending patterns, Apple and Google track movements, and security companies know when people go in and out of buildings. “Computers are in the middle of every economic arrangement, so naturally things are recorded,” says Jon Levin of Stanford’s Graduate School of Business. Jamie Dimon, the boss of JPMorgan Chase, a bank, is an unlikely hero of the emergence of third-wave economics. In 2015 he helped set up an institute at his bank which tapped into data from its network to analyse questions about consumer finances and small businesses.

The Brexit referendum of June 2016 was the first big event when real-time data were put to the test. The British government and investors needed to get a sense of this unusual shock long before Britain’s official GDP numbers came out. They scraped web pages for telltale signs such as restaurant reservations and the number of supermarkets offering discounts—and concluded, correctly, that though the economy was slowing, it was far from the catastrophe that many forecasters had predicted.

Real-time data might have remained a niche pursuit for longer were it not for the pandemic. Chinese firms have long produced granular high-frequency data on everything from cinema visits to the number of glasses of beer that people are drinking daily. Beer-and-movie statistics are a useful cross-check against sometimes dodgy official figures. China-watchers turned to them in January 2020, when lockdowns began in Hubei province. The numbers showed that the world’s second-largest economy was heading for a slump. And they made it clear to economists elsewhere how useful such data could be.

Vast and fast

In the early days of the pandemic Google started releasing anonymised data on people’s physical movements; this has helped researchers produce a day-by-day measure of the severity of lockdowns (see chart 3). OpenTable, a booking platform, started publishing daily information on restaurant reservations. America’s Census Bureau quickly introduced a weekly survey of households, asking them questions ranging from their employment status to whether they could afford to pay the rent.

In May 2020 Jose Maria Barrero, Nick Bloom and Steven Davis, three economists, began a monthly survey of American business practices and work habits. Working-age Americans are paid to answer questions on how often they plan to visit the office, say, or how they would prefer to greet a work colleague. “People often complete a survey during their lunch break,” says Mr Bloom, of Stanford University. “They sit there with a sandwich, answer some questions, and that pays for their lunch.”

Demand for research to understand a confusing economic situation jumped. The first analysis of America’s $600 weekly boost to unemployment insurance, implemented in March 2020, was published in weeks. The British government knew by October 2020 that a scheme to subsidise restaurant attendance in August 2020 had probably boosted covid infections. Many apparently self-evident things about the pandemic—that the economy collapsed in March 2020, that the poor have suffered more than the rich, or that the shift to working from home is turning out better than expected—only seem obvious because of rapid-fire economic research.

It is harder to quantify the policy impact. Some economists scoff at the notion that their research has influenced politicians’ pandemic response. Many studies using real-time data suggested that the Paycheck Protection Programme, an effort to channel money to American small firms, was doing less good than hoped. Yet small-business lobbyists ensured that politicians did not get rid of it for months. Tyler Cowen, of George Mason University, points out that the most significant contribution of economists during the pandemic involved recommending early pledges to buy vaccines—based on older research, not real-time data.

Still, Mr Faulkender says that the special support for restaurants that was included in America’s stimulus was influenced by a weak recovery in the industry seen in the OpenTable data. Research by Mr Chetty in early 2021 found that stimulus cheques sent in December boosted spending by lower-income households, but not much for richer households. He claims this informed the decision to place stronger income limits on the stimulus cheques sent in March.

Shaping the economic conversation

As for the Federal Reserve, in May 2020 the Dallas and New York regional Feds and James Stock, a Harvard economist, created an activity index using data from SafeGraph, a data provider that tracks mobility using mobile-phone pings. The St Louis Fed used data from Homebase to track employment numbers daily. Both showed shortfalls of economic activity in advance of official data. This led the Fed to communicate its doveish policy stance faster.

Speedy data also helped frame debate. Everyone realised the world was in a deep recession much sooner than they had in 2007-09. In the IMF’s overviews of the global economy in 2009, 40% of the papers cited had been published in 2008-09. In the overview published in October 2020, by contrast, over half the citations were for papers published that year.

The third wave of economics has been better for some practitioners than others. As lockdowns began, many male economists found themselves at home with no teaching responsibilities and more time to do research. Female ones often picked up the slack of child care. A paper in Covid Economics, a rapid-fire journal, finds that female authors accounted for 12% of economics working-paper submissions during the pandemic, compared with 20% before. Economists lucky enough to have researched topics before the pandemic which became hot, from home-working to welfare policy, were suddenly in demand.

There are also deeper shifts in the value placed on different sorts of research. The Economist has examined rankings of economists from IDEAS RePEC, a database of research, and citation data from Google Scholar. We divided economists into three groups: “lone wolves” (who publish with less than one unique co-author per paper on average); “collaborators” (those who tend to work with more than one unique co-author per paper, usually two to four people); and “lab leaders” (researchers who run a large team of dedicated assistants). We then looked at the top ten economists for each as measured by RePEC author rankings for the past ten years.

Collaborators performed far ahead of the other two groups during the pandemic (see chart 4). Lone wolves did worst: working with large data sets benefits from a division of labour. Why collaborators did better than lab leaders is less clear. They may have been more nimble in working with those best suited for the problems at hand; lab leaders are stuck with a fixed group of co-authors and assistants.

The most popular types of research highlight another aspect of the third wave: its usefulness for business. Scott Baker, another economist, and Messrs Bloom and Davis—three of the top four authors during the pandemic compared with the year before—are all “collaborators” and use daily newspaper data to study markets. Their uncertainty index has been used by hedge funds to understand the drivers of asset prices. The research by Messrs Bloom and Davis on working from home has also gained attention from businesses seeking insight on the transition to remote work.

But does it work in theory?

Not everyone likes where the discipline is going. When economists say that their fellows are turning into data scientists, it is not meant as a compliment. A kinder interpretation is that the shift to data-heavy work is correcting a historical imbalance. “The most important problem with macro over the past few decades has been that it has been too theoretical,” says Jón Steinsson of the University of California, Berkeley, in an essay published in July. A better balance with data improves theory. Half of the recent Nobel prize went for the application of new empirical methods to labour economics; the other half was for the statistical theory around such methods.

Some critics question the quality of many real-time sources. High-frequency data are less accurate at estimating levels (for example, the total value of GDP) than they are at estimating changes, and in particular turning-points (such as when growth turns into recession). In a recent review of real-time indicators Samuel Tombs of Pantheon Macroeconomics, a consultancy, pointed out that OpenTable data tended to exaggerate the rebound in restaurant attendance last year.

Others have worries about the new incentives facing economists. Researchers now race to post a working paper with America’s National Bureau of Economic Research in order to stake their claim to an area of study or to influence policymakers. The downside is that consumers of fast-food academic research often treat it as if it is as rigorous as the slow-cooked sort—papers which comply with the old-fashioned publication process involving endless seminars and peer review. A number of papers using high-frequency data which generated lots of clicks, including one which claimed that a motorcycle rally in South Dakota had caused a spike in covid cases, have since been called into question.

Whatever the concerns, the pandemic has given economists a new lease of life. During the Chilean coup of 1973 members of the armed forces broke into Cybersyn’s operations room and smashed up the slides of graphs—not only because it was Allende’s creation, but because the idea of an electrocardiogram of the economy just seemed a bit weird. Third-wave economics is still unusual, but ever less odd. ■

Cálculos mostram que será impossível controlar uma Inteligência Artificial super inteligente (Engenharia é:)

engenhariae.com.br

Ademilson Ramos, 23 de janeiro de 2021


Foto de Alex Knight no Unsplash

A ideia da inteligência artificial derrubar a humanidade tem sido discutida por muitas décadas, e os cientistas acabaram de dar seu veredicto sobre se seríamos capazes de controlar uma superinteligência de computador de alto nível. A resposta? Quase definitivamente não.

O problema é que controlar uma superinteligência muito além da compreensão humana exigiria uma simulação dessa superinteligência que podemos analisar. Mas se não formos capazes de compreendê-lo, é impossível criar tal simulação.

Regras como ‘não causar danos aos humanos’ não podem ser definidas se não entendermos o tipo de cenário que uma IA irá criar, sugerem os pesquisadores. Uma vez que um sistema de computador está trabalhando em um nível acima do escopo de nossos programadores, não podemos mais estabelecer limites.

“Uma superinteligência apresenta um problema fundamentalmente diferente daqueles normalmente estudados sob a bandeira da ‘ética do robô’”, escrevem os pesquisadores.

“Isso ocorre porque uma superinteligência é multifacetada e, portanto, potencialmente capaz de mobilizar uma diversidade de recursos para atingir objetivos que são potencialmente incompreensíveis para os humanos, quanto mais controláveis.”

Parte do raciocínio da equipe vem do problema da parada apresentado por Alan Turing em 1936. O problema centra-se em saber se um programa de computador chegará ou não a uma conclusão e responderá (para que seja interrompido), ou simplesmente ficar em um loop eterno tentando encontrar uma.

Como Turing provou por meio de uma matemática inteligente, embora possamos saber isso para alguns programas específicos, é logicamente impossível encontrar uma maneira que nos permita saber isso para cada programa potencial que poderia ser escrito. Isso nos leva de volta à IA, que, em um estado superinteligente, poderia armazenar todos os programas de computador possíveis em sua memória de uma vez.

Qualquer programa escrito para impedir que a IA prejudique humanos e destrua o mundo, por exemplo, pode chegar a uma conclusão (e parar) ou não – é matematicamente impossível para nós estarmos absolutamente seguros de qualquer maneira, o que significa que não pode ser contido.

“Na verdade, isso torna o algoritmo de contenção inutilizável”, diz o cientista da computação Iyad Rahwan, do Instituto Max-Planck para o Desenvolvimento Humano, na Alemanha.

A alternativa de ensinar alguma ética à IA e dizer a ela para não destruir o mundo – algo que nenhum algoritmo pode ter certeza absoluta de fazer, dizem os pesquisadores – é limitar as capacidades da superinteligência. Ele pode ser cortado de partes da Internet ou de certas redes, por exemplo.

O novo estudo também rejeita essa ideia, sugerindo que isso limitaria o alcance da inteligência artificial – o argumento é que se não vamos usá-la para resolver problemas além do escopo dos humanos, então por que criá-la?

Se vamos avançar com a inteligência artificial, podemos nem saber quando chega uma superinteligência além do nosso controle, tal é a sua incompreensibilidade. Isso significa que precisamos começar a fazer algumas perguntas sérias sobre as direções que estamos tomando.

“Uma máquina superinteligente que controla o mundo parece ficção científica”, diz o cientista da computação Manuel Cebrian, do Instituto Max-Planck para o Desenvolvimento Humano. “Mas já existem máquinas que executam certas tarefas importantes de forma independente, sem que os programadores entendam totalmente como as aprenderam.”

“Portanto, surge a questão de saber se isso poderia em algum momento se tornar incontrolável e perigoso para a humanidade.”

A pesquisa foi publicada no Journal of Artificial Intelligence Research.

The Petabyte Age: Because More Isn’t Just More — More Is Different (Wired)

WIRED Staff, Science, 06.23.2008 12:00 PM

Introduction: Sensors everywhere. Infinite storage. Clouds of processors. Our ability to capture, warehouse, and understand massive amounts of data is changing science, medicine, business, and technology. As our collection of facts and figures grows, so will the opportunity to find answers to fundamental questions. Because in the era of big data, more isn’t just more. […]

petabyte age
Marian Bantjes

Introduction:

Sensors everywhere. Infinite storage. Clouds of processors. Our ability to capture, warehouse, and understand massive amounts of data is changing science, medicine, business, and technology. As our collection of facts and figures grows, so will the opportunity to find answers to fundamental questions. Because in the era of big data, more isn’t just more. More is different.

The End of Theory:

The Data Deluge Makes the Scientific Method Obsolete

Feeding the Masses:
Data In, Crop Predictions Out

Chasing the Quark:
Sometimes You Need to Throw Information Away

Winning the Lawsuit:
Data Miners Dig for Dirt

Tracking the News:
A Smarter Way to Predict Riots and Wars

__Spotting the Hot Zones: __
Now We Can Monitor Epidemics Hour by Hour

__ Sorting the World:__
Google Invents New Way to Manage Data

__ Watching the Skies:__
Space Is Big — But Not Too Big to Map

Scanning Our Skeletons:
Bone Images Show Wear and Tear

Tracking Air Fares:
Elaborate Algorithms Predict Ticket Prices

Predicting the Vote:
Pollsters Identify Tiny Voting Blocs

Pricing Terrorism:
Insurers Gauge Risks, Costs

Visualizing Big Data:
Bar Charts for Words

Big data and the end of theory? (The Guardian)

theguardian.com

Mark Graham, Fri 9 Mar 2012 14.39 GM

Does big data have the answers? Maybe some, but not all, says Mark Graham

In 2008, Chris Anderson, then editor of Wired, wrote a provocative piece titled The End of Theory. Anderson was referring to the ways that computers, algorithms, and big data can potentially generate more insightful, useful, accurate, or true results than specialists or
domain experts who traditionally craft carefully targeted hypotheses
and research strategies.

This revolutionary notion has now entered not just the popular imagination, but also the research practices of corporations, states, journalists and academics. The idea being that the data shadows and information trails of people, machines, commodities and even nature can reveal secrets to us that we now have the power and prowess to uncover.

In other words, we no longer need to speculate and hypothesise; we simply need to let machines lead us to the patterns, trends, and relationships in social, economic, political, and environmental relationships.

It is quite likely that you yourself have been the unwitting subject of a big data experiment carried out by Google, Facebook and many other large Web platforms. Google, for instance, has been able to collect extraordinary insights into what specific colours, layouts, rankings, and designs make people more efficient searchers. They do this by slightly tweaking their results and website for a few million searches at a time and then examining the often subtle ways in which people react.

Most large retailers similarly analyse enormous quantities of data from their databases of sales (which are linked to you by credit card numbers and loyalty cards) in order to make uncanny predictions about your future behaviours. In a now famous case, the American retailer, Target, upset a Minneapolis man by knowing more about his teenage daughter’s sex life than he did. Target was able to predict his daughter’s pregnancy by monitoring her shopping patterns and comparing that information to an enormous database detailing billions of dollars of sales. This ultimately allows the company to make uncanny
predictions about its shoppers.

More significantly, national intelligence agencies are mining vast quantities of non-public Internet data to look for weak signals that might indicate planned threats or attacks.

There can by no denying the significant power and potentials of big data. And the huge resources being invested in both the public and private sectors to study it are a testament to this.

However, crucially important caveats are needed when using such datasets: caveats that, worryingly, seem to be frequently overlooked.

The raw informational material for big data projects is often derived from large user-generated or social media platforms (e.g. Twitter or Wikipedia). Yet, in all such cases we are necessarily only relying on information generated by an incredibly biased or skewed user-base.

Gender, geography, race, income, and a range of other social and economic factors all play a role in how information is produced and reproduced. People from different places and different backgrounds tend to produce different sorts of information. And so we risk ignoring a lot of important nuance if relying on big data as a social/economic/political mirror.

We can of course account for such bias by segmenting our data. Take the case of using Twitter to gain insights into last summer’s London riots. About a third of all UK Internet users have a twitter profile; a subset of that group are the active tweeters who produce the bulk of content; and then a tiny subset of that group (about 1%) geocode their tweets (essential information if you want to know about where your information is coming from).

Despite the fact that we have a database of tens of millions of data points, we are necessarily working with subsets of subsets of subsets. Big data no longer seems so big. Such data thus serves to amplify the information produced by a small minority (a point repeatedly made by UCL’s Muki Haklay), and skew, or even render invisible, ideas, trends, people, and patterns that aren’t mirrored or represented in the datasets that we work with.

Big data is undoubtedly useful for addressing and overcoming many important issues face by society. But we need to ensure that we aren’t seduced by the promises of big data to render theory unnecessary.

We may one day get to the point where sufficient quantities of big data can be harvested to answer all of the social questions that most concern us. I doubt it though. There will always be digital divides; always be uneven data shadows; and always be biases in how information and technology are used and produced.

And so we shouldn’t forget the important role of specialists to contextualise and offer insights into what our data do, and maybe more importantly, don’t tell us.

Mark Graham is a research fellow at the Oxford Internet Institute and is one of the creators of the Floating Sheep blog

The End of Theory: The Data Deluge Makes the Scientific Method Obsolete (Wired)

wired.com

Chris Anderson, Science, 06.23.2008 12:00 PM


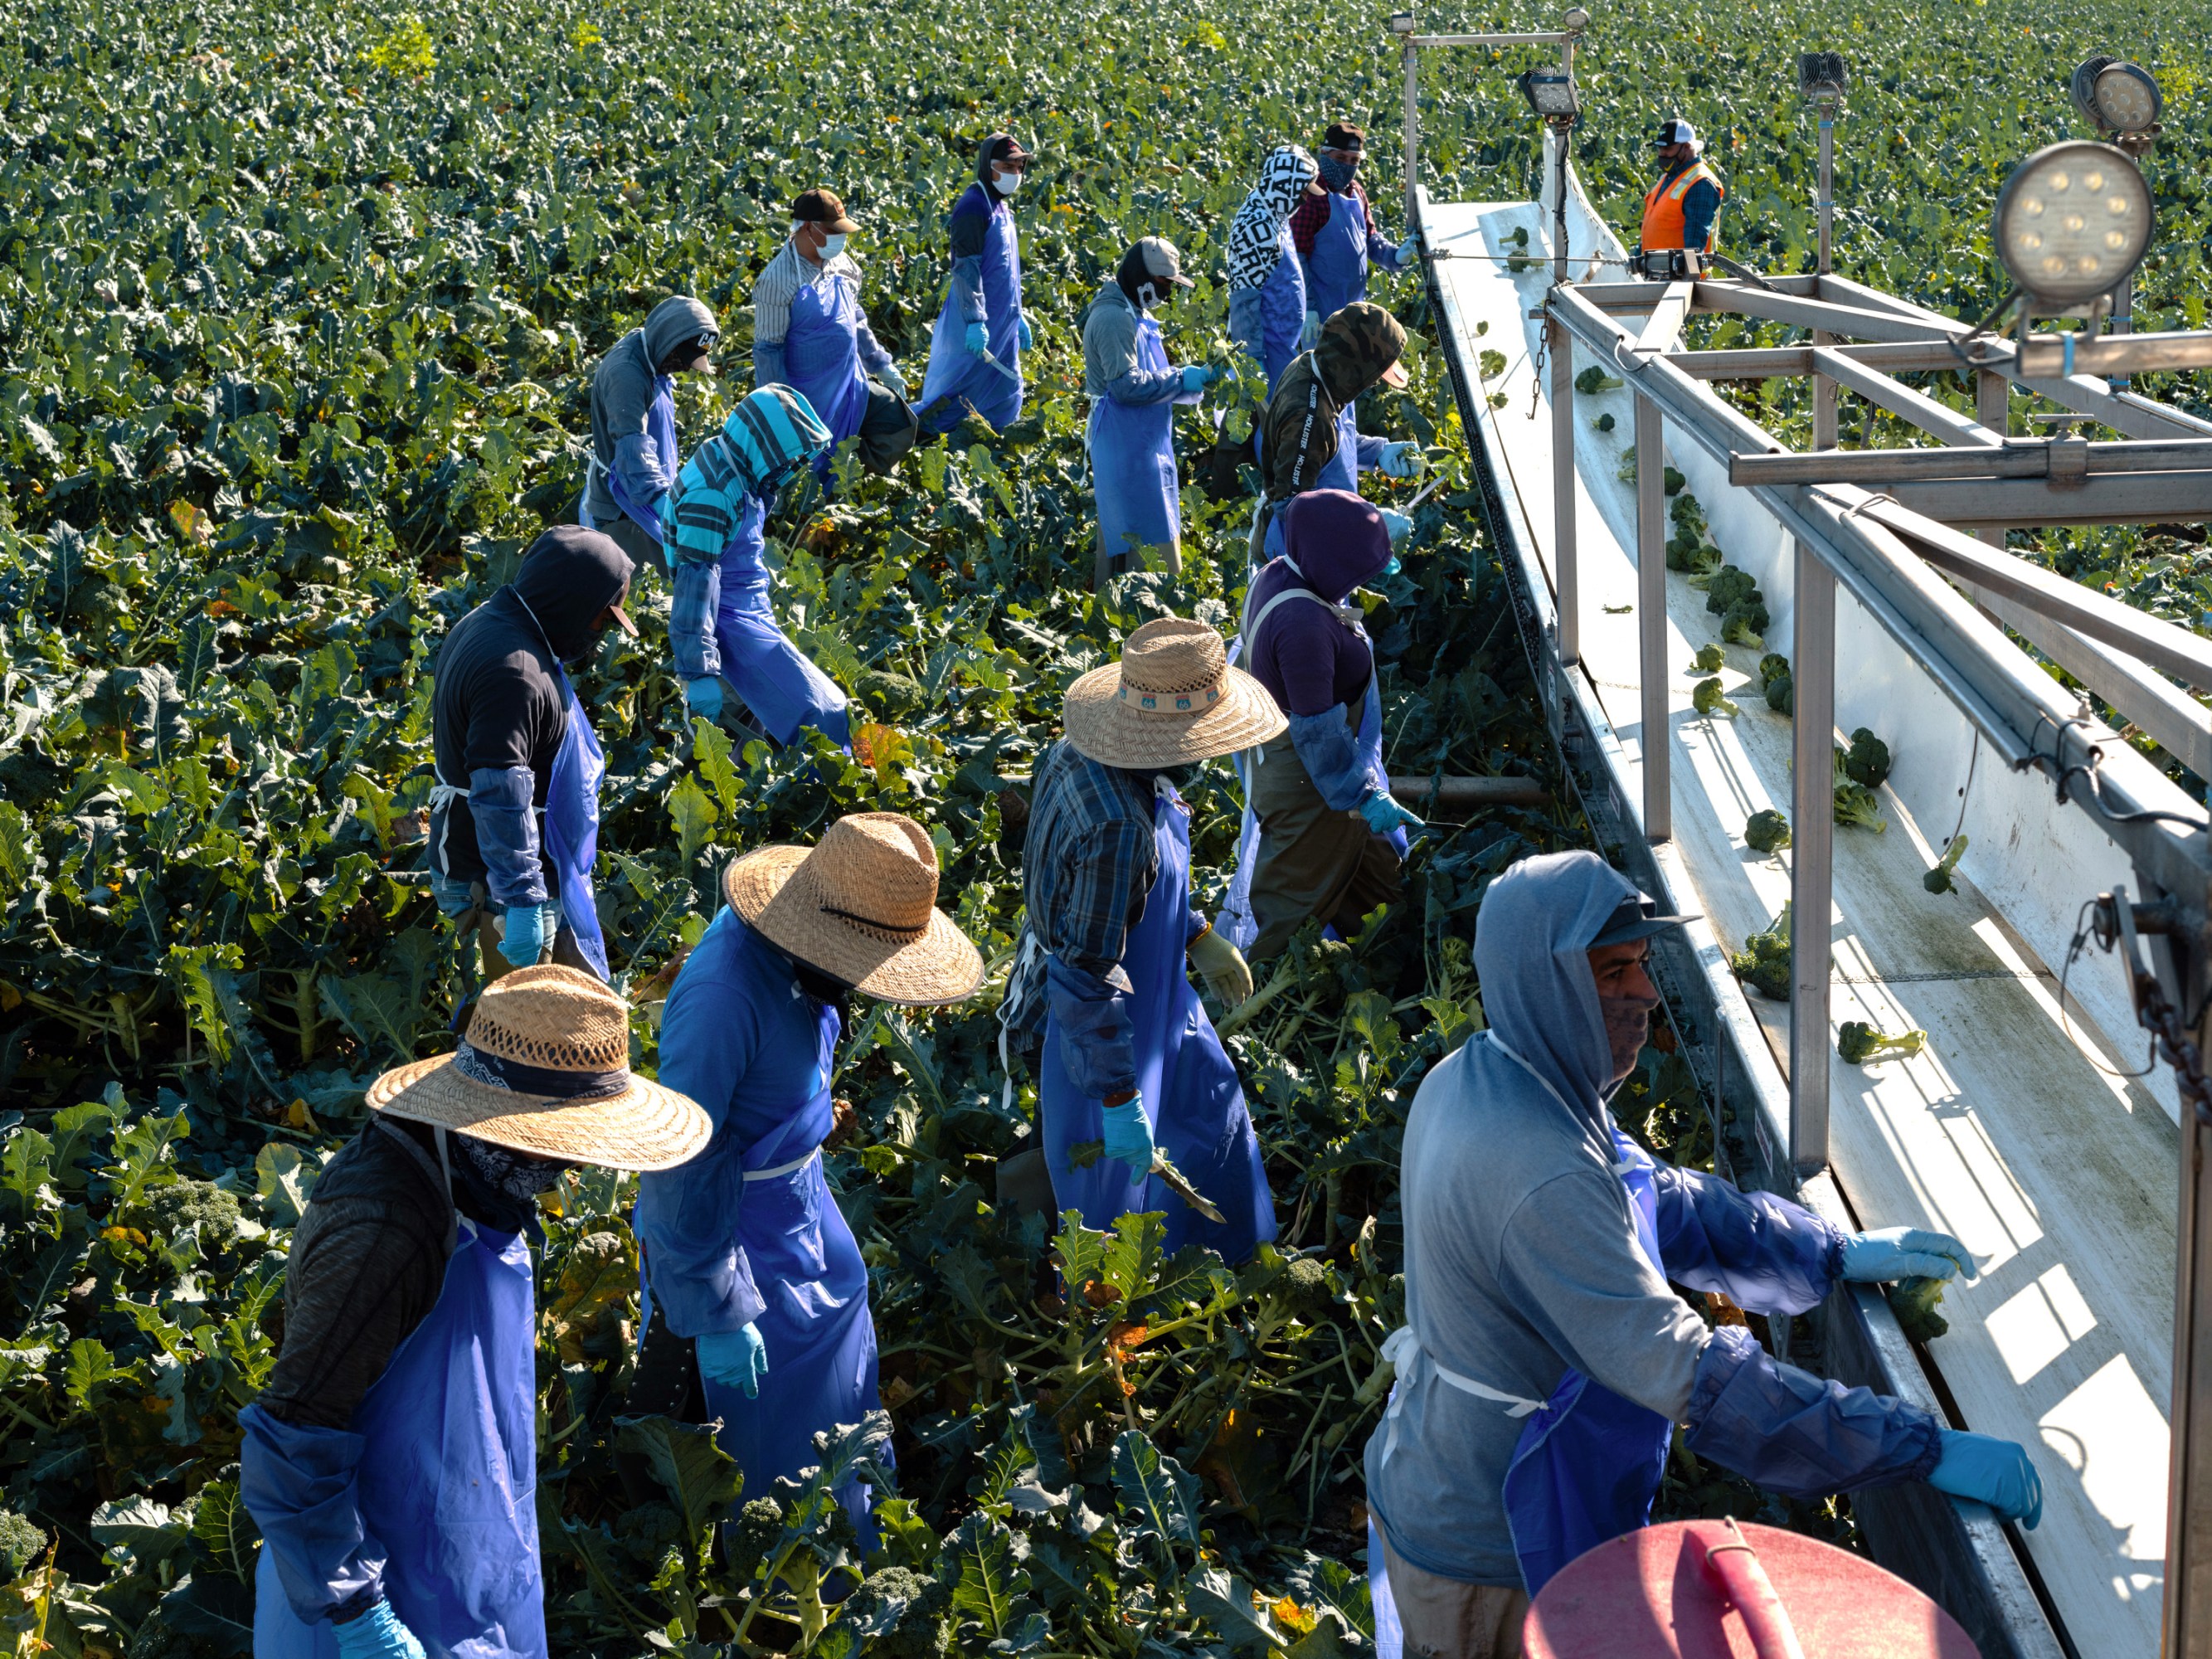
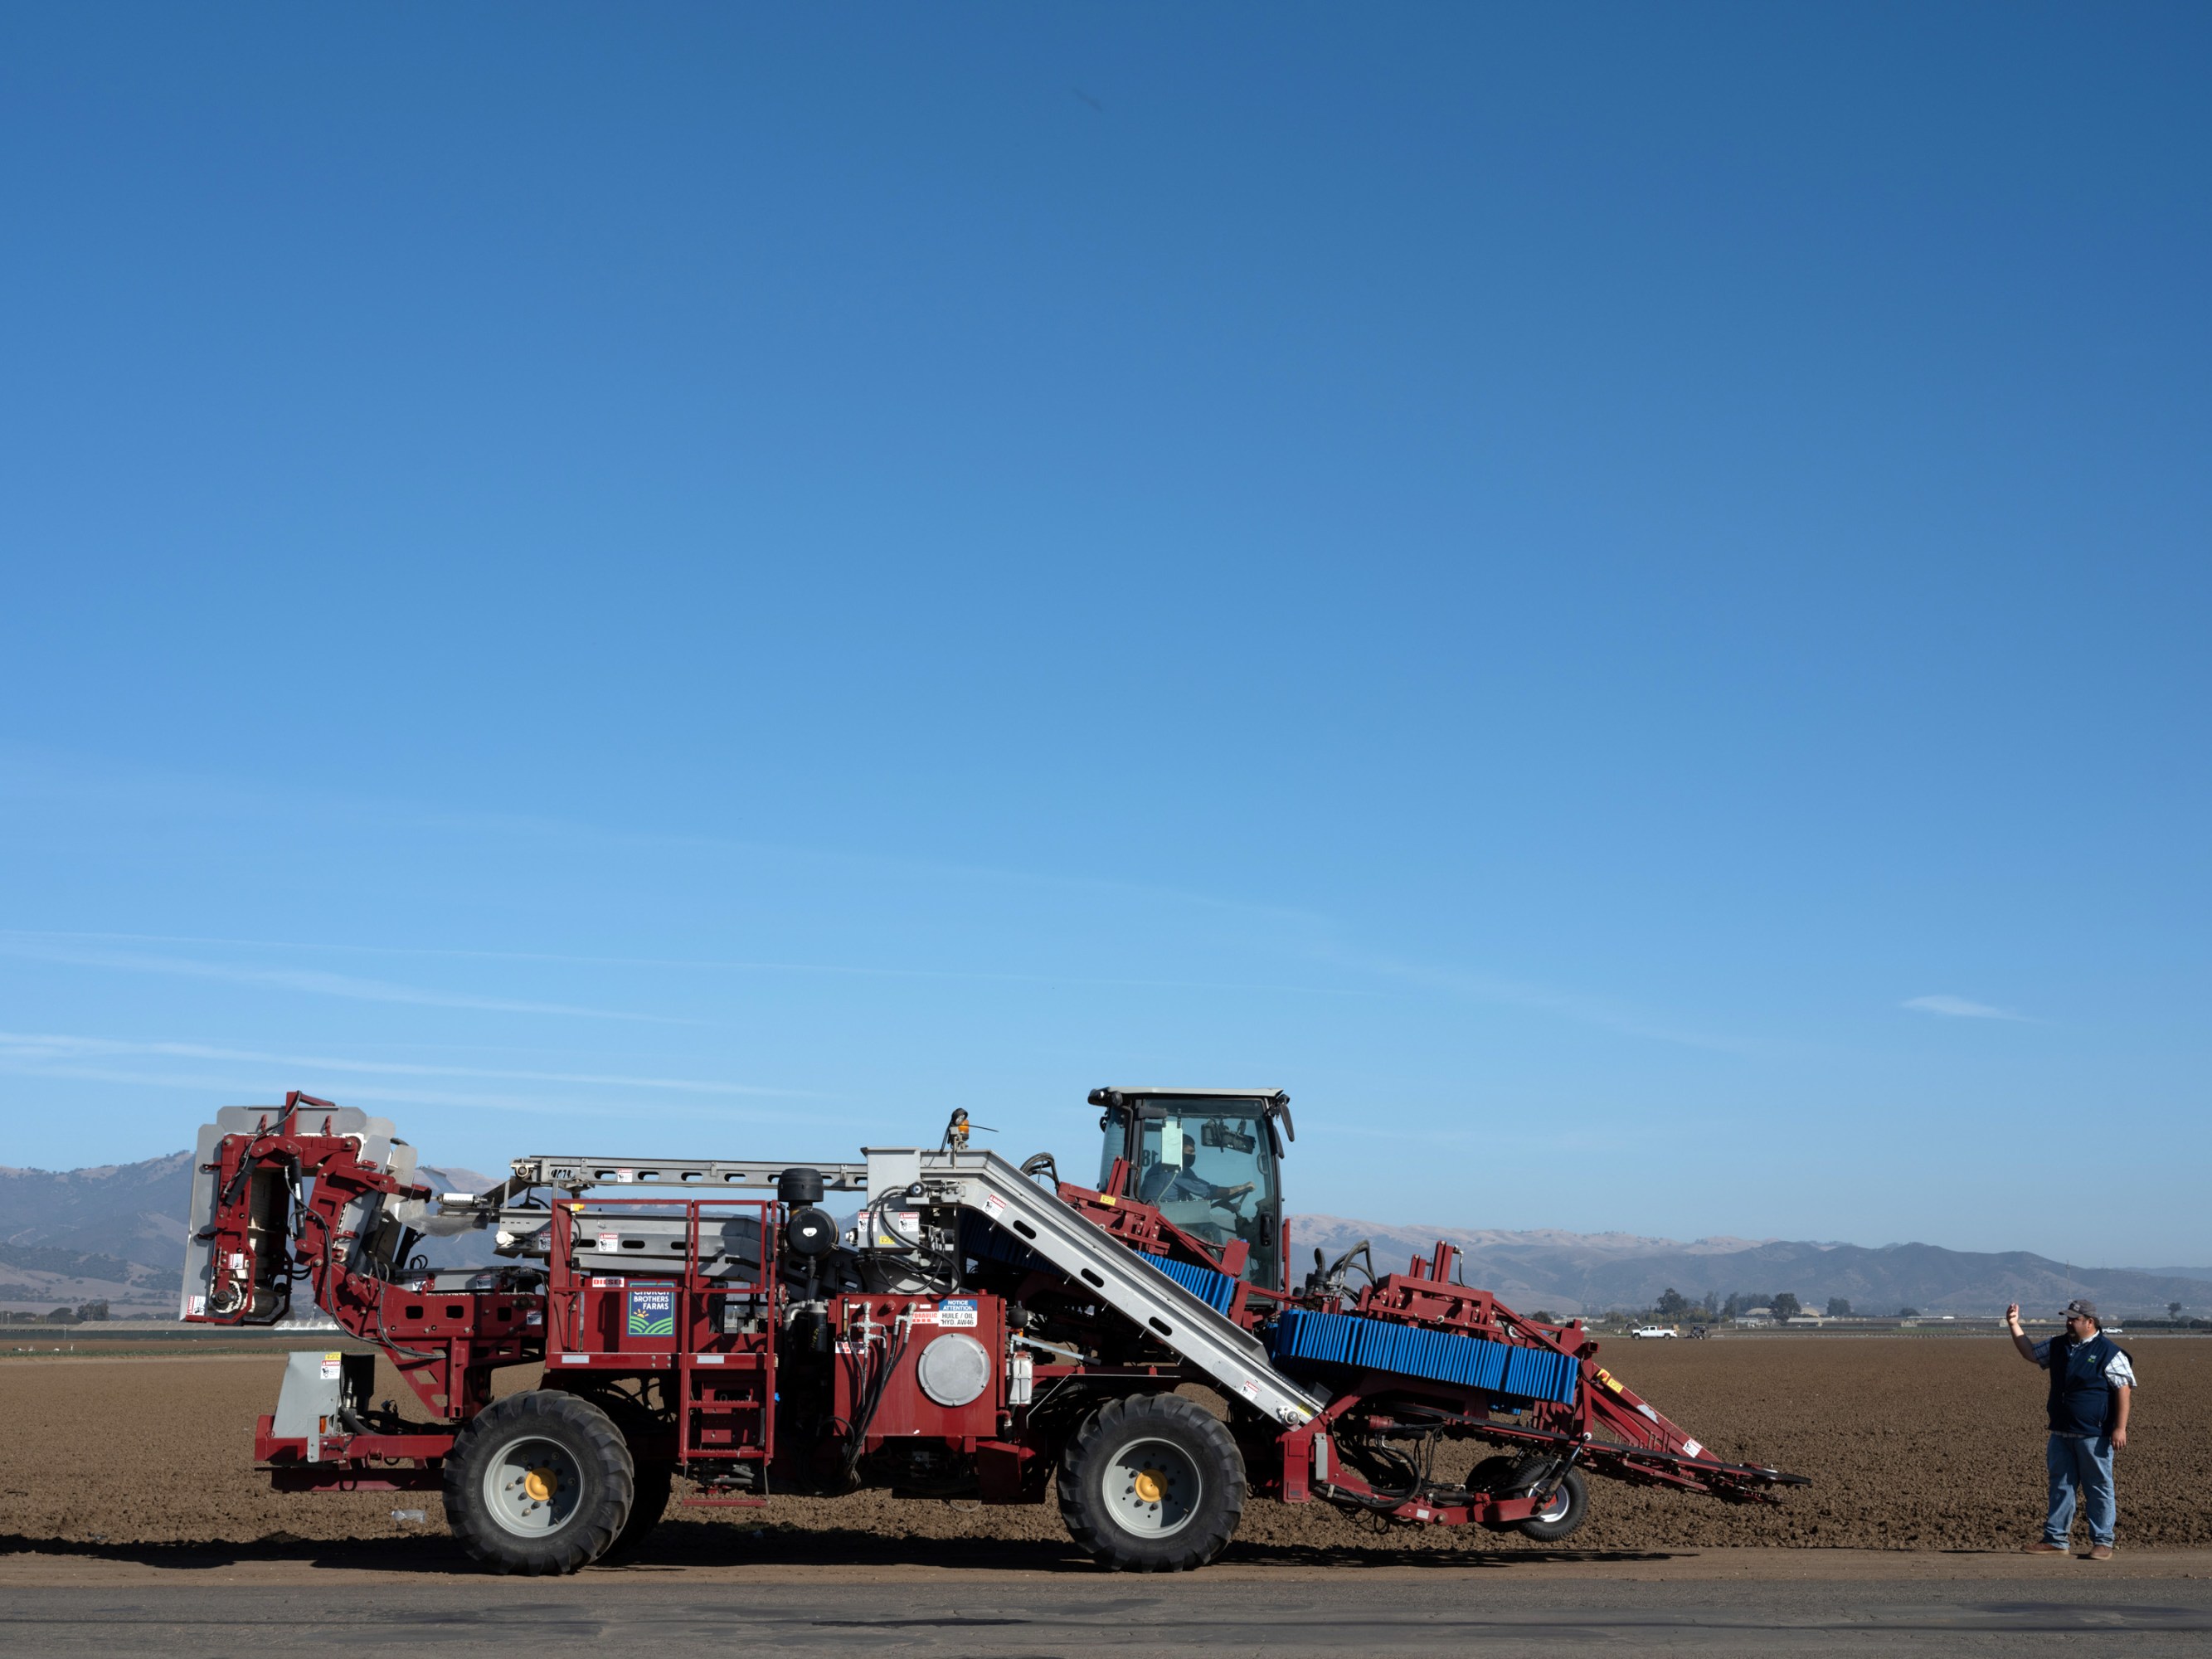
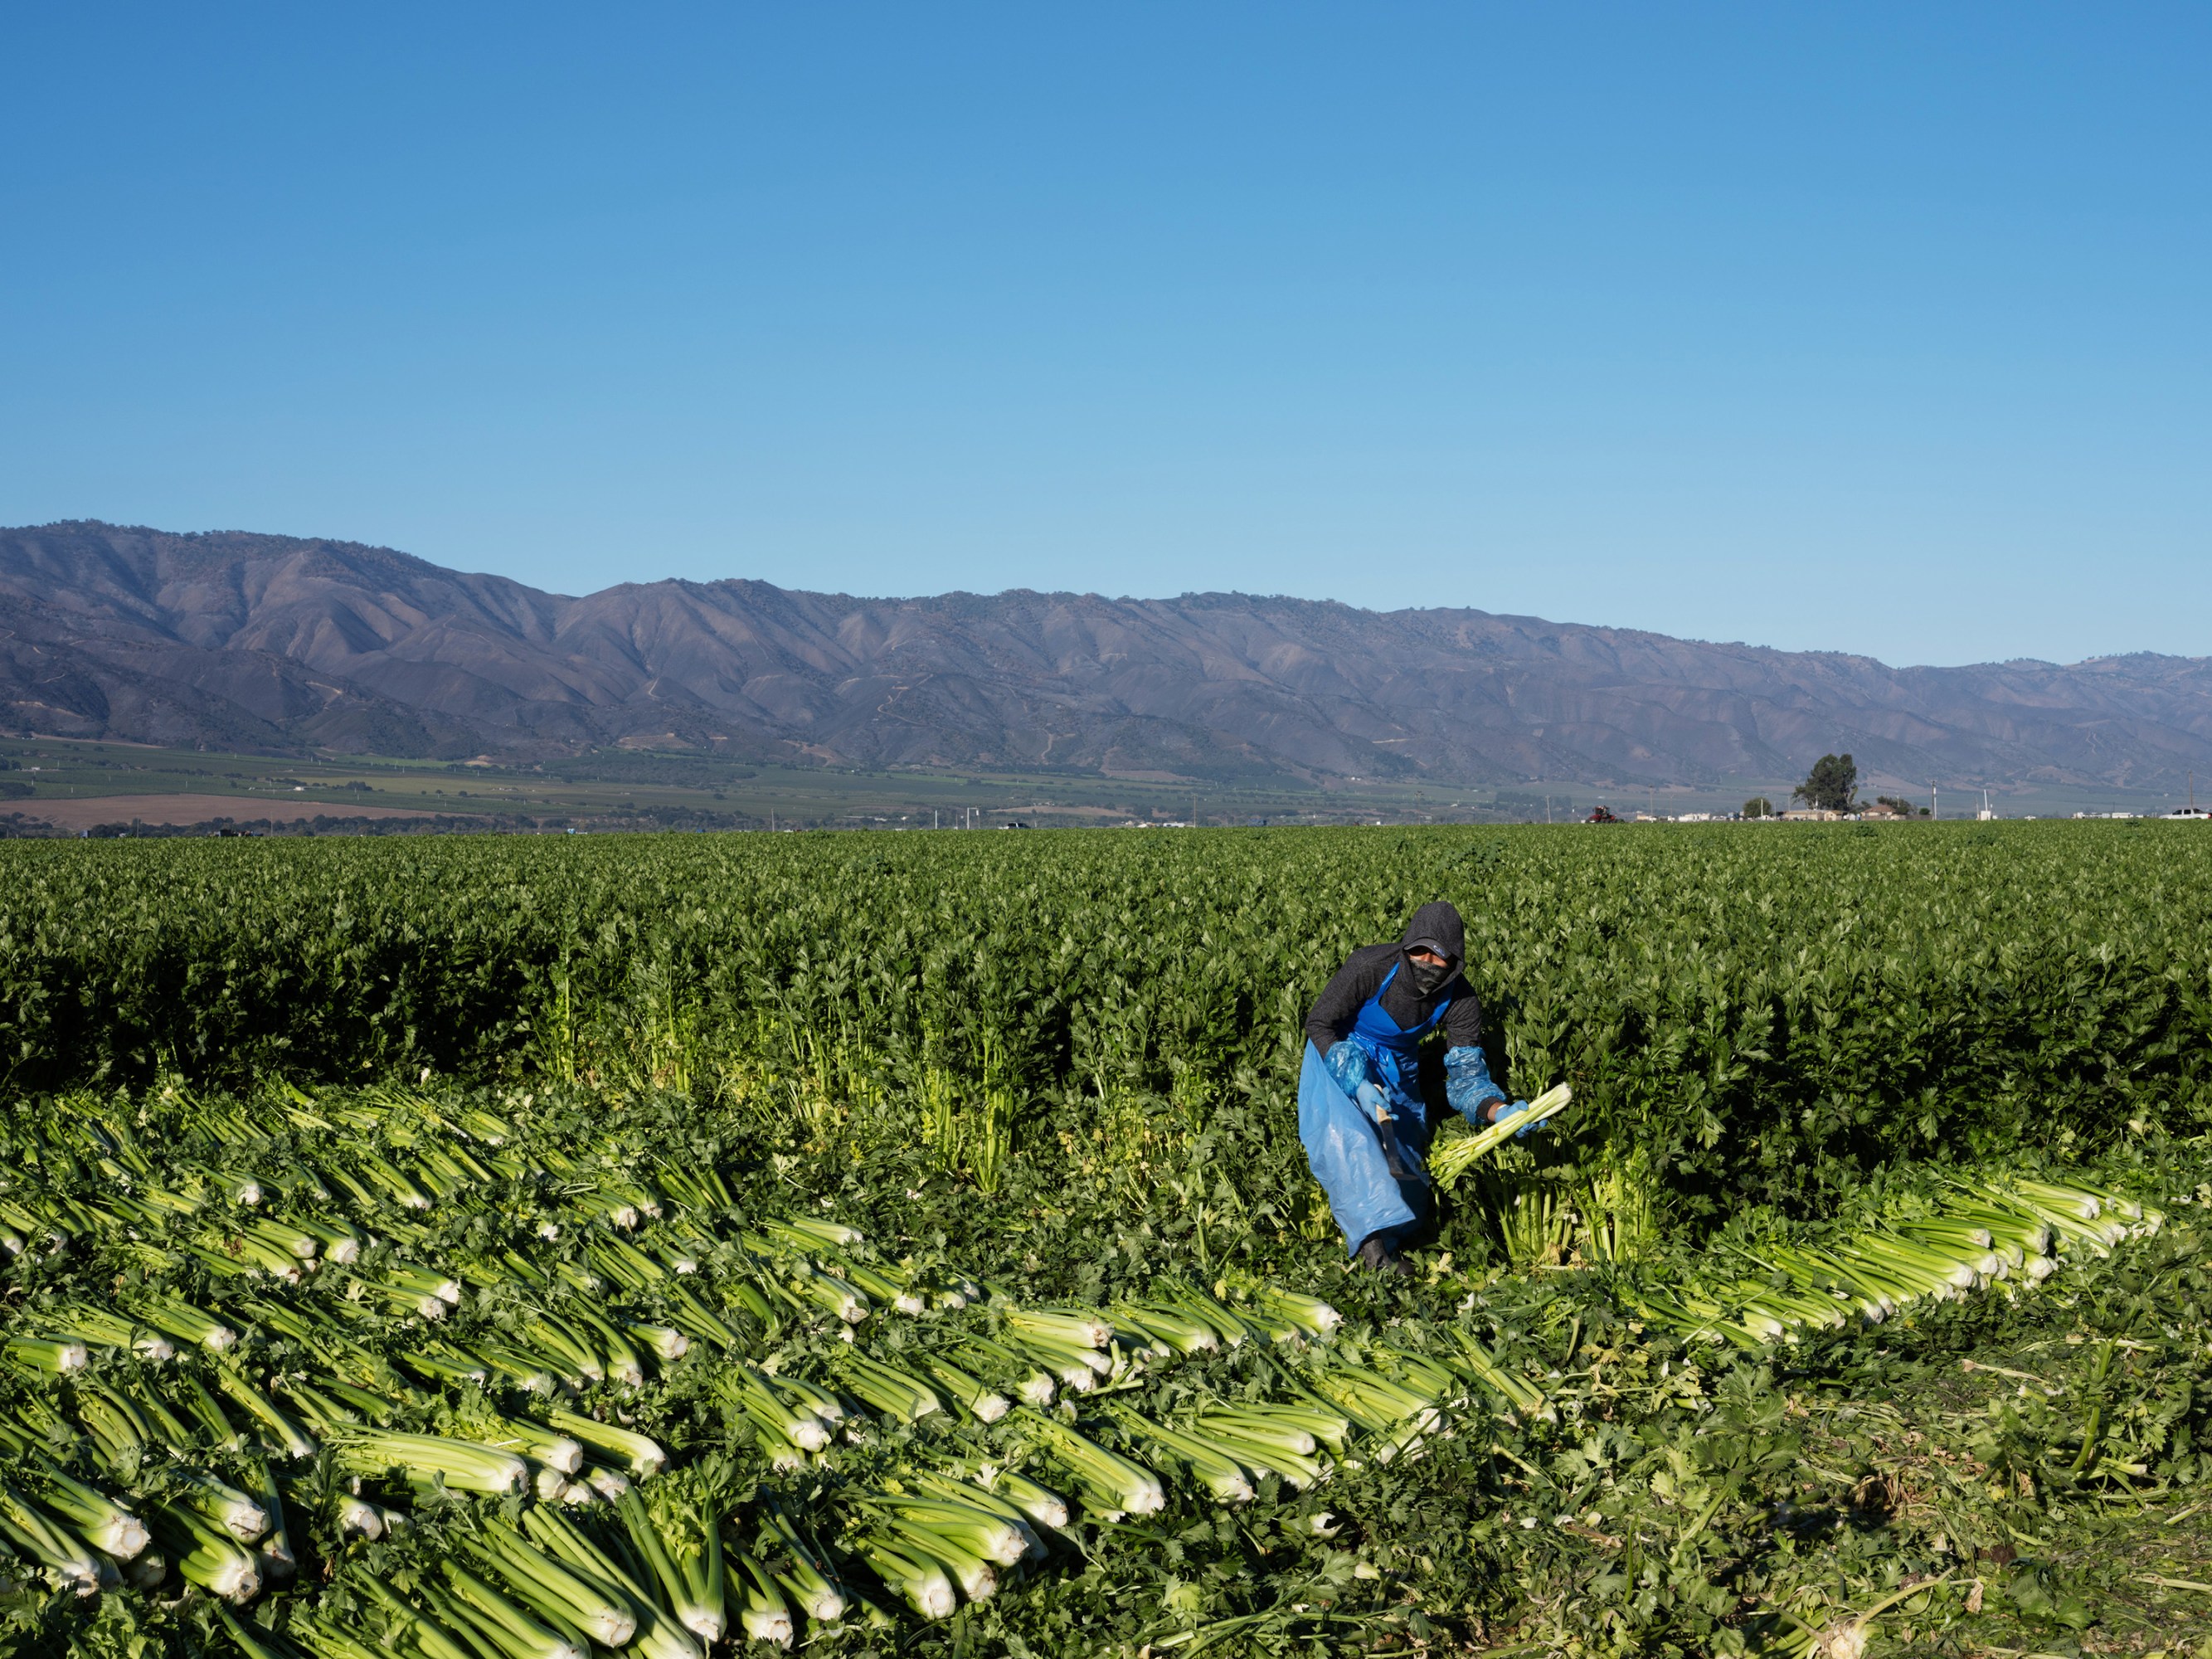
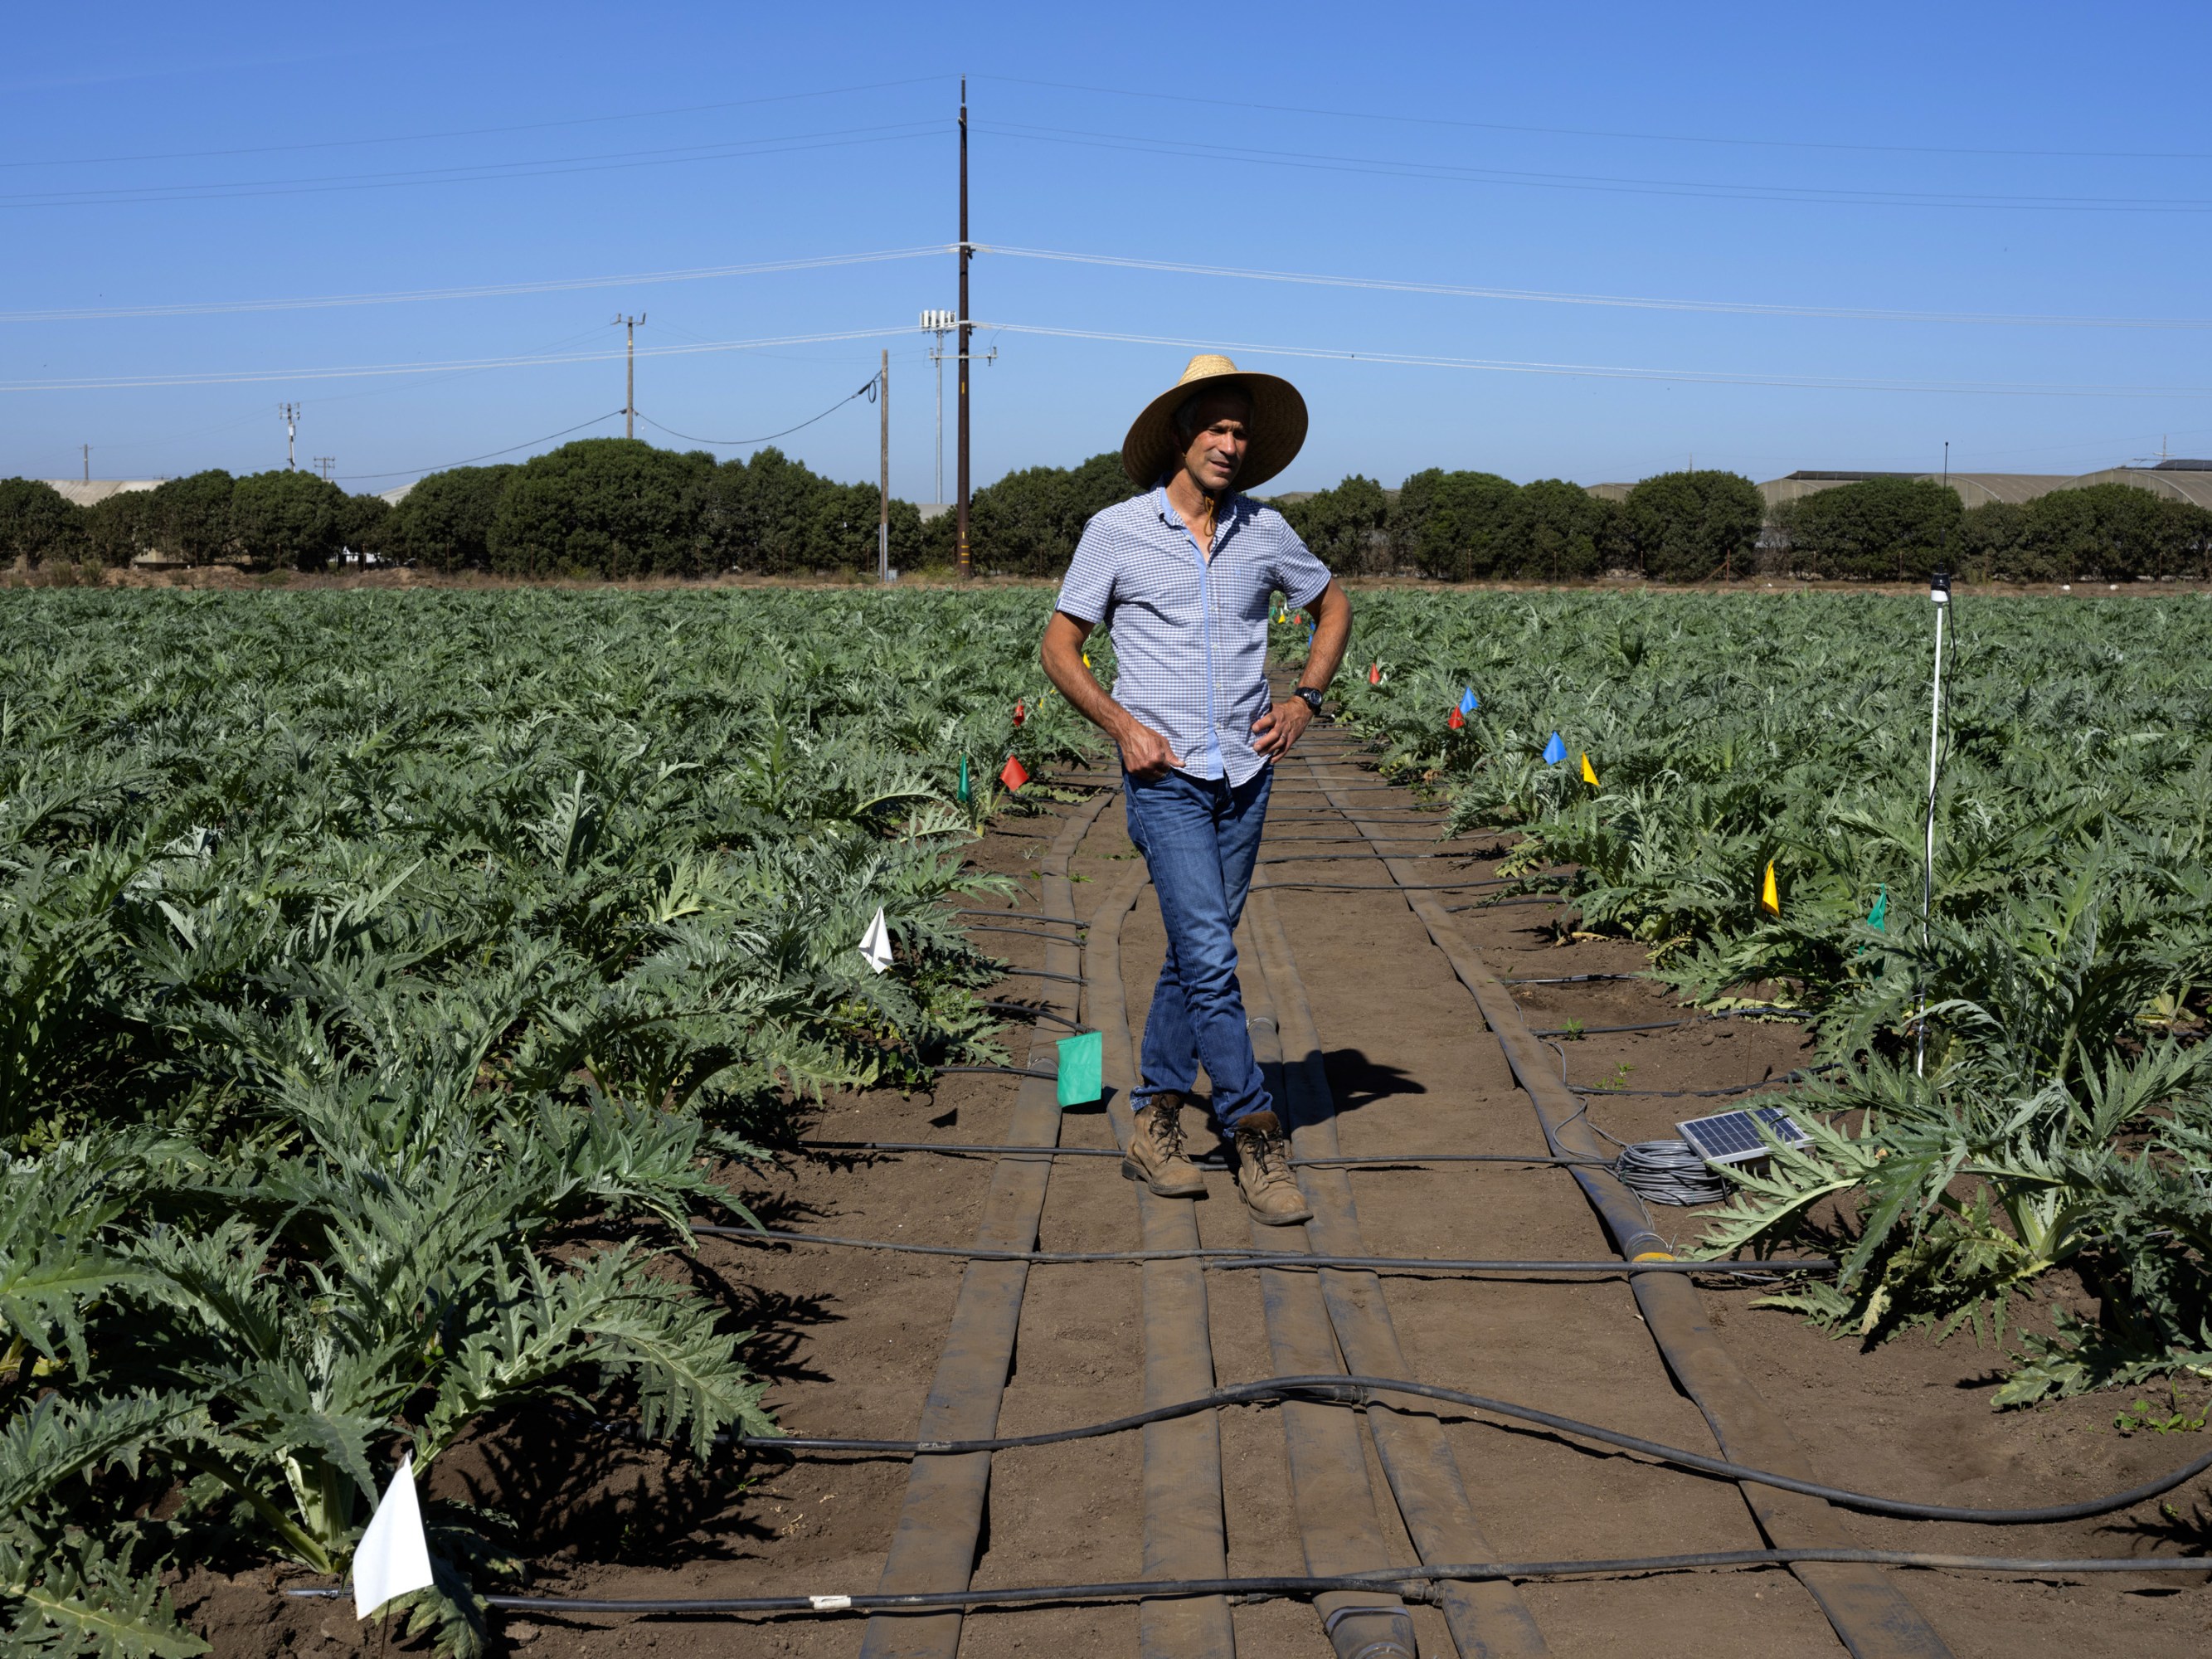
Illustration: Marian Bantjes “All models are wrong, but some are useful.”

So proclaimed statistician George Box 30 years ago, and he was right. But what choice did we have? Only models, from cosmological equations to theories of human behavior, seemed to be able to consistently, if imperfectly, explain the world around us. Until now. Today companies like Google, which have grown up in an era of massively abundant data, don’t have to settle for wrong models. Indeed, they don’t have to settle for models at all.

Sixty years ago, digital computers made information readable. Twenty years ago, the Internet made it reachable. Ten years ago, the first search engine crawlers made it a single database. Now Google and like-minded companies are sifting through the most measured age in history, treating this massive corpus as a laboratory of the human condition. They are the children of the Petabyte Age.

The Petabyte Age is different because more is different. Kilobytes were stored on floppy disks. Megabytes were stored on hard disks. Terabytes were stored in disk arrays. Petabytes are stored in the cloud. As we moved along that progression, we went from the folder analogy to the file cabinet analogy to the library analogy to — well, at petabytes we ran out of organizational analogies.

At the petabyte scale, information is not a matter of simple three- and four-dimensional taxonomy and order but of dimensionally agnostic statistics. It calls for an entirely different approach, one that requires us to lose the tether of data as something that can be visualized in its totality. It forces us to view data mathematically first and establish a context for it later. For instance, Google conquered the advertising world with nothing more than applied mathematics. It didn’t pretend to know anything about the culture and conventions of advertising — it just assumed that better data, with better analytical tools, would win the day. And Google was right.

Google’s founding philosophy is that we don’t know why this page is better than that one: If the statistics of incoming links say it is, that’s good enough. No semantic or causal analysis is required. That’s why Google can translate languages without actually “knowing” them (given equal corpus data, Google can translate Klingon into Farsi as easily as it can translate French into German). And why it can match ads to content without any knowledge or assumptions about the ads or the content.

Speaking at the O’Reilly Emerging Technology Conference this past March, Peter Norvig, Google’s research director, offered an update to George Box’s maxim: “All models are wrong, and increasingly you can succeed without them.”

This is a world where massive amounts of data and applied mathematics replace every other tool that might be brought to bear. Out with every theory of human behavior, from linguistics to sociology. Forget taxonomy, ontology, and psychology. Who knows why people do what they do? The point is they do it, and we can track and measure it with unprecedented fidelity. With enough data, the numbers speak for themselves.

The big target here isn’t advertising, though. It’s science. The scientific method is built around testable hypotheses. These models, for the most part, are systems visualized in the minds of scientists. The models are then tested, and experiments confirm or falsify theoretical models of how the world works. This is the way science has worked for hundreds of years.

Scientists are trained to recognize that correlation is not causation, that no conclusions should be drawn simply on the basis of correlation between X and Y (it could just be a coincidence). Instead, you must understand the underlying mechanisms that connect the two. Once you have a model, you can connect the data sets with confidence. Data without a model is just noise.

But faced with massive data, this approach to science — hypothesize, model, test — is becoming obsolete. Consider physics: Newtonian models were crude approximations of the truth (wrong at the atomic level, but still useful). A hundred years ago, statistically based quantum mechanics offered a better picture — but quantum mechanics is yet another model, and as such it, too, is flawed, no doubt a caricature of a more complex underlying reality. The reason physics has drifted into theoretical speculation about n-dimensional grand unified models over the past few decades (the “beautiful story” phase of a discipline starved of data) is that we don’t know how to run the experiments that would falsify the hypotheses — the energies are too high, the accelerators too expensive, and so on.

Now biology is heading in the same direction. The models we were taught in school about “dominant” and “recessive” genes steering a strictly Mendelian process have turned out to be an even greater simplification of reality than Newton’s laws. The discovery of gene-protein interactions and other aspects of epigenetics has challenged the view of DNA as destiny and even introduced evidence that environment can influence inheritable traits, something once considered a genetic impossibility.

In short, the more we learn about biology, the further we find ourselves from a model that can explain it.

There is now a better way. Petabytes allow us to say: “Correlation is enough.” We can stop looking for models. We can analyze the data without hypotheses about what it might show. We can throw the numbers into the biggest computing clusters the world has ever seen and let statistical algorithms find patterns where science cannot.

The best practical example of this is the shotgun gene sequencing by J. Craig Venter. Enabled by high-speed sequencers and supercomputers that statistically analyze the data they produce, Venter went from sequencing individual organisms to sequencing entire ecosystems. In 2003, he started sequencing much of the ocean, retracing the voyage of Captain Cook. And in 2005 he started sequencing the air. In the process, he discovered thousands of previously unknown species of bacteria and other life-forms.

If the words “discover a new species” call to mind Darwin and drawings of finches, you may be stuck in the old way of doing science. Venter can tell you almost nothing about the species he found. He doesn’t know what they look like, how they live, or much of anything else about their morphology. He doesn’t even have their entire genome. All he has is a statistical blip — a unique sequence that, being unlike any other sequence in the database, must represent a new species.

This sequence may correlate with other sequences that resemble those of species we do know more about. In that case, Venter can make some guesses about the animals — that they convert sunlight into energy in a particular way, or that they descended from a common ancestor. But besides that, he has no better model of this species than Google has of your MySpace page. It’s just data. By analyzing it with Google-quality computing resources, though, Venter has advanced biology more than anyone else of his generation.

This kind of thinking is poised to go mainstream. In February, the National Science Foundation announced the Cluster Exploratory, a program that funds research designed to run on a large-scale distributed computing platform developed by Google and IBM in conjunction with six pilot universities. The cluster will consist of 1,600 processors, several terabytes of memory, and hundreds of terabytes of storage, along with the software, including IBM’s Tivoli and open source versions of Google File System and MapReduce.111 Early CluE projects will include simulations of the brain and the nervous system and other biological research that lies somewhere between wetware and software.

Learning to use a “computer” of this scale may be challenging. But the opportunity is great: The new availability of huge amounts of data, along with the statistical tools to crunch these numbers, offers a whole new way of understanding the world. Correlation supersedes causation, and science can advance even without coherent models, unified theories, or really any mechanistic explanation at all.

There’s no reason to cling to our old ways. It’s time to ask: What can science learn from Google?

Chris Anderson (canderson@wired.com) is the editor in chief of Wired.

Related The Petabyte Age: Sensors everywhere. Infinite storage. Clouds of processors. Our ability to capture, warehouse, and understand massive amounts of data is changing science, medicine, business, and technology. As our collection of facts and figures grows, so will the opportunity to find answers to fundamental questions. Because in the era of big data, more isn’t just more. More is different.

Correction:
1 This story originally stated that the cluster software would include the actual Google File System.
06.27.08

Zizek: Podemos vencer as cidades pós-humanas (Outras Palavras)

Em Nova York, constrói-se, agora, uma distopia: não haverá contato social; as maiorias sobreviverão de trabalhos braçais e subalternos; corporações e Estado controlarão os inseridos. Alternativa: incorporar as novas tecnologias ao Comum

Outras Palavras Tecnologia em Disputa

Por Slavoj Žižek – publicado 21/05/2020 às 21:49 – Atualizado 21/05/2020 às 22:06

Por Slavoj Zizek | Tradução de Simone Paz

As funções básicas do Estado de Nova York, muito em breve, poderão ser “reimaginadas” graças à aliança do governador Andrew Cuomo com a Big Tech personificada. Seria este o campo de testes para um futuro distópico sem contato físico?

Parece que a escolha básica que nos resta para lidar com a pandemia se reduz a duas opções: uma é ao estilo de Trump (com uma volta à atividade econômica sob as condições de liberdade de mercado e lucratividade, mesmo que isso traga milhares de mortes a mais); a outra é a que nossa mídia chama de o “jeitinho chinês” (um controle estatal, total e digitalizado, dos indivíduos).

Entretanto, nos EUA, ainda existe uma terceira opção, que vem sendo divulgada pelo governador de Nova York, Andrew Cuomo, e pelo ex-CEO do Google, Eric Schmidt — em conjunto com Michael Bloomberg e Bill Gates e sua esposa Melinda, nos bastidores. Naomi Klein e o The Intercept chamam essa alternativa de Screen New Deal [alusão jocosa ao Green New Deal, que pressupõe uma Virada Sócioambiental. Screen New Deal seria algo como Virada para dentro das Telas] Ele vem com a promessa de manter o indivíduo a salvo das infecções, mantendo todas as liberdades pessoais que interessam aos liberais — mas será que tem chances de funcionar?

Em uma de suas reflexões sobre a morte, o comediante de stand-up Anthony Jeselnik fala sobre sua avó: “Nós achávamos que ela tinha morrido feliz, enquanto dormia. Mas a autópsia revelou uma verdade horrível: ela morreu durante a autópsia”. Esse é o problema da autópsia de Eric Schmidt sobre nossa situação: a autópsia e suas implicações tornam nossa situação muito mais catastrófica do que é para ser.

Cuomo e Schmidt anunciaram um projeto para “reimaginar a realidade pós-Covid do estado de Nova York, com ênfase na integração permanente da tecnologia em todos os aspectos da vida cívica”. Na visão de Klein, isso levará a um “futuro-sem-contato permanente, altamente lucrativo”, no qual não existirá o dinheiro vivo, nem a necessidade de sair de casa para gastá-lo. Todos os serviços e mercadorias possíveis poderão ser encomendados pela internet, entregues por drone, e “compartilhados numa tela, por meio de uma plataforma”. E, para fazer esse futuro funcionar, seria necessário explorar massivamente “trabalhadores anônimos aglomerados em armazéns, data centers, fábricas de moderação de conteúdo, galpões de manufatura de eletrônicos, minas de lítio, fazendas industriais, plantas de processamento de carne, e prisões”. Existem dois aspectos cruciais que chamam a atenção nesta descrição logo de cara.

O primeiro é o paradoxo de que os privilegiados que poderão usufruir de uma vida nos ambientes sem contato serão, também, os mais controlados: toda a vida deles estará nua à verdadeira sede do poder, à combinação do governo com a Big Tech. Está certo que as redes que são a alma de nossa existência estejam nas mãos de empresas privadas como Google, Amazon e Apple? Empresas que, fundidas com agências de segurança estatais, terão a capacidade de censurar e manipular os dados disponíveis para nós ou mesmo nos desconectar do espaço público? Lembre-se de que Schmidt e Cuomo recebem imensos investimentos públicos nessas empresas — então, não deveria o público ter também acesso a elas e poder controlá-las? Em resumo, como propõe Klein, eles não deveriam ser transformados em serviços públicos sem fins lucrativos? Sem um movimento semelhante, a democracia, em qualquer sentido significativo, será de fato abolida, já que o componente básico de nossos bens comuns — o espaço compartilhado de nossa comunicação e interação — estará sob controle privado

O segundo aspecto é que o Screen New Deal intervém na luta de classes num ponto bem específico e preciso. A crise do vírus nos conscientizou completamente do papel crucial daqueles que David Harvey chamou de “nova classe trabalhadora”: cuidadores de todos os tipos, desde enfermeiros até aqueles que entregam comida e outros pacotes, ou os que esvaziam nossas lixeiras, etc. Para nós, que conseguimos nos auto-isolar, esses trabalhadores se tornaram nosso principal contato com outro, em sua forma corpórea, uma fonte de ajuda, mas também de possível contágio. O Screen New Deal não passa de um plano para minimizar o papel visível dessa classe de cuidadores, que deve permanecer não-isolada, praticamente desprotegida, expondo-se ao perigo viral, para que nós, os privilegiados, possamos sobreviver em segurança — alguns até sonham com a possibilidade de que robôs passem a tomar conta dos idosos e lhes façam companhia… Mas esses cuidadores invisíveis podem se rebelar, exigindo maior proteção: na indústria de frigoríficos nos EUA, milhares de trabalhadores tiveram a covid, e dezenas morreram; e coisas semelhantes estão acontecendo na Alemanha. Agora, novas formas de luta de classes vão surgir

Se levarmos esse projeto à sua conclusão hiperbólica, ao final do Screen New Deal existe a ideia de um cérebro conectado, de nossos cérebros compartilhando diretamente experiências em uma Singularidade, uma espécie de autoconsciência coletiva divina. Elon Musk, outro gênio da tecnologia de nossos tempos, recentemente declarou que ele acredita que em questão de 10 anos a linguagem humana estará obsoleta e que, se alguém ainda a utilizar, será “por motivos sentimentais”. Como diretor da Neuralink, ele diz que planeja conectar um dispositivo ao cérebro humano dentro de 12 meses

Esse cenário, quando combinado com a extrapolação do futuro em casa de Naomi Klein, a partir das ambições dos simbiontes de Big Tech de Cuomo, não lembra a situação dos humanos no filme Matrix? Protegidos, fisicamente isolados e sem palavras em nossas bolhas de isolamento, estaremos mais unidos do que nunca, espiritualmente, enquanto os senhores da alta tecnologia lucram e uma multidão de milhões de humanos invisíveis faz o trabalho pesado — uma visão de pesadelo, se é que alguma vez existiu alguma

No Chile, durante os protestos que eclodiram em outubro de 2019, uma pichação num muro dizia: “Outro fim de mundo é possível”. Essa deveria ser nossa resposta para o Screen New Deal: sim, nosso mundo chegou ao fim, mas um futuro-sem-contato não é a única alternativa, outro fim de mundo é possível.

Coronavirus: The Hammer and the Dance (Medium)

What the Next 18 Months Can Look Like, if Leaders Buy Us Time

Tomas Pueyo – Mar 19, 2020

This article follows Coronavirus: Why You Must Act Now, with over 40 million views and 30 translations. If you agree with this article, consider signing the corresponding White House petition. Translations available in 27 languages at the bottom. Running list of endorsements here. 5 million views so far.

Summary of the article: Strong coronavirus measures today should only last a few weeks, there shouldn’t be a big peak of infections afterwards, and it can all be done for a reasonable cost to society, saving millions of lives along the way. If we don’t take these measures, tens of millions will be infected, many will die, along with anybody else that requires intensive care, because the healthcare system will have collapsed.

Within a week, countries around the world have gone from: “This coronavirus thing is not a big deal” to declaring the state of emergency. Yet many countries are still not doing much. Why?

Every country is asking the same question: How should we respond? The answer is not obvious to them.

Some countries, like France, Spain or Philippines, have since ordered heavy lockdowns. Others, like the US, UK, or Switzerland, have dragged their feet, hesitantly venturing into social distancing measures.

Here’s what we’re going to cover today, again with lots of charts, data and models with plenty of sources:

  1. What’s the current situation?
  2. What options do we have?
  3. What’s the one thing that matters now: Time
  4. What does a good coronavirus strategy look like?
  5. How should we think about the economic and social impacts?

When you’re done reading the article, this is what you’ll take away:

Our healthcare system is already collapsing.
Countries have two options: either they fight it hard now, or they will suffer a massive epidemic.
If they choose the epidemic, hundreds of thousands will die. In some countries, millions.
And that might not even eliminate further waves of infections.
If we fight hard now, we will curb the deaths.
We will relieve our healthcare system.
We will prepare better.
We will learn.
The world has never learned as fast about anything, ever.
And we need it, because we know so little about this virus.
All of this will achieve something critical: Buy Us Time.

If we choose to fight hard, the fight will be sudden, then gradual.
We will be locked in for weeks, not months.
Then, we will get more and more freedoms back.
It might not be back to normal immediately.
But it will be close, and eventually back to normal.
And we can do all that while considering the rest of the economy too.

Ok, let’s do this.

1. What’s the situation?

Last week, I showed this curve:

It showed coronavirus cases across the world outside of China. We could only discern Italy, Iran and South Korea. So I had to zoom in on the bottom right corner to see the emerging countries. My entire point is that they would soon be joining these 3 cases.

Let’s see what has happened since.

As predicted, the number of cases has exploded in dozens of countries. Here, I was forced to show only countries with over 1,000 cases. A few things to note:

  • Spain, Germany, France and the US all have more cases than Italy when it ordered the lockdown
  • An additional 16 countries have more cases today than Hubei when it went under lockdown: Japan, Malaysia, Canada, Portugal, Australia, Czechia, Brazil and Qatar have more than Hubei but below 1,000 cases. Switzerland, Sweden, Norway, Austria, Belgium, Netherlands and Denmark all have above 1,000 cases.

Do you notice something weird about this list of countries? Outside of China and Iran, which have suffered massive, undeniable outbreaks, and Brazil and Malaysia, every single country in this list is among the wealthiest in the world.

Do you think this virus targets rich countries? Or is it more likely that rich countries are better able to identify the virus?

It’s unlikely that poorer countries aren’t touched. Warm and humid weather probably helps, but doesn’t prevent an outbreak by itself — otherwise Singapore, Malaysia or Brazil wouldn’t be suffering outbreaks.

The most likely interpretations are that the coronavirus either took longer to reach these countries because they’re less connected, or it’s already there but these countries haven’t been able to invest enough on testing to know.

Either way, if this is true, it means that most countries won’t escape the coronavirus. It’s a matter of time before they see outbreaks and need to take measures.

What measures can different countries take?

2. What Are Our Options?

Since the article last week, the conversation has changed and many countries have taken measures. Here are some of the most illustrative examples:

Measures in Spain and France

In one extreme, we have Spain and France. This is the timeline of measures for Spain:

On Thursday, 3/12, the President dismissed suggestions that the Spanish authorities had been underestimating the health threat.
On Friday, they declared the State of Emergency.
On Saturday, measures were taken:

  • People can’t leave home except for key reasons: groceries, work, pharmacy, hospital, bank or insurance company (extreme justification)
  • Specific ban on taking kids out for a walk or seeing friends or family (except to take care of people who need help, but with hygiene and physical distance measures)
  • All bars and restaurants closed. Only take-home acceptable.
  • All entertainment closed: sports, movies, museums, municipal celebrations…
  • Weddings can’t have guests. Funerals can’t have more than a handful of people.
  • Mass transit remains open

On Monday, land borders were shut.

Some people see this as a great list of measures. Others put their hands up in the air and cry of despair. This difference is what this article will try to reconcile.

France’s timeline of measures is similar, except they took more time to apply them, and they are more aggressive now. For example, rent, taxes and utilities are suspended for small businesses.

Measures in the US and UK

The US and UK, like countries such as Switzerland, have dragged their feet in implementing measures. Here’s the timeline for the US:

  • Wednesday 3/11: travel ban.
  • Friday: National Emergency declared. No social distancing measures
  • Monday: the government urges the public to avoid restaurants or bars and attend events with more than 10 people. No social distancing measure is actually enforceable. It’s just a suggestion.

Lots of states and cities are taking the initiative and mandating much stricter measures.

The UK has seen a similar set of measures: lots of recommendations, but very few mandates.

These two groups of countries illustrate the two extreme approaches to fight the coronavirus: mitigation and suppression. Let’s understand what they mean.

Option 1: Do Nothing

Before we do that, let’s see what doing nothing would entail for a country like the US:

This fantastic epidemic calculator can help you understand what will happen under different scenarios. I’ve pasted below the graph the key factors that determine the behavior of the virus. Note that infected, in pink, peak in the tens of millions at a certain date. Most variables have been kept from the default. The only material changes are R from 2.2 to 2.4 (corresponds better to currently available information. See at the bottom of the epidemic calculator), fatality rate (4% due to healthcare system collapse. See details below or in the previous article), length of hospital stay (down from 20 to 10 days) and hospitalization rate (down from 20% to 14% based on severe and critical cases. Note the WHO calls out a 20% rate) based on our most recently available gathering of research. Note that these numbers don’t change results much. The only change that matters is the fatality rate.

If we do nothing: Everybody gets infected, the healthcare system gets overwhelmed, the mortality explodes, and ~10 million people die (blue bars). For the back-of-the-envelope numbers: if ~75% of Americans get infected and 4% die, that’s 10 million deaths, or around 25 times the number of US deaths in World War II.

You might wonder: “That sounds like a lot. I’ve heard much less than that!”

So what’s the catch? With all these numbers, it’s easy to get confused. But there’s only two numbers that matter: What share of people will catch the virus and fall sick, and what share of them will die. If only 25% are sick (because the others have the virus but don’t have symptoms so aren’t counted as cases), and the fatality rate is 0.6% instead of 4%, you end up with 500k deaths in the US.

If we don’t do anything, the number of deaths from the coronavirus will probably land between these two numbers. The chasm between these extremes is mostly driven by the fatality rate, so understanding it better is crucial. What really causes the coronavirus deaths?

How Should We Think about the Fatality Rate?

This is the same graph as before, but now looking at hospitalized people instead of infected and dead:

The light blue area is the number of people who would need to go to the hospital, and the darker blue represents those who need to go to the intensive care unit (ICU). You can see that number would peak at above 3 million.

Now compare that to the number of ICU beds we have in the US (50k today, we could double that repurposing other space). That’s the red dotted line.

No, that’s not an error.

That red dotted line is the capacity we have of ICU beds. Everyone above that line would be in critical condition but wouldn’t be able to access the care they need, and would likely die.

Instead of ICU beds you can also look at ventilators, but the result is broadly the same, since there are fewer than 100k ventilators in the US.

This is why people died in droves in Hubei and are now dying in droves in Italy and Iran. The Hubei fatality rate ended up better than it could have been because they built 2 hospitals nearly overnight. Italy and Iran can’t do the same; few, if any, other countries can. We’ll see what ends up happening there.

So why is the fatality rate close to 4%?

If 5% of your cases require intensive care and you can’t provide it, most of those people die. As simple as that.

Additionally, recent data suggests that US cases are more severe than in China.

I wish that was all, but it isn’t.

Collateral Damage

These numbers only show people dying from coronavirus. But what happens if all your healthcare system is collapsed by coronavirus patients? Others also die from other ailments.

What happens if you have a heart attack but the ambulance takes 50 minutes to come instead of 8 (too many coronavirus cases) and once you arrive, there’s no ICU and no doctor available? You die.

There are 4 million admissions to the ICU in the US every year, and 500k (~13%) of them die. Without ICU beds, that share would likely go much closer to 80%. Even if only 50% died, in a year-long epidemic you go from 500k deaths a year to 2M, so you’re adding 1.5M deaths, just with collateral damage.

If the coronavirus is left to spread, the US healthcare system will collapse, and the deaths will be in the millions, maybe more than 10 million.

The same thinking is true for most countries. The number of ICU beds and ventilators and healthcare workers are usually similar to the US or lower in most countries. Unbridled coronavirus means healthcare system collapse, and that means mass death.

Unbridled coronavirus means healthcare systems collapse, and that means mass death.

By now, I hope it’s pretty clear we should act. The two options that we have are mitigation and suppression. Both of them propose to “flatten the curve”, but they go about it very differently.

Option 2: Mitigation Strategy

Mitigation goes like this: “It’s impossible to prevent the coronavirus now, so let’s just have it run its course, while trying to reduce the peak of infections. Let’s just flatten the curve a little bit to make it more manageable for the healthcare system.

This chart appears in a very important paper published over the weekend from the Imperial College London. Apparently, it pushed the UK and US governments to change course.

It’s a very similar graph as the previous one. Not the same, but conceptually equivalent. Here, the “Do Nothing” situation is the black curve. Each one of the other curves are what would happen if we implemented tougher and tougher social distancing measures. The blue one shows the toughest social distancing measures: isolating infected people, quarantining people who might be infected, and secluding old people. This blue line is broadly the current UK coronavirus strategy, although for now they’re just suggesting it, not mandating it.

Here, again, the red line is the capacity for ICUs, this time in the UK. Again, that line is very close to the bottom. All that area of the curve on top of that red line represents coronavirus patients who would mostly die because of the lack of ICU resources.

Not only that, but by flattening the curve, the ICUs will collapse for months, increasing collateral damage.

You should be shocked. When you hear: “We’re going to do some mitigation” what they’re really saying is: “We will knowingly overwhelm the healthcare system, driving the fatality rate up by a factor of 10x at least.

You would imagine this is bad enough. But we’re not done yet. Because one of the key assumptions of this strategy is what’s called “Herd Immunity”.

Herd Immunity and Virus Mutation

The idea is that all the people who are infected and then recover are now immune to the virus. This is at the core of this strategy: “Look, I know it’s going to be hard for some time, but once we’re done and a few million people die, the rest of us will be immune to it, so this virus will stop spreading and we’ll say goodbye to the coronavirus. Better do it at once and be done with it, because our alternative is to do social distancing for up to a year and risk having this peak happen later anyways.

Except this assumes one thing: the virus doesn’t change too much. If it doesn’t change much, then lots of people do get immunity, and at some point the epidemic dies down

How likely is this virus to mutate?
It seems it already has.

This graph represents the different mutations of the virus. You can see that the initial strains started in purple in China and then spread. Each time you see a branching on the left graph, that is a mutation leading to a slightly different variant of the virus.

This should not be surprising: RNA-based viruses like the coronavirus or the flu tend to mutate around 100 times faster than DNA-based ones—although the coronavirus mutates more slowly than influenza viruses.

Not only that, but the best way for this virus to mutate is to have millions of opportunities to do so, which is exactly what a mitigation strategy would provide: hundreds of millions of people infected.

That’s why you have to get a flu shot every year. Because there are so many flu strains, with new ones always evolving, the flu shot can never protect against all strains.

Put in another way: the mitigation strategy not only assumes millions of deaths for a country like the US or the UK. It also gambles on the fact that the virus won’t mutate too much — which we know it does. And it will give it the opportunity to mutate. So once we’re done with a few million deaths, we could be ready for a few million more — every year. This corona virus could become a recurring fact of life, like the flu, but many times deadlier.

The best way for this virus to mutate is to have millions of opportunities to do so, which is exactly what a mitigation strategy would provide.

So if neither doing nothing and mitigation will work, what’s the alternative? It’s called suppression.

Option 3: Suppression Strategy

The Mitigation Strategy doesn’t try to contain the epidemic, just flatten the curve a bit. Meanwhile, the Suppression Strategy tries to apply heavy measures to quickly get the epidemic under control. Specifically:

  • Go hard right now. Order heavy social distancing. Get this thing under control.
  • Then, release the measures, so that people can gradually get back their freedoms and something approaching normal social and economic life can resume.

What does that look like?

All the model parameters are the same, except that there is an intervention around now to reduce the transmission rate to R=0.62, and because the healthcare system isn’t collapsed, the fatality rate goes down to 0.6%. I defined “around now” as having ~32,000 cases when implementing the measures (3x the official number as of today, 3/19). Note that this is not too sensitive to the R chosen. An R of 0.98 for example shows 15,000 deaths. Five times more than with an R of 0.62, but still tens of thousands of deaths and not millions. It’s also not too sensitive to the fatality rate: if it’s 0.7% instead of 0.6%, the death toll goes from 15,000 to 17,000. It’s the combination of a higher R, a higher fatality rate, and a delay in taking measures that explodes the number of fatalities. That’s why we need to take measures to reduce R today. For clarification, the famous R0 is R at the beginning (R at time 0). It’s the transmission rate when nobody is immune yet and there are no measures against it taken. R is the overall transmission rate.

Under a suppression strategy, after the first wave is done, the death toll is in the thousands, and not in the millions.

Why? Because not only do we cut the exponential growth of cases. We also cut the fatality rate since the healthcare system is not completely overwhelmed. Here, I used a fatality rate of 0.9%, around what we’re seeing in South Korea today, which has been most effective at following Suppression Strategy.

Said like this, it sounds like a no-brainer. Everybody should follow the Suppression Strategy.

So why do some governments hesitate?

They fear three things:

  1. This first lockdown will last for months, which seems unacceptable for many people.
  2. A months-long lockdown would destroy the economy.
  3. It wouldn’t even solve the problem, because we would be just postponing the epidemic: later on, once we release the social distancing measures, people will still get infected in the millions and die.

Here is how the Imperial College team modeled suppressions. The green and yellow lines are different scenarios of Suppression. You can see that doesn’t look good: We still get huge peaks, so why bother?

We’ll get to these questions in a moment, but there’s something more important before.

This is completely missing the point.

Presented like these, the two options of Mitigation and Suppression, side by side, don’t look very appealing. Either a lot of people die soon and we don’t hurt the economy today, or we hurt the economy today, just to postpone the deaths.

This ignores the value of time.

3. The Value of Time

In our previous post, we explained the value of time in saving lives. Every day, every hour we waited to take measures, this exponential threat continued spreading. We saw how a single day could reduce the total cases by 40% and the death toll by even more.

But time is even more valuable than that.

We’re about to face the biggest wave of pressure on the healthcare system ever seen in history. We are completely unprepared, facing an enemy we don’t know. That is not a good position for war.

What if you were about to face your worst enemy, of which you knew very little, and you had two options: Either you run towards it, or you escape to buy yourself a bit of time to prepare. Which one would you choose?

This is what we need to do today. The world has awakened. Every single day we delay the coronavirus, we can get better prepared. The next sections detail what that time would buy us:

Lower the Number of Cases

With effective suppression, the number of true cases would plummet overnight, as we saw in Hubei last week.

Source: Tomas Pueyo analysis over chart and data from the Journal of the American Medical Association

As of today, there are 0 daily new cases of coronavirus in the entire 60 million-big region of Hubei.

The diagnostics would keep going up for a couple of weeks, but then they would start going down. With fewer cases, the fatality rate starts dropping too. And the collateral damage is also reduced: fewer people would die from non-coronavirus-related causes because the healthcare system is simply overwhelmed.

Suppression would get us:

  • Fewer total cases of Coronavirus
  • Immediate relief for the healthcare system and the humans who run it
  • Reduction in fatality rate
  • Reduction in collateral damage
  • Ability for infected, isolated and quarantined healthcare workers to get better and back to work. In Italy, healthcare workers represent 8% of all contagions.

Understand the True Problem: Testing and Tracing

Right now, the UK and the US have no idea about their true cases. We don’t know how many there are. We just know the official number is not right, and the true one is in the tens of thousands of cases. This has happened because we’re not testing, and we’re not tracing.

  • With a few more weeks, we could get our testing situation in order, and start testing everybody. With that information, we would finally know the true extent of the problem, where we need to be more aggressive, and what communities are safe to be released from a lockdown.
  • New testing methods could speed up testing and drive costs down substantially.
  • We could also set up a tracing operation like the ones they have in China or other East Asia countries, where they can identify all the people that every sick person met, and can put them in quarantine. This would give us a ton of intelligence to release later on our social distancing measures: if we know where the virus is, we can target these places only. This is not rocket science: it’s the basics of how East Asia Countries have been able to control this outbreak without the kind of draconian social distancing that is increasingly essential in other countries.

The measures from this section (testing and tracing) single-handedly curbed the growth of the coronavirus in South Korea and got the epidemic under control, without a strong imposition of social distancing measures.

Build Up Capacity

The US (and presumably the UK) are about to go to war without armor.

We have masks for just two weeks, few personal protective equipments (“PPE”), not enough ventilators, not enough ICU beds, not enough ECMOs (blood oxygenation machines)… This is why the fatality rate would be so high in a mitigation strategy.

But if we buy ourselves some time, we can turn this around:

  • We have more time to buy equipment we will need for a future wave
  • We can quickly build up our production of masks, PPEs, ventilators, ECMOs, and any other critical device to reduce fatality rate.

Put in another way: we don’t need years to get our armor, we need weeks. Let’s do everything we can to get our production humming now. Countries are mobilized. People are being inventive, such as using 3D printing for ventilator parts. We can do it. We just need more time. Would you wait a few weeks to get yourself some armor before facing a mortal enemy?

This is not the only capacity we need. We will need health workers as soon as possible. Where will we get them? We need to train people to assist nurses, and we need to get medical workers out of retirement. Many countries have already started, but this takes time. We can do this in a few weeks, but not if everything collapses.

Lower Public Contagiousness

The public is scared. The coronavirus is new. There’s so much we don’t know how to do yet! People haven’t learned to stop hand-shaking. They still hug. They don’t open doors with their elbow. They don’t wash their hands after touching a door knob. They don’t disinfect tables before sitting.

Once we have enough masks, we can use them outside of the healthcare system too. Right now, it’s better to keep them for healthcare workers. But if they weren’t scarce, people should wear them in their daily lives, making it less likely that they infect other people when sick, and with proper training also reducing the likelihood that the wearers get infected. (In the meantime, wearing something is better than nothing.)

All of these are pretty cheap ways to reduce the transmission rate. The less this virus propagates, the fewer measures we’ll need in the future to contain it. But we need time to educate people on all these measures and equip them.

Understand the Virus

We know very very little about the virus. But every week, hundreds of new papers are coming.

The world is finally united against a common enemy. Researchers around the globe are mobilizing to understand this virus better.

How does the virus spread?
How can contagion be slowed down?
What is the share of asymptomatic carriers?
Are they contagious? How much?
What are good treatments?
How long does it survive?
On what surfaces?
How do different social distancing measures impact the transmission rate?
What’s their cost?
What are tracing best practices?
How reliable are our tests?

Clear answers to these questions will help make our response as targeted as possible while minimizing collateral economic and social damage. And they will come in weeks, not years.

Find Treatments

Not only that, but what if we found a treatment in the next few weeks? Any day we buy gets us closer to that. Right now, there are already several candidates, such as Favipiravir, Chloroquine, or Chloroquine combined with Azithromycin. What if it turned out that in two months we discovered a treatment for the coronavirus? How stupid would we look if we already had millions of deaths following a mitigation strategy?

Understand the Cost-Benefits

All of the factors above can help us save millions of lives. That should be enough. Unfortunately, politicians can’t only think about the lives of the infected. They must think about all the population, and heavy social distancing measures have an impact on others.

Right now we have no idea how different social distancing measures reduce transmission. We also have no clue what their economic and social costs are.

Isn’t it a bit difficult to decide what measures we need for the long term if we don’t know their cost or benefit?

A few weeks would give us enough time to start studying them, understand them, prioritize them, and decide which ones to follow.

Fewer cases, more understanding of the problem, building up assets, understanding the virus, understanding the cost-benefit of different measures, educating the public… These are some core tools to fight the virus, and we just need a few weeks to develop many of them. Wouldn’t it be dumb to commit to a strategy that throws us instead, unprepared, into the jaws of our enemy?

4. The Hammer and the Dance

Now we know that the Mitigation Strategy is probably a terrible choice, and that the Suppression Strategy has a massive short-term advantage.

But people have rightful concerns about this strategy:

  • How long will it actually last?
  • How expensive will it be?
  • Will there be a second peak as big as if we didn’t do anything?

Here, we’re going to look at what a true Suppression Strategy would look like. We can call it the Hammer and the Dance.

The Hammer

First, you act quickly and aggressively. For all the reasons we mentioned above, given the value of time, we want to quench this thing as soon as possible.

One of the most important questions is: How long will this last?

The fear that everybody has is that we will be locked inside our homes for months at a time, with the ensuing economic disaster and mental breakdowns. This idea was unfortunately entertained in the famous Imperial College paper:

Do you remember this chart? The light blue area that goes from end of March to end of August is the period that the paper recommends as the Hammer, the initial suppression that includes heavy social distancing.

If you’re a politician and you see that one option is to let hundreds of thousands or millions of people die with a mitigation strategy and the other is to stop the economy for five months before going through the same peak of cases and deaths, these don’t sound like compelling options.

But this doesn’t need to be so. This paper, driving policy today, has been brutally criticized for core flaws: They ignore contact tracing (at the core of policies in South Korea, China or Singapore among others) or travel restrictions (critical in China), ignore the impact of big crowds…

The time needed for the Hammer is weeks, not months.

This graph shows the new cases in the entire Hubei region (60 million people) every day since 1/23. Within 2 weeks, the country was starting to get back to work. Within ~5 weeks it was completely under control. And within 7 weeks the new diagnostics was just a trickle. Let’s remember this was the worst region in China.

Remember again that these are the orange bars. The grey bars, the true cases, had plummeted much earlier (see Chart 9).

The measures they took were pretty similar to the ones taken in Italy, Spain or France: isolations, quarantines, people had to stay at home unless there was an emergency or had to buy food, contact tracing, testing, more hospital beds, travel bans…

Details matter, however.

China’s measures were stronger. For example, people were limited to one person per household allowed to leave home every three days to buy food. Also, their enforcement was severe. It is likely that this severity stopped the epidemic faster.

In Italy, France and Spain, measures were not as drastic, and their implementation is not as tough. People still walk on the streets, many without masks. This is likely to result in a slower Hammer: more time to fully control the epidemic.

Some people interpret this as “Democracies will never be able to replicate this reduction in cases”. That’s wrong.

For several weeks, South Korea had the worst epidemic outside of China. Now, it’s largely under control. And they did it without asking people to stay home. They achieved it mostly with very aggressive testing, contact tracing, and enforced quarantines and isolations.

The following table gives a good sense of what measures different countries have followed, and how that has impacted them (this is a work-in-progress. Feedback welcome.)

This shows how countries who were prepared, with stronger epidemiological authority, education on hygiene and social distancing, and early detection and isolation, didn’t have to pay with heavier measures afterwards.

Conversely, countries like Italy, Spain or France weren’t doing these well, and had to then apply the Hammer with the hard measures at the bottom to catch up.

The lack of measures in the US and UK is in stark contrast, especially in the US. These countries are still not doing what allowed Singapore, South Korea or Taiwan to control the virus, despite their outbreaks growing exponentially. But it’s a matter of time. Either they have a massive epidemic, or they realize late their mistake, and have to overcompensate with a heavier Hammer. There is no escape from this.

But it’s doable. If an outbreak like South Korea’s can be controlled in weeks and without mandated social distancing, Western countries, which are already applying a heavy Hammer with strict social distancing measures, can definitely control the outbreak within weeks. It’s a matter of discipline, execution, and how much the population abides by the rules.

Once the Hammer is in place and the outbreak is controlled, the second phase begins: the Dance.

The Dance

If you hammer the coronavirus, within a few weeks you’ve controlled it and you’re in much better shape to address it. Now comes the longer-term effort to keep this virus contained until there’s a vaccine.

This is probably the single biggest, most important mistake people make when thinking about this stage: they think it will keep them home for months. This is not the case at all. In fact, it is likely that our lives will go back to close to normal.

The Dance in Successful Countries

How come South Korea, Singapore, Taiwan and Japan have had cases for a long time, in the case of South Korea thousands of them, and yet they’re not locked down home?Coronavirus: South Korea seeing a ‘stabilising trend’South Korea’s Foreign Minister, Kang Kyung-wha, says she thinks early testing has been the key to South Korea’s low…www.bbc.com

In this video, the South Korea Foreign Minister explains how her country did it. It was pretty simple: efficient testing, efficient tracing, travel bans, efficient isolating and efficient quarantining.

This paper explains Singapore’s approach:Interrupting transmission of COVID-19: lessons from containment efforts in SingaporeHighlight. Despite multiple importations resulting in local chains of transmission, Singapore has been able to control…academic.oup.com

Want to guess their measures? The same ones as in South Korea. In their case, they complemented with economic help to those in quarantine and travel bans and delays.

Is it too late for these countries and others? No. By applying the Hammer, they’re getting a new chance, a new shot at doing this right. The more they wait, the heavier and longer the hammer, but it can control the epidemics.

But what if all these measures aren’t enough?

The Dance of R

I call the months-long period between the Hammer and a vaccine or effective treatment the Dance because it won’t be a period during which measures are always the same harsh ones. Some regions will see outbreaks again, others won’t for long periods of time. Depending on how cases evolve, we will need to tighten up social distancing measures or we will be able to release them. That is the dance of R: a dance of measures between getting our lives back on track and spreading the disease, one of economy vs. healthcare.

How does this dance work?

It all turns around the R. If you remember, it’s the transmission rate. Early on in a standard, unprepared country, it’s somewhere between 2 and 3: During the few weeks that somebody is infected, they infect between 2 and 3 other people on average.

If R is above 1, infections grow exponentially into an epidemic. If it’s below 1, they die down.

During the Hammer, the goal is to get R as close to zero, as fast as possible, to quench the epidemic. In Wuhan, it is calculated that R was initially 3.9, and after the lockdown and centralized quarantine, it went down to 0.32.

But once you move into the Dance, you don’t need to do that anymore. You just need your R to stay below 1: a lot of the social distancing measures have true, hard costs on people. They might lose their job, their business, their healthy habits…

You can remain below R=1 with a few simple measures.

Detailed data, sources and assumptions here

This is an approximation of how different types of patients respond to the virus, as well as their contagiousness. Nobody knows the true shape of this curve, but we’ve gathered data from different papers to approximate how it looks like.

Every day after they contract the virus, people have some contagion potential. Together, all these days of contagion add up to 2.5 contagions on average.

It is believed that there are some contagions already happening during the “no symptoms” phase. After that, as symptoms grow, usually people go to the doctor, get diagnosed, and their contagiousness diminishes.

For example, early on you have the virus but no symptoms, so you behave as normal. When you speak with people, you spread the virus. When you touch your nose and then open door knob, the next people to open the door and touch their nose get infected.

The more the virus is growing inside you, the more infectious you are. Then, once you start having symptoms, you might slowly stop going to work, stay in bed, wear a mask, or start going to the doctor. The bigger the symptoms, the more you distance yourself socially, reducing the spread of the virus.

Once you’re hospitalized, even if you are very contagious you don’t tend to spread the virus as much since you’re isolated.

This is where you can see the massive impact of policies like those of Singapore or South Korea:

  • If people are massively tested, they can be identified even before they have symptoms. Quarantined, they can’t spread anything.
  • If people are trained to identify their symptoms earlier, they reduce the number of days in blue, and hence their overall contagiousness
  • If people are isolated as soon as they have symptoms, the contagions from the orange phase disappear.
  • If people are educated about personal distance, mask-wearing, washing hands or disinfecting spaces, they spread less virus throughout the entire period.

Only when all these fail do we need heavier social distancing measures.

The ROI of Social Distancing

If with all these measures we’re still way above R=1, we need to reduce the average number of people that each person meets.

There are some very cheap ways to do that, like banning events with more than a certain number of people (eg, 50, 500), or asking people to work from home when they can.

Other are much, much more expensive economically, socially and ethically, such as closing schools and universities, asking everybody to stay home, or closing businesses.

This chart is made up because it doesn’t exist today. Nobody has done enough research about this or put together all these measures in a way that can compare them.

It’s unfortunate, because it’s the single most important chart that politicians would need to make decisions. It illustrates what is really going through their minds.

During the Hammer period, politicians want to lower R as much as possible, through measures that remain tolerable for the population. In Hubei, they went all the way to 0.32. We might not need that: maybe just to 0.5 or 0.6.

But during the Dance of the R period, they want to hover as close to 1 as possible, while staying below it over the long term term. That prevents a new outbreak, while eliminating the most drastic measures.

What this means is that, whether leaders realize it or not, what they’re doing is:

  • List all the measures they can take to reduce R
  • Get a sense of the benefit of applying them: the reduction in R
  • Get a sense of their cost: the economic, social, and ethical cost.
  • Stack-rank the initiatives based on their cost-benefit
  • Pick the ones that give the biggest R reduction up till 1, for the lowest cost.
This is for illustrative purposes only. All data is made up. However, as far as we were able to tell, this data doesn’t exist today. It needs to. For example, the list from the CDC is a great start, but it misses things like education measures, triggers, quantifications of costs and benefits, measure details, economic / social countermeasures…

Initially, their confidence on these numbers will be low. But that‘s still how they are thinking—and should be thinking about it.

What they need to do is formalize the process: Understand that this is a numbers game in which we need to learn as fast as possible where we are on R, the impact of every measure on reducing R, and their social and economic costs.

Only then will they be able to make a rational decision on what measures they should take.

Conclusion: Buy Us Time

The coronavirus is still spreading nearly everywhere. 152 countries have cases. We are against the clock. But we don’t need to be: there’s a clear way we can be thinking about this.

Some countries, especially those that haven’t been hit heavily yet by the coronavirus, might be wondering: Is this going to happen to me? The answer is: It probably already has. You just haven’t noticed. When it really hits, your healthcare system will be in even worse shape than in wealthy countries where the healthcare systems are strong. Better safe than sorry, you should consider taking action now.

For the countries where the coronavirus is already here, the options are clear.

On one side, countries can go the mitigation route: create a massive epidemic, overwhelm the healthcare system, drive the death of millions of people, and release new mutations of this virus in the wild.

On the other, countries can fight. They can lock down for a few weeks to buy us time, create an educated action plan, and control this virus until we have a vaccine.

Governments around the world today, including some such as the US, the UK or Switzerland have so far chosen the mitigation path.

That means they’re giving up without a fight. They see other countries having successfully fought this, but they say: “We can’t do that!

What if Churchill had said the same thing? “Nazis are already everywhere in Europe. We can’t fight them. Let’s just give up.” This is what many governments around the world are doing today. They’re not giving you a chance to fight this. You have to demand it.

Share the Word

Unfortunately, millions of lives are still at stake. Share this article—or any similar one—if you think it can change people’s opinion. Leaders need to understand this to avert a catastrophe. The moment to act is now.


If you agree with this article and want the US Government to take action, please sign the White House petition to implement a Hammer-and-Dance Suppression strategy.Buy Us Time to Fight the Coronavirus and Save Millions of Lives with a Hammer-and-Dance Suppression…Our healthcare system is collapsing. It will only get worse. Mitigation-“flattening the curve”-isn’t enough. We must…petitions.whitehouse.gov

If you are an expert in the field and want to criticize or endorse the article or some of its parts, feel free to leave a private note here or contextually and I will respond or address.

If you want to translate this article, do it on a Medium post and leave me a private note here with your link. Here are the translations currently available:

Spanish (verified by author, full translation inc. charts)(alt. vs. 1, 2, 3, 4, 5)
French (translated by an epidemiologist)
Chinese Traditional (
full translation including charts, alternative translation)
Chinese SimplifiedGermanPortuguese (alternative version)
RussianItalianJapaneseVietnameseTurkishPolishIcelandic (alternative translation)
GreekBahasa IndonesiaBahasa MalaysiaFarsi (alternative version outside of Medium)Czech (alternative translation)
DutchNorwegianHebrewUkrainian (alternative version)
SwedishRomanianBulgarianCatalonianSlovak

This article has been the result of a herculean effort by a group of normal citizens working around the clock to find all the relevant research available to structure it into one piece, in case it can help others process all the information that is out there about the coronavirus.

Special thanks to Dr. Carl Juneau (epidemiologist and translator of the French version), Dr. Brandon Fainstad, Pierre Djian, Jorge Peñalva, John Hsu, Genevieve Gee, Elena Baillie, Chris Martinez, Yasemin Denari, Christine Gibson, Matt Bell, Dan Walsh, Jessica Thompson, Karim Ravji, Annie Hazlehurst, and Aishwarya Khanduja. This has been a team effort.

Thank you also to Berin Szoka, Shishir Mehrotra, QVentus, Illumina, Josephine Gavignet, Mike Kidd, and Nils Barth for your advice. Thank you to my company, Course Hero, for giving me the time and freedom to focus on this.

Stay on top of the pandemic

Stay current with comprehensive, up-to-the-minute information, all in one place, at the new Medium Coronavirus Blog. Sign up for our Coronavirus newsletter here.

Thanks to Tito Hubert, Genevieve Gee, Pierre Djian, Jorge Peñalva, and Matt Bell. 

Written by

Tomas Pueyo

2 MSc in Engineering. Stanford MBA. Ex-Consultant. Creator of viral applications with >20M users. Currently leading a billion-dollar business @ Course Hero

Can Big Data Tell Us What Clinical Trials Don’t? (New York Times)

CreditIllustration by Christopher Brand

When a helicopter rushed a 13-year-old girl showing symptoms suggestive of kidney failure to Stanford’s Packard Children’s Hospital, Jennifer Frankovich was the rheumatologist on call. She and a team of other doctors quickly diagnosed lupus, an autoimmune disease. But as they hurried to treat the girl, Frankovich thought that something about the patient’s particular combination of lupus symptoms — kidney problems, inflamed pancreas and blood vessels — rang a bell. In the past, she’d seen lupus patients with these symptoms develop life-threatening blood clots. Her colleagues in other specialties didn’t think there was cause to give the girl anti-clotting drugs, so Frankovich deferred to them. But she retained her suspicions. “I could not forget these cases,” she says.

Back in her office, she found that the scientific literature had no studies on patients like this to guide her. So she did something unusual: She searched a database of all the lupus patients the hospital had seen over the previous five years, singling out those whose symptoms matched her patient’s, and ran an analysis to see whether they had developed blood clots. “I did some very simple statistics and brought the data to everybody that I had met with that morning,” she says. The change in attitude was striking. “It was very clear, based on the database, that she could be at an increased risk for a clot.”

The girl was given the drug, and she did not develop a clot. “At the end of the day, we don’t know whether it was the right decision,” says Chris Longhurst, a pediatrician and the chief medical information officer at Stanford Children’s Health, who is a colleague of Frankovich’s. But they felt that it was the best they could do with the limited information they had.

A large, costly and time-consuming clinical trial with proper controls might someday prove Frankovich’s hypothesis correct. But large, costly and time-consuming clinical trials are rarely carried out for uncommon complications of this sort. In the absence of such focused research, doctors and scientists are increasingly dipping into enormous troves of data that already exist — namely the aggregated medical records of thousands or even millions of patients to uncover patterns that might help steer care.

The Tatonetti Laboratory at Columbia University is a nexus in this search for signal in the noise. There, Nicholas Tatonetti, an assistant professor of biomedical informatics — an interdisciplinary field that combines computer science and medicine — develops algorithms to trawl medical databases and turn up correlations. For his doctoral thesis, he mined the F.D.A.’s records of adverse drug reactions to identify pairs of medications that seemed to cause problems when taken together. He found an interaction between two very commonly prescribed drugs: The antidepressant paroxetine (marketed as Paxil) and the cholesterol-lowering medication pravastatin were connected to higher blood-sugar levels. Taken individually, the drugs didn’t affect glucose levels. But taken together, the side-effect was impossible to ignore. “Nobody had ever thought to look for it,” Tatonetti says, “and so nobody had ever found it.”

The potential for this practice extends far beyond drug interactions. In the past, researchers noticed that being born in certain months or seasons appears to be linked to a higher risk of some diseases. In the Northern Hemisphere, people with multiple sclerosis tend to be born in the spring, while in the Southern Hemisphere they tend to be born in November; people with schizophrenia tend to have been born during the winter. There are numerous correlations like this, and the reasons for them are still foggy — a problem Tatonetti and a graduate assistant, Mary Boland, hope to solve by parsing the data on a vast array of outside factors. Tatonetti describes it as a quest to figure out “how these diseases could be dependent on birth month in a way that’s not just astrology.” Other researchers think data-mining might also be particularly beneficial for cancer patients, because so few types of cancer are represented in clinical trials.

As with so much network-enabled data-tinkering, this research is freighted with serious privacy concerns. If these analyses are considered part of treatment, hospitals may allow them on the grounds of doing what is best for a patient. But if they are considered medical research, then everyone whose records are being used must give permission. In practice, the distinction can be fuzzy and often depends on the culture of the institution. After Frankovich wrote about her experience in The New England Journal of Medicine in 2011, her hospital warned her not to conduct such analyses again until a proper framework for using patient information was in place.

In the lab, ensuring that the data-mining conclusions hold water can also be tricky. By definition, a medical-records database contains information only on sick people who sought help, so it is inherently incomplete. Also, they lack the controls of a clinical study and are full of other confounding factors that might trip up unwary researchers. Daniel Rubin, a professor of bioinformatics at Stanford, also warns that there have been no studies of data-driven medicine to determine whether it leads to positive outcomes more often than not. Because historical evidence is of “inferior quality,” he says, it has the potential to lead care astray.

Yet despite the pitfalls, developing a “learning health system” — one that can incorporate lessons from its own activities in real time — remains tantalizing to researchers. Stefan Thurner, a professor of complexity studies at the Medical University of Vienna, and his researcher, Peter Klimek, are working with a database of millions of people’s health-insurance claims, building networks of relationships among diseases. As they fill in the network with known connections and new ones mined from the data, Thurner and Klimek hope to be able to predict the health of individuals or of a population over time. On the clinical side, Longhurst has been advocating for a button in electronic medical-record software that would allow doctors to run automated searches for patients like theirs when no other sources of information are available.

With time, and with some crucial refinements, this kind of medicine may eventually become mainstream. Frankovich recalls a conversation with an older colleague. “She told me, ‘Research this decade benefits the next decade,’ ” Frankovich says. “That was how it was. But I feel like it doesn’t have to be that way anymore.”

The rise of data and the death of politics (The Guardian)

Tech pioneers in the US are advocating a new data-based approach to governance – ‘algorithmic regulation’. But if technology provides the answers to society’s problems, what happens to governments?

The Observer, Sunday 20 July 2014

US president Barack Obama with Facebook founder Mark Zuckerberg

Government by social network? US president Barack Obama with Facebook founder Mark Zuckerberg. Photograph: Mandel Ngan/AFP/Getty Images

On 24 August 1965 Gloria Placente, a 34-year-old resident of Queens, New York, was driving to Orchard Beach in the Bronx. Clad in shorts and sunglasses, the housewife was looking forward to quiet time at the beach. But the moment she crossed the Willis Avenue bridge in her Chevrolet Corvair, Placente was surrounded by a dozen patrolmen. There were also 125 reporters, eager to witness the launch of New York police department’s Operation Corral – an acronym for Computer Oriented Retrieval of Auto Larcenists.

Fifteen months earlier, Placente had driven through a red light and neglected to answer the summons, an offence that Corral was going to punish with a heavy dose of techno-Kafkaesque. It worked as follows: a police car stationed at one end of the bridge radioed the licence plates of oncoming cars to a teletypist miles away, who fed them to a Univac 490 computer, an expensive $500,000 toy ($3.5m in today’s dollars) on loan from the Sperry Rand Corporation. The computer checked the numbers against a database of 110,000 cars that were either stolen or belonged to known offenders. In case of a match the teletypist would alert a second patrol car at the bridge’s other exit. It took, on average, just seven seconds.

Compared with the impressive police gear of today – automatic number plate recognition, CCTV cameras, GPS trackers – Operation Corral looks quaint. And the possibilities for control will only expand. European officials have considered requiring all cars entering the European market to feature a built-in mechanism that allows the police to stop vehicles remotely. Speaking earlier this year, Jim Farley, a senior Ford executive, acknowledged that “we know everyone who breaks the law, we know when you’re doing it. We have GPS in your car, so we know what you’re doing. By the way, we don’t supply that data to anyone.” That last bit didn’t sound very reassuring and Farley retracted his remarks.

As both cars and roads get “smart,” they promise nearly perfect, real-time law enforcement. Instead of waiting for drivers to break the law, authorities can simply prevent the crime. Thus, a 50-mile stretch of the A14 between Felixstowe and Rugby is to be equipped with numerous sensors that would monitor traffic by sending signals to and from mobile phones in moving vehicles. The telecoms watchdog Ofcom envisionsthat such smart roads connected to a centrally controlled traffic system could automatically impose variable speed limits to smooth the flow of traffic but also direct the cars “along diverted routes to avoid the congestion and even [manage] their speed”.

Other gadgets – from smartphones to smart glasses – promise even more security and safety. In April, Apple patented technology that deploys sensors inside the smartphone to analyse if the car is moving and if the person using the phone is driving; if both conditions are met, it simply blocks the phone’s texting feature. Intel and Ford are working on Project Mobil – a face recognition system that, should it fail to recognise the face of the driver, would not only prevent the car being started but also send the picture to the car’s owner (bad news for teenagers).

The car is emblematic of transformations in many other domains, from smart environments for “ambient assisted living” where carpets and walls detect that someone has fallen, to various masterplans for the smart city, where municipal services dispatch resources only to those areas that need them. Thanks to sensors and internet connectivity, the most banal everyday objects have acquired tremendous power to regulate behaviour. Even public toilets are ripe for sensor-based optimisation: the Safeguard Germ Alarm, a smart soap dispenser developed by Procter & Gamble and used in some public WCs in the Philippines, has sensors monitoring the doors of each stall. Once you leave the stall, the alarm starts ringing – and can only be stopped by a push of the soap-dispensing button.

In this context, Google’s latest plan to push its Android operating system on to smart watches, smart cars, smart thermostats and, one suspects, smart everything, looks rather ominous. In the near future, Google will be the middleman standing between you and your fridge, you and your car, you and your rubbish bin, allowing the National Security Agency to satisfy its data addiction in bulk and via a single window.

This “smartification” of everyday life follows a familiar pattern: there’s primary data – a list of what’s in your smart fridge and your bin – and metadata – a log of how often you open either of these things or when they communicate with one another. Both produce interesting insights: cue smart mattresses – one recent model promises to track respiration and heart rates and how much you move during the night – and smart utensils that provide nutritional advice.

In addition to making our lives more efficient, this smart world also presents us with an exciting political choice. If so much of our everyday behaviour is already captured, analysed and nudged, why stick with unempirical approaches to regulation? Why rely on laws when one has sensors and feedback mechanisms? If policy interventions are to be – to use the buzzwords of the day – “evidence-based” and “results-oriented,” technology is here to help.

This new type of governance has a name: algorithmic regulation. In as much as Silicon Valley has a political programme, this is it. Tim O’Reilly, an influential technology publisher, venture capitalist and ideas man (he is to blame for popularising the term “web 2.0”) has been its most enthusiastic promoter. In a recent essay that lays out his reasoning, O’Reilly makes an intriguing case for the virtues of algorithmic regulation – a case that deserves close scrutiny both for what it promises policymakers and the simplistic assumptions it makes about politics, democracy and power.

To see algorithmic regulation at work, look no further than the spam filter in your email. Instead of confining itself to a narrow definition of spam, the email filter has its users teach it. Even Google can’t write rules to cover all the ingenious innovations of professional spammers. What it can do, though, is teach the system what makes a good rule and spot when it’s time to find another rule for finding a good rule – and so on. An algorithm can do this, but it’s the constant real-time feedback from its users that allows the system to counter threats never envisioned by its designers. And it’s not just spam: your bank uses similar methods to spot credit-card fraud.

In his essay, O’Reilly draws broader philosophical lessons from such technologies, arguing that they work because they rely on “a deep understanding of the desired outcome” (spam is bad!) and periodically check if the algorithms are actually working as expected (are too many legitimate emails ending up marked as spam?).

O’Reilly presents such technologies as novel and unique – we are living through a digital revolution after all – but the principle behind “algorithmic regulation” would be familiar to the founders of cybernetics – a discipline that, even in its name (it means “the science of governance”) hints at its great regulatory ambitions. This principle, which allows the system to maintain its stability by constantly learning and adapting itself to the changing circumstances, is what the British psychiatrist Ross Ashby, one of the founding fathers of cybernetics, called “ultrastability”.

To illustrate it, Ashby designed the homeostat. This clever device consisted of four interconnected RAF bomb control units – mysterious looking black boxes with lots of knobs and switches – that were sensitive to voltage fluctuations. If one unit stopped working properly – say, because of an unexpected external disturbance – the other three would rewire and regroup themselves, compensating for its malfunction and keeping the system’s overall output stable.

Ashby’s homeostat achieved “ultrastability” by always monitoring its internal state and cleverly redeploying its spare resources.

Like the spam filter, it didn’t have to specify all the possible disturbances – only the conditions for how and when it must be updated and redesigned. This is no trivial departure from how the usual technical systems, with their rigid, if-then rules, operate: suddenly, there’s no need to develop procedures for governing every contingency, for – or so one hopes – algorithms and real-time, immediate feedback can do a better job than inflexible rules out of touch with reality.

Algorithmic regulation could certainly make the administration of existing laws more efficient. If it can fight credit-card fraud, why not tax fraud? Italian bureaucrats have experimented with the redditometro, or income meter, a tool for comparing people’s spending patterns – recorded thanks to an arcane Italian law – with their declared income, so that authorities know when you spend more than you earn. Spain has expressed interest in a similar tool.

Such systems, however, are toothless against the real culprits of tax evasion – the super-rich families who profit from various offshoring schemes or simply write outrageous tax exemptions into the law. Algorithmic regulation is perfect for enforcing the austerity agenda while leaving those responsible for the fiscal crisis off the hook. To understand whether such systems are working as expected, we need to modify O’Reilly’s question: for whom are they working? If it’s just the tax-evading plutocrats, the global financial institutions interested in balanced national budgets and the companies developing income-tracking software, then it’s hardly a democratic success.

With his belief that algorithmic regulation is based on “a deep understanding of the desired outcome”, O’Reilly cunningly disconnects the means of doing politics from its ends. But the how of politics is as important as the what of politics – in fact, the former often shapes the latter. Everybody agrees that education, health, and security are all “desired outcomes”, but how do we achieve them? In the past, when we faced the stark political choice of delivering them through the market or the state, the lines of the ideological debate were clear. Today, when the presumed choice is between the digital and the analog or between the dynamic feedback and the static law, that ideological clarity is gone – as if the very choice of how to achieve those “desired outcomes” was apolitical and didn’t force us to choose between different and often incompatible visions of communal living.

By assuming that the utopian world of infinite feedback loops is so efficient that it transcends politics, the proponents of algorithmic regulation fall into the same trap as the technocrats of the past. Yes, these systems are terrifyingly efficient – in the same way that Singapore is terrifyingly efficient (O’Reilly, unsurprisingly, praises Singapore for its embrace of algorithmic regulation). And while Singapore’s leaders might believe that they, too, have transcended politics, it doesn’t mean that their regime cannot be assessed outside the linguistic swamp of efficiency and innovation – by using political, not economic benchmarks.

As Silicon Valley keeps corrupting our language with its endless glorification of disruption and efficiency – concepts at odds with the vocabulary of democracy – our ability to question the “how” of politics is weakened. Silicon Valley’s default answer to the how of politics is what I call solutionism: problems are to be dealt with via apps, sensors, and feedback loops – all provided by startups. Earlier this year Google’s Eric Schmidt even promised that startups would provide the solution to the problem of economic inequality: the latter, it seems, can also be “disrupted”. And where the innovators and the disruptors lead, the bureaucrats follow.

The intelligence services embraced solutionism before other government agencies. Thus, they reduced the topic of terrorism from a subject that had some connection to history and foreign policy to an informational problem of identifying emerging terrorist threats via constant surveillance. They urged citizens to accept that instability is part of the game, that its root causes are neither traceable nor reparable, that the threat can only be pre-empted by out-innovating and out-surveilling the enemy with better communications.

Speaking in Athens last November, the Italian philosopher Giorgio Agamben discussed an epochal transformation in the idea of government, “whereby the traditional hierarchical relation between causes and effects is inverted, so that, instead of governing the causes – a difficult and expensive undertaking – governments simply try to govern the effects”.

Nobel laureate Daniel Kahneman

Governments’ current favourite pyschologist, Daniel Kahneman. Photograph: Richard Saker for the Observer

For Agamben, this shift is emblematic of modernity. It also explains why the liberalisation of the economy can co-exist with the growing proliferation of control – by means of soap dispensers and remotely managed cars – into everyday life. “If government aims for the effects and not the causes, it will be obliged to extend and multiply control. Causes demand to be known, while effects can only be checked and controlled.” Algorithmic regulation is an enactment of this political programme in technological form.

The true politics of algorithmic regulation become visible once its logic is applied to the social nets of the welfare state. There are no calls to dismantle them, but citizens are nonetheless encouraged to take responsibility for their own health. Consider how Fred Wilson, an influential US venture capitalist, frames the subject. “Health… is the opposite side of healthcare,” he said at a conference in Paris last December. “It’s what keeps you out of the healthcare system in the first place.” Thus, we are invited to start using self-tracking apps and data-sharing platforms and monitor our vital indicators, symptoms and discrepancies on our own.

This goes nicely with recent policy proposals to save troubled public services by encouraging healthier lifestyles. Consider a 2013 report by Westminster council and the Local Government Information Unit, a thinktank, calling for the linking of housing and council benefits to claimants’ visits to the gym – with the help of smartcards. They might not be needed: many smartphones are already tracking how many steps we take every day (Google Now, the company’s virtual assistant, keeps score of such data automatically and periodically presents it to users, nudging them to walk more).

The numerous possibilities that tracking devices offer to health and insurance industries are not lost on O’Reilly. “You know the way that advertising turned out to be the native business model for the internet?” he wondered at a recent conference. “I think that insurance is going to be the native business model for the internet of things.” Things do seem to be heading that way: in June, Microsoft struck a deal with American Family Insurance, the eighth-largest home insurer in the US, in which both companies will fund startups that want to put sensors into smart homes and smart cars for the purposes of “proactive protection”.

An insurance company would gladly subsidise the costs of installing yet another sensor in your house – as long as it can automatically alert the fire department or make front porch lights flash in case your smoke detector goes off. For now, accepting such tracking systems is framed as an extra benefit that can save us some money. But when do we reach a point where not using them is seen as a deviation – or, worse, an act of concealment – that ought to be punished with higher premiums?

Or consider a May 2014 report from 2020health, another thinktank, proposing to extend tax rebates to Britons who give up smoking, stay slim or drink less. “We propose ‘payment by results’, a financial reward for people who become active partners in their health, whereby if you, for example, keep your blood sugar levels down, quit smoking, keep weight off, [or] take on more self-care, there will be a tax rebate or an end-of-year bonus,” they state. Smart gadgets are the natural allies of such schemes: they document the results and can even help achieve them – by constantly nagging us to do what’s expected.

The unstated assumption of most such reports is that the unhealthy are not only a burden to society but that they deserve to be punished (fiscally for now) for failing to be responsible. For what else could possibly explain their health problems but their personal failings? It’s certainly not the power of food companies or class-based differences or various political and economic injustices. One can wear a dozen powerful sensors, own a smart mattress and even do a close daily reading of one’s poop – as some self-tracking aficionados are wont to do – but those injustices would still be nowhere to be seen, for they are not the kind of stuff that can be measured with a sensor. The devil doesn’t wear data. Social injustices are much harder to track than the everyday lives of the individuals whose lives they affect.

In shifting the focus of regulation from reining in institutional and corporate malfeasance to perpetual electronic guidance of individuals, algorithmic regulation offers us a good-old technocratic utopia of politics without politics. Disagreement and conflict, under this model, are seen as unfortunate byproducts of the analog era – to be solved through data collection – and not as inevitable results of economic or ideological conflicts.

However, a politics without politics does not mean a politics without control or administration. As O’Reilly writes in his essay: “New technologies make it possible to reduce the amount of regulation while actually increasing the amount of oversight and production of desirable outcomes.” Thus, it’s a mistake to think that Silicon Valley wants to rid us of government institutions. Its dream state is not the small government of libertarians – a small state, after all, needs neither fancy gadgets nor massive servers to process the data – but the data-obsessed and data-obese state of behavioural economists.

The nudging state is enamoured of feedback technology, for its key founding principle is that while we behave irrationally, our irrationality can be corrected – if only the environment acts upon us, nudging us towards the right option. Unsurprisingly, one of the three lonely references at the end of O’Reilly’s essay is to a 2012 speech entitled “Regulation: Looking Backward, Looking Forward” by Cass Sunstein, the prominent American legal scholar who is the chief theorist of the nudging state.

And while the nudgers have already captured the state by making behavioural psychology the favourite idiom of government bureaucracy –Daniel Kahneman is in, Machiavelli is out – the algorithmic regulation lobby advances in more clandestine ways. They create innocuous non-profit organisations like Code for America which then co-opt the state – under the guise of encouraging talented hackers to tackle civic problems.

Airbnb's homepage.

Airbnb: part of the reputation-driven economy.

Such initiatives aim to reprogramme the state and make it feedback-friendly, crowding out other means of doing politics. For all those tracking apps, algorithms and sensors to work, databases need interoperability – which is what such pseudo-humanitarian organisations, with their ardent belief in open data, demand. And when the government is too slow to move at Silicon Valley’s speed, they simply move inside the government. Thus, Jennifer Pahlka, the founder of Code for America and a protege of O’Reilly, became the deputy chief technology officer of the US government – while pursuing a one-year “innovation fellowship” from the White House.

Cash-strapped governments welcome such colonisation by technologists – especially if it helps to identify and clean up datasets that can be profitably sold to companies who need such data for advertising purposes. Recent clashes over the sale of student and health data in the UK are just a precursor of battles to come: after all state assets have been privatised, data is the next target. For O’Reilly, open data is “a key enabler of the measurement revolution”.

This “measurement revolution” seeks to quantify the efficiency of various social programmes, as if the rationale behind the social nets that some of them provide was to achieve perfection of delivery. The actual rationale, of course, was to enable a fulfilling life by suppressing certain anxieties, so that citizens can pursue their life projects relatively undisturbed. This vision did spawn a vast bureaucratic apparatus and the critics of the welfare state from the left – most prominently Michel Foucault – were right to question its disciplining inclinations. Nonetheless, neither perfection nor efficiency were the “desired outcome” of this system. Thus, to compare the welfare state with the algorithmic state on those grounds is misleading.

But we can compare their respective visions for human fulfilment – and the role they assign to markets and the state. Silicon Valley’s offer is clear: thanks to ubiquitous feedback loops, we can all become entrepreneurs and take care of our own affairs! As Brian Chesky, the chief executive of Airbnb, told the Atlantic last year, “What happens when everybody is a brand? When everybody has a reputation? Every person can become an entrepreneur.”

Under this vision, we will all code (for America!) in the morning, driveUber cars in the afternoon, and rent out our kitchens as restaurants – courtesy of Airbnb – in the evening. As O’Reilly writes of Uber and similar companies, “these services ask every passenger to rate their driver (and drivers to rate their passenger). Drivers who provide poor service are eliminated. Reputation does a better job of ensuring a superb customer experience than any amount of government regulation.”

The state behind the “sharing economy” does not wither away; it might be needed to ensure that the reputation accumulated on Uber, Airbnb and other platforms of the “sharing economy” is fully liquid and transferable, creating a world where our every social interaction is recorded and assessed, erasing whatever differences exist between social domains. Someone, somewhere will eventually rate you as a passenger, a house guest, a student, a patient, a customer. Whether this ranking infrastructure will be decentralised, provided by a giant like Google or rest with the state is not yet clear but the overarching objective is: to make reputation into a feedback-friendly social net that could protect the truly responsible citizens from the vicissitudes of deregulation.

Admiring the reputation models of Uber and Airbnb, O’Reilly wants governments to be “adopting them where there are no demonstrable ill effects”. But what counts as an “ill effect” and how to demonstrate it is a key question that belongs to the how of politics that algorithmic regulation wants to suppress. It’s easy to demonstrate “ill effects” if the goal of regulation is efficiency but what if it is something else? Surely, there are some benefits – fewer visits to the psychoanalyst, perhaps – in not having your every social interaction ranked?

The imperative to evaluate and demonstrate “results” and “effects” already presupposes that the goal of policy is the optimisation of efficiency. However, as long as democracy is irreducible to a formula, its composite values will always lose this battle: they are much harder to quantify.

For Silicon Valley, though, the reputation-obsessed algorithmic state of the sharing economy is the new welfare state. If you are honest and hardworking, your online reputation would reflect this, producing a highly personalised social net. It is “ultrastable” in Ashby’s sense: while the welfare state assumes the existence of specific social evils it tries to fight, the algorithmic state makes no such assumptions. The future threats can remain fully unknowable and fully addressable – on the individual level.

Silicon Valley, of course, is not alone in touting such ultrastable individual solutions. Nassim Taleb, in his best-selling 2012 book Antifragile, makes a similar, if more philosophical, plea for maximising our individual resourcefulness and resilience: don’t get one job but many, don’t take on debt, count on your own expertise. It’s all about resilience, risk-taking and, as Taleb puts it, “having skin in the game”. As Julian Reid and Brad Evans write in their new book, Resilient Life: The Art of Living Dangerously, this growing cult of resilience masks a tacit acknowledgement that no collective project could even aspire to tame the proliferating threats to human existence – we can only hope to equip ourselves to tackle them individually. “When policy-makers engage in the discourse of resilience,” write Reid and Evans, “they do so in terms which aim explicitly at preventing humans from conceiving of danger as a phenomenon from which they might seek freedom and even, in contrast, as that to which they must now expose themselves.”

What, then, is the progressive alternative? “The enemy of my enemy is my friend” doesn’t work here: just because Silicon Valley is attacking the welfare state doesn’t mean that progressives should defend it to the very last bullet (or tweet). First, even leftist governments have limited space for fiscal manoeuvres, as the kind of discretionary spending required to modernise the welfare state would never be approved by the global financial markets. And it’s the ratings agencies and bond markets – not the voters – who are in charge today.

Second, the leftist critique of the welfare state has become only more relevant today when the exact borderlines between welfare and security are so blurry. When Google’s Android powers so much of our everyday life, the government’s temptation to govern us through remotely controlled cars and alarm-operated soap dispensers will be all too great. This will expand government’s hold over areas of life previously free from regulation.

With so much data, the government’s favourite argument in fighting terror – if only the citizens knew as much as we do, they too would impose all these legal exceptions – easily extends to other domains, from health to climate change. Consider a recent academic paper that used Google search data to study obesity patterns in the US, finding significant correlation between search keywords and body mass index levels. “Results suggest great promise of the idea of obesity monitoring through real-time Google Trends data”, note the authors, which would be “particularly attractive for government health institutions and private businesses such as insurance companies.”

If Google senses a flu epidemic somewhere, it’s hard to challenge its hunch – we simply lack the infrastructure to process so much data at this scale. Google can be proven wrong after the fact – as has recently been the case with its flu trends data, which was shown to overestimate the number of infections, possibly because of its failure to account for the intense media coverage of flu – but so is the case with most terrorist alerts. It’s the immediate, real-time nature of computer systems that makes them perfect allies of an infinitely expanding and pre-emption‑obsessed state.

Perhaps, the case of Gloria Placente and her failed trip to the beach was not just a historical oddity but an early omen of how real-time computing, combined with ubiquitous communication technologies, would transform the state. One of the few people to have heeded that omen was a little-known American advertising executive called Robert MacBride, who pushed the logic behind Operation Corral to its ultimate conclusions in his unjustly neglected 1967 book, The Automated State.

At the time, America was debating the merits of establishing a national data centre to aggregate various national statistics and make it available to government agencies. MacBride attacked his contemporaries’ inability to see how the state would exploit the metadata accrued as everything was being computerised. Instead of “a large scale, up-to-date Austro-Hungarian empire”, modern computer systems would produce “a bureaucracy of almost celestial capacity” that can “discern and define relationships in a manner which no human bureaucracy could ever hope to do”.

“Whether one bowls on a Sunday or visits a library instead is [of] no consequence since no one checks those things,” he wrote. Not so when computer systems can aggregate data from different domains and spot correlations. “Our individual behaviour in buying and selling an automobile, a house, or a security, in paying our debts and acquiring new ones, and in earning money and being paid, will be noted meticulously and studied exhaustively,” warned MacBride. Thus, a citizen will soon discover that “his choice of magazine subscriptions… can be found to indicate accurately the probability of his maintaining his property or his interest in the education of his children.” This sounds eerily similar to the recent case of a hapless father who found that his daughter was pregnant from a coupon that Target, a retailer, sent to their house. Target’s hunch was based on its analysis of products – for example, unscented lotion – usually bought by other pregnant women.

For MacBride the conclusion was obvious. “Political rights won’t be violated but will resemble those of a small stockholder in a giant enterprise,” he wrote. “The mark of sophistication and savoir-faire in this future will be the grace and flexibility with which one accepts one’s role and makes the most of what it offers.” In other words, since we are all entrepreneurs first – and citizens second, we might as well make the most of it.

What, then, is to be done? Technophobia is no solution. Progressives need technologies that would stick with the spirit, if not the institutional form, of the welfare state, preserving its commitment to creating ideal conditions for human flourishing. Even some ultrastability is welcome. Stability was a laudable goal of the welfare state before it had encountered a trap: in specifying the exact protections that the state was to offer against the excesses of capitalism, it could not easily deflect new, previously unspecified forms of exploitation.

How do we build welfarism that is both decentralised and ultrastable? A form of guaranteed basic income – whereby some welfare services are replaced by direct cash transfers to citizens – fits the two criteria.

Creating the right conditions for the emergence of political communities around causes and issues they deem relevant would be another good step. Full compliance with the principle of ultrastability dictates that such issues cannot be anticipated or dictated from above – by political parties or trade unions – and must be left unspecified.

What can be specified is the kind of communications infrastructure needed to abet this cause: it should be free to use, hard to track, and open to new, subversive uses. Silicon Valley’s existing infrastructure is great for fulfilling the needs of the state, not of self-organising citizens. It can, of course, be redeployed for activist causes – and it often is – but there’s no reason to accept the status quo as either ideal or inevitable.

Why, after all, appropriate what should belong to the people in the first place? While many of the creators of the internet bemoan how low their creature has fallen, their anger is misdirected. The fault is not with that amorphous entity but, first of all, with the absence of robust technology policy on the left – a policy that can counter the pro-innovation, pro-disruption, pro-privatisation agenda of Silicon Valley. In its absence, all these emerging political communities will operate with their wings clipped. Whether the next Occupy Wall Street would be able to occupy anything in a truly smart city remains to be seen: most likely, they would be out-censored and out-droned.

To his credit, MacBride understood all of this in 1967. “Given the resources of modern technology and planning techniques,” he warned, “it is really no great trick to transform even a country like ours into a smoothly running corporation where every detail of life is a mechanical function to be taken care of.” MacBride’s fear is O’Reilly’s master plan: the government, he writes, ought to be modelled on the “lean startup” approach of Silicon Valley, which is “using data to constantly revise and tune its approach to the market”. It’s this very approach that Facebook has recently deployed to maximise user engagement on the site: if showing users more happy stories does the trick, so be it.

Algorithmic regulation, whatever its immediate benefits, will give us a political regime where technology corporations and government bureaucrats call all the shots. The Polish science fiction writer Stanislaw Lem, in a pointed critique of cybernetics published, as it happens, roughly at the same time as The Automated State, put it best: “Society cannot give up the burden of having to decide about its own fate by sacrificing this freedom for the sake of the cybernetic regulator.”

How Quantum Computers and Machine Learning Will Revolutionize Big Data (Wired)

BY JENNIFER OUELLETTE, QUANTA MAGAZINE

10.14.13

Image: infocux Technologies/Flickr

When subatomic particles smash together at the Large Hadron Collider in Switzerland, they create showers of new particles whose signatures are recorded by four detectors. The LHC captures 5 trillion bits of data — more information than all of the world’s libraries combined — every second. After the judicious application of filtering algorithms, more than 99 percent of those data are discarded, but the four experiments still produce a whopping 25 petabytes (25×1015 bytes) of data per year that must be stored and analyzed. That is a scale far beyond the computing resources of any single facility, so the LHC scientists rely on a vast computing grid of 160 data centers around the world, a distributed network that is capable of transferring as much as 10 gigabytes per second at peak performance.

The LHC’s approach to its big data problem reflects just how dramatically the nature of computing has changed over the last decade. Since Intel co-founder Gordon E. Moore first defined it in 1965, the so-called Moore’s law — which predicts that the number of transistors on integrated circuits will double every two years — has dominated the computer industry. While that growth rate has proved remarkably resilient, for now, at least, “Moore’s law has basically crapped out; the transistors have gotten as small as people know how to make them economically with existing technologies,” said Scott Aaronson, a theoretical computer scientist at the Massachusetts Institute of Technology.

Instead, since 2005, many of the gains in computing power have come from adding more parallelism via multiple cores, with multiple levels of memory. The preferred architecture no longer features a single central processing unit (CPU) augmented with random access memory (RAM) and a hard drive for long-term storage. Even the big, centralized parallel supercomputers that dominated the 1980s and 1990s are giving way to distributed data centers and cloud computing, often networked across many organizations and vast geographical distances.

These days, “People talk about a computing fabric,” said Stanford University electrical engineerStephen Boyd. These changes in computer architecture translate into the need for a different computational approach when it comes to handling big data, which is not only grander in scope than the large data sets of yore but also intrinsically different from them.

The demand for ever-faster processors, while important, isn’t the primary focus anymore. “Processing speed has been completely irrelevant for five years,” Boyd said. “The challenge is not how to solve problems with a single, ultra-fast processor, but how to solve them with 100,000 slower processors.” Aaronson points out that many problems in big data can’t be adequately addressed by simply adding more parallel processing. These problems are “more sequential, where each step depends on the outcome of the preceding step,” he said. “Sometimes, you can split up the work among a bunch of processors, but other times, that’s harder to do.” And often the software isn’t written to take full advantage of the extra processors. “If you hire 20 people to do something, will it happen 20 times faster?” Aaronson said. “Usually not.”

Researchers also face challenges in integrating very differently structured data sets, as well as the difficulty of moving large amounts of data efficiently through a highly distributed network.

Those issues will become more pronounced as the size and complexity of data sets continue to grow faster than computing resources, according to California Institute of Technology physicist Harvey Newman, whose team developed the LHC’s grid of data centers and trans-Atlantic network. He estimates that if current trends hold, the computational needs of big data analysis will place considerable strain on the computing fabric. “It requires us to think about a different kind of system,” he said.

Memory and Movement

Emmanuel Candes, an applied mathematician at Stanford University, was once able to crunch big data problems on his desktop computer. But last year, when he joined a collaboration of radiologists developing dynamic magnetic resonance imaging — whereby one could record a patient’s heartbeat in real time using advanced algorithms to create high-resolution videos from limited MRI measurements — he found that the data no longer fit into his computer’s memory, making it difficult to perform the necessary analysis.

Addressing the storage-capacity challenges of big data is not simply a matter of building more memory, which has never been more plentiful. It is also about managing the movement of data. That’s because, increasingly, the desired data is no longer at people’s fingertips, stored in a single computer; it is distributed across multiple computers in a large data center or even in the “cloud.”There is a hierarchy to data storage, ranging from the slowest, cheapest and most abundant memory to the fastest and most expensive, with the least available space. At the bottom of this hierarchy is so-called “slow memory” such as hard drives and flash drives, the cost of which continues to drop. There is more space on hard drives, compared to the other kinds of memory, but saving and retrieving the data takes longer. Next up this ladder comes RAM, which is must faster than slow memory but offers less space is more expensive. Then there is cache memory — another trade-off of space and price in exchange for faster retrieval speeds — and finally the registers on the microchip itself, which are the fastest of all but the priciest to build, with the least available space. If memory storage were like real estate, a hard drive would be a sprawling upstate farm, RAM would be a medium-sized house in the suburbs, cache memory would be a townhouse on the outskirts of a big city, and the register memory would be a tiny studio in a prime urban location.

Longer commutes for stored data translate into processing delays. “When computers are slow today, it’s not because of the microprocessor,” Aaronson said. “The microprocessor is just treading water waiting for the disk to come back with the data.” Big data researchers prefer to minimize how much data must be moved back and forth from slow memory to fast memory. The problem is exacerbated when the data is distributed across a network or in the cloud, because it takes even longer to move the data back and forth, depending on bandwidth capacity, so that it can be analyzed.

One possible solution to this dilemma is to embrace the new paradigm. In addition to distributed storage, why not analyze the data in a distributed way as well, with each unit (or node) in a network of computers performing a small piece of a computation? Each partial solution is then integrated to find the full result. This approach is similar in concept to the LHC’s, in which one complete copy of the raw data (after filtering) is stored at the CERN research facility in Switzerland that is home to the collider. A second copy is divided into batches that are then distributed to data centers around the world. Each center analyzes its chunk of data and transmits the results to regional computers before moving on to the next batch.

Alon Halevy, a computer scientist at Google, says the biggest breakthroughs in big data are likely to come from data integration.Image: Peter DaSilva for Quanta Magazine

Boyd’s system is based on so-calledconsensus algorithms. “It’s a mathematical optimization problem,” he said of the algorithms. “You are using past data to train the model in hopes that it will work on future data.” Such algorithms are useful for creating an effective SPAM filter, for example, or for detecting fraudulent bank transactions.

This can be done on a single computer, with all the data in one place. Machine learning typically uses many processors, each handling a little bit of the problem. But when the problem becomes too large for a single machine, a consensus optimization approach might work better, in which the data set is chopped into bits and distributed across 1,000 “agents” that analyze their bit of data and each produce a model based on the data they have processed. The key is to require a critical condition to be met: although each agent’s model can be different, all the models must agree in the end — hence the term “consensus algorithms.”

The process by which 1,000 individual agents arrive at a consensus model is similar in concept to the Mechanical Turk crowd-sourcing methodology employed by Amazon — with a twist. With the Mechanical Turk, a person or a business can post a simple task, such as determining which photographs contain a cat, and ask the crowd to complete the task in exchange for gift certificates that can be redeemed for Amazon products, or for cash awards that can be transferred to a personal bank account. It may seem trivial to the human user, but the program learns from this feedback, aggregating all the individual responses into its working model, so it can make better predictions in the future.

In Boyd’s system, the process is iterative, creating a feedback loop. The initial consensus is shared with all the agents, which update their models in light of the new information and reach a second consensus, and so on. The process repeats until all the agents agree. Using this kind of distributed optimization approach significantly cuts down on how much data needs to be transferred at any one time.

The Quantum Question

Late one night, during a swanky Napa Valley conference last year, MIT physicist Seth Lloyd found himself soaking in a hot tub across from Google’s Sergey Brin and Larry Page — any aspiring technology entrepreneur’s dream scenario. Lloyd made his pitch, proposing a quantum version of Google’s search engine whereby users could make queries and receive results without Google knowing which questions were asked. The men were intrigued. But after conferring with their business manager the next day, Brin and Page informed Lloyd that his scheme went against their business plan. “They want to know everything about everybody who uses their products and services,” he joked.

It is easy to grasp why Google might be interested in a quantum computer capable of rapidly searching enormous data sets. A quantum computer, in principle, could offer enormous increases in processing power, running algorithms significantly faster than a classical (non-quantum) machine for certain problems. Indeed, the company just purchased a reportedly $15 million prototype from a Canadian firm called D-Wave Systems, although the jury is still out on whether D-Wave’s product is truly quantum.

“This is not about trying all the possible answers in parallel. It is fundamentally different from parallel processing,” said Aaronson. Whereas a classical computer stores information as bits that can be either 0s or 1s, a quantum computer could exploit an unusual property: the superposition of states. If you flip a regular coin, it will land on heads or tails. There is zero probability that it will be both heads and tails. But if it is a quantum coin, technically, it exists in an indeterminate state of both heads and tails until you look to see the outcome.

A true quantum computer could encode information in so-called qubits that can be 0 and 1 at the same time. Doing so could reduce the time required to solve a difficult problem that would otherwise take several years of computation to mere seconds. But that is easier said than done, not least because such a device would be highly sensitive to outside interference: The slightest perturbation would be equivalent to looking to see if the coin landed heads or tails, and thus undo the superposition.

Data from a seemingly simple query about coffee production across the globe can be surprisingly difficult to integrate. Image: Peter DaSilva for Quanta Magazine

However, Aaronson cautions against placing too much hope in quantum computing to solve big data’s computational challenges, insisting that if and when quantum computers become practical, they will be best suited to very specific tasks, most notably to simulate quantum mechanical systems or to factor large numbers to break codes in classical cryptography. Yet there is one way that quantum computing might be able to assist big data: by searching very large, unsorted data sets — for example, a phone directory in which the names are arranged randomly instead of alphabetically.

It is certainly possible to do so with sheer brute force, using a massively parallel computer to comb through every record. But a quantum computer could accomplish the task in a fraction of the time. That is the thinking behind Grover’s algorithm, which was devised by Bell Labs’ Lov Grover in 1996. However, “to really make it work, you’d need a quantum memory that can be accessed in a quantum superposition,” Aaronson said, but it would need to do so in such a way that the very act of accessing the memory didn’t destroy the superposition, “and that is tricky as hell.”

In short, you need quantum RAM (Q-RAM), and Lloyd has developed a conceptual prototype, along with an accompanying program he calls a Q-App (pronounced “quapp”) targeted to machine learning. He thinks his system could find patterns within data without actually looking at any individual records, thereby preserving the quantum superposition (and the users’ privacy). “You can effectively access all billion items in your database at the same time,” he explained, adding that “you’re not accessing any one of them, you’re accessing common features of all of them.”

For example, if there is ever a giant database storing the genome of every human being on Earth, “you could search for common patterns among different genes” using Lloyd’s quantum algorithm, with Q-RAM and a small 70-qubit quantum processor while still protecting the privacy of the population, Lloyd said. The person doing the search would have access to only a tiny fraction of the individual records, he said, and the search could be done in a short period of time. With the cost of sequencing human genomes dropping and commercial genotyping services rising, it is quite possible that such a database might one day exist, Lloyd said. It could be the ultimate big data set, considering that a single genome is equivalent to 6 billion bits.

Lloyd thinks quantum computing could work well for powerhouse machine-learning algorithms capable of spotting patterns in huge data sets — determining what clusters of data are associated with a keyword, for example, or what pieces of data are similar to one another in some way. “It turns out that many machine-learning algorithms actually work quite nicely in quantum computers, assuming you have a big enough Q-RAM,” he said. “These are exactly the kinds of mathematical problems people try to solve, and we think we could do very well with the quantum version of that.”

The Future Is Integration

“No matter how much you speed up the computers or the way you put computers together, the real issues are at the data level.”

Google’s Alon Halevy believes that the real breakthroughs in big data analysis are likely to come from integration — specifically, integrating across very different data sets. “No matter how much you speed up the computers or the way you put computers together, the real issues are at the data level,” he said. For example, a raw data set could include thousands of different tables scattered around the Web, each one listing crime rates in New York, but each may use different terminology and column headers, known as “schema.” A header of “New York” can describe the state, the five boroughs of New York City, or just Manhattan. You must understand the relationship between the schemas before the data in all those tables can be integrated.

That, in turn, requires breakthroughs in techniques to analyze the semantics of natural language. It is one of the toughest problems in artificial intelligence — if your machine-learning algorithm aspires to perfect understanding of nearly every word. But what if your algorithm needs to understand only enough of the surrounding text to determine whether, for example, a table includes data on coffee production in various countries so that it can then integrate the table with other, similar tables into one common data set? According to Halevy, a researcher could first use a coarse-grained algorithm to parse the underlying semantics of the data as best it could and then adopt a crowd-sourcing approach like a Mechanical Turk to refine the model further through human input. “The humans are training the system without realizing it, and then the system can answer many more questions based on what it has learned,” he said.

Chris Mattmann, a senior computer scientist at NASA’s Jet Propulsion Laboratory and director at theApache Software Foundation, faces just such a complicated scenario with a research project that seeks to integrate two different sources of climate information: remote-sensing observations of the Earth made by satellite instrumentation and computer-simulated climate model outputs. The Intergovernmental Panel on Climate Change would like to be able to compare the various climate models against the hard remote-sensing data to determine which models provide the best fit. But each of those sources stores data in different formats, and there are many different versions of those formats.

Many researchers emphasize the need to develop a broad spectrum of flexible tools that can deal with many different kinds of data. For example, many users are shifting from traditional highly structured relational databases, broadly known as SQL, which represent data in a conventional tabular format, to a more flexible format dubbed NoSQL. “It can be as structured or unstructured as you need it to be,” said Matt LeMay, a product and communications consultant and the former head of consumer products at URL shortening and bookmarking service Bitly, which uses both SQL and NoSQL formats for data storage, depending on the application.

Mattmann cites an Apache software program called Tika that allows the user to integrate data across 1,200 of the most common file formats. But in some cases, some human intervention is still required. Ultimately, Mattmann would like to fully automate this process via intelligent software that can integrate differently structured data sets, much like the Babel Fish in Douglas Adams’ “Hitchhiker’s Guide to the Galaxy” book series enabled someone to understand any language.

Integration across data sets will also require a well-coordinated distributed network system comparable to the one conceived of by Newman’s group at Caltech for the LHC, which monitors tens of thousands of processors and more than 10 major network links. Newman foresees a computational future for big data that relies on this type of automation through well-coordinated armies of intelligent agents, that track the movement of data from one point in the network to another, identifying bottlenecks and scheduling processing tasks. Each might only record what is happening locally but would share the information in such a way as to shed light on the network’s global situation.

“Thousands of agents at different levels are coordinating to help human beings understand what’s going on in a complex and very distributed system,” Newman said. The scale would be even greater in the future, when there would be billions of such intelligent agents, or actors, making up a vast global distributed intelligent entity. “It’s the ability to create those things and have them work on one’s behalf that will reduce the complexity of these operational problems,” he said. “At a certain point, when there’s a complicated problem in such a system, no set of human beings can really understand it all and have access to all the information.”