Arquivo da tag: Carbono

Rich nations could see ‘double climate dividend’ by switching to plant-based foods (Carbon Brief)

carbonbrief.org

Ayesha Tandon

10.01.2022 | 4:00pm


Adopting a more plant-based diet could give rich countries a “double climate dividend” of lower emissions and more land for capturing carbon, a new study says.

Animal-based foods have higher carbon and land footprints than their plant-based alternatives, and are most commonly consumed in high-income countries. The study, published in Nature Food, investigates how the global food system would change if 54 high-income countries were to shift to a more plant-based diet.

High-income countries could cut their agricultural emissions by almost two-thirds through dietary change, the authors find. They add that moving away from animal-based foods could free up an area of land larger than the entire European Union.

If this land were all allowed to revert to its natural state, it would capture almost 100bn tonnes of carbon – equal to 14 years of global agricultural emissions – the authors note. They add that this level of carbon capture “could potentially fulfil high-income countries’ CO2 removal obligations needed to limit warming to 1.5C under equality sharing principles”.

The US, France, Australia and Germany would collectively see roughly half of the total carbon benefits, the study notes, because meat and dairy production and consumption are high in these countries.

‘Double climate dividend’

Feeding the world’s population of almost eight billion people is no small task. The global food system is responsible for around one-third of all human-caused greenhouse gas emissions, and half of the planet’s habitable land is used to produce food.

However, not all calories have an equal impact on the planet. On average, animal-based foods produce 10-50 times more emissions than plant-based foods. Meanwhile, livestock takes up nearly 80% of global agricultural land, despite producing less than 20% of the world’s supply of calories.

Individuals in high-income nations currently have the greatest potential to reduce greenhouse gas emissions through their dietary choices, because their diets are usually the most meat-orientated. Animal-derived products drive 70% of food-system emissions in high-income countries but only 22% in low–middle-income countries.

(In 2019, Carbon Brief produced a week-long series of articles on food systems, including a discussion of the climate impacts of meat and dairy, and expert views on how changing diets are expected to affect the climate.)

The study explores how the carbon footprint of food production could change if 54 high-income countries were to adopt the EAT-Lancet planetary health diet. This is a mainly plant-based diet that is “flexible by providing guidelines to ranges of different food groups that together constitute an optimal diet for human health and environmental sustainability”. 

Dr Paul Behrens from Leiden University, an author on the paper, tells Carbon Brief that the diet varies between countries to account for their “local production and food cultures”.

The study investigates the immediate reduction in emissions from adopting the EAT-Lancet diet using a dataset from the 2010 Food and Agriculture Organization’s statistical Database, linked at the national level to the Food and Agriculture Biomass Input–Output dataset (FABIO).

The authors also determine how much land could be spared by a shift in diet. They use global crop and pasture maps – combined with soil carbon and vegetation maps – to quantify how much extra carbon could be drawn down by soil and vegetation if this surplus land were allowed to revert to its natural state of mixed native grassland and forest. 

As well as investigating changes in the 54 high-income countries, the study follows the trade of food between nations to see how dietary shifts in one country can affect the food-related land and carbon footprints around the world.

The analysis is performed for the 54 high-income countries available in FABIO. For example, Chile is considered a high-income country, while India is not.

The map below shows the drop in greenhouse gas emissions from global agriculture if the 54 high-income countries were to shift to the EAT-Lancet planetary health diet. Dark red shading indicates the largest reductions. Changes in lower-income countries are due to knock-on impacts for food trade.

According to the study, high-income nations could reduce their agricultural emissions by 62% by shifting to a more plant-based diet. Dr Sonja Vermeulen is the lead global food scientist at WWF, and is not involved in the study. She helped to put this figure into perspective:

“To put this in perspective, it’s about the same positive impact as all countries signing up to and implementing the COP26 declaration on the transition to 100% zero emission cars and vans globally by 2040.” 

Freeing up land

The study finds that moving away from animal-based foods could free an area of land larger than the entire European Union. If this area were allowed to revert to its natural state, it would capture around 100bn tonnes of carbon – equal to 14 years of global agricultural emissions from 2010 – by the end of the century, the authors find.  

The map below shows the potential carbon sequestration from surplus land if the 54 high-income countries were to shift to the EAT-Lancet planetary health diet, with dark green shading indicating the largest potential. Changes in lower-income countries are due to knock-on impacts for food trade. 

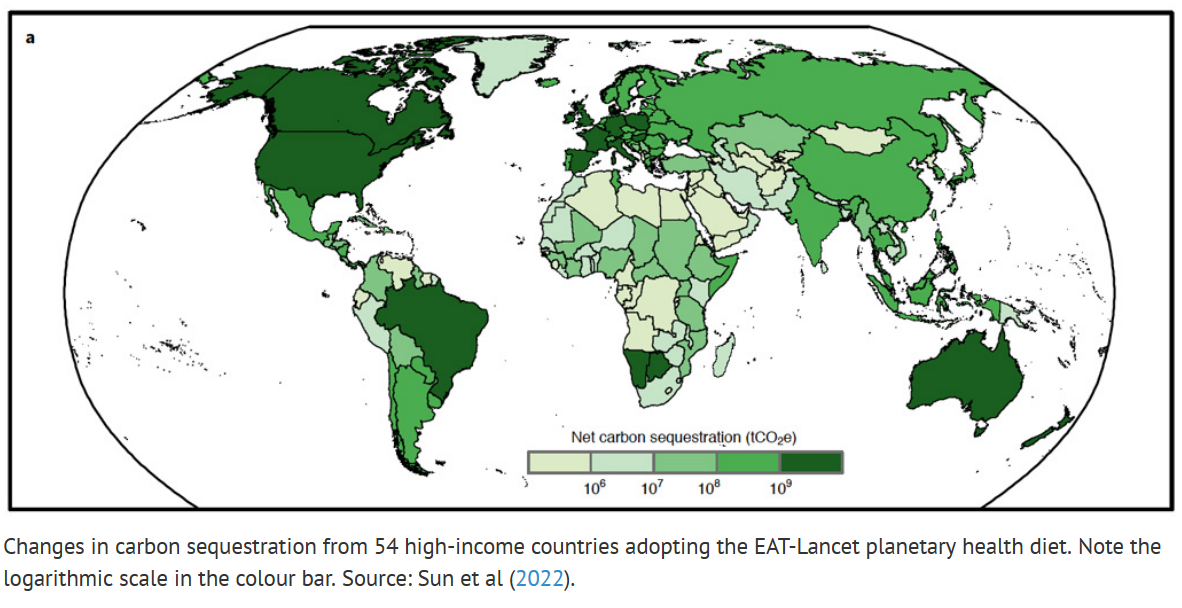
Approximately half of the carbon benefit from cutting emissions and increasing carbon sequestration could be seen collectively in the US, France, Australia and Germany, the study says.

The authors also highlight that, according to past research, limiting warming to 1.5C above pre-industrial levels requires the 54 high-income countries in this analysis to achieve cumulative CO2 removals of 85-531bn tonnes of CO2 by the end of the century. This range comes from uncertainty in the amount of CO2 removal required, and in the amount that should be allocated to each country.

Based on these numbers, the study concludes that the 100bn carbon sequestration “could potentially fulfil high-income countries’ CO2 removal obligations needed to limit warming to 1.5C under equality sharing principles”.

The study finds that many low and mid-income countries – such as Brazil, India and Botswana – would export less food to high-income nations if they consumed less meat. This would reduce their own agricultural emissions and free up land for drawing down carbon, despite no dietary changes in their own countries, the researchers say. (The study does not assess the economic impact of this reduced trade.)

Around two-thirds of the carbon sequestration potential from dietary changes in high-income countries is domestic, the study finds. Meanwhile, almost a quarter is located in other high-income countries and around an eighth is from low and middle income countries.

Dr Nynke Schulp is an associate professor of land use, lifestyle and ecosystem change at the Vrije Universiteit Amsterdam, and was not involved in the study. She tells Carbon Brief that existing studies “tend to work from the assumption that the whole world adopts a specific dietary change”, and so “this study’s focus on dietary change in high-income nations is an important nuance, both from a mitigation potential perspective and from a climate justice perspective”.

Capturing carbon

The study assumes that any land freed up by a change in diet would be allowed to revert to its natural state through a “natural climate solution” called passive restoration, in which land is allowed to revert to its past state. Behrens explains in a press release that this technique has a range of co-benefits, including “water quality, biodiversity, air pollution and access to nature, to name just a few”.

The study breaks down the carbon sequestration potential of passive restoration into three categories: aboveground biomass carbon (AGBC), belowground biomass carbon (BGBC) and soil organic carbon (SOC) stocks. These refer to carbon held in plant matter above the soil, plant matter below the soil, and the soil itself, respectively.

The plot below shows the total carbon sequestration (left) and emissions reductions (right) potentials from a range of different food types. The red lines on the left and right mark fixed values to make comparisons between the charts easier. Note that carbon sequestration is shown as a total over the 21st century, while the reduction in emissions is shown per year.

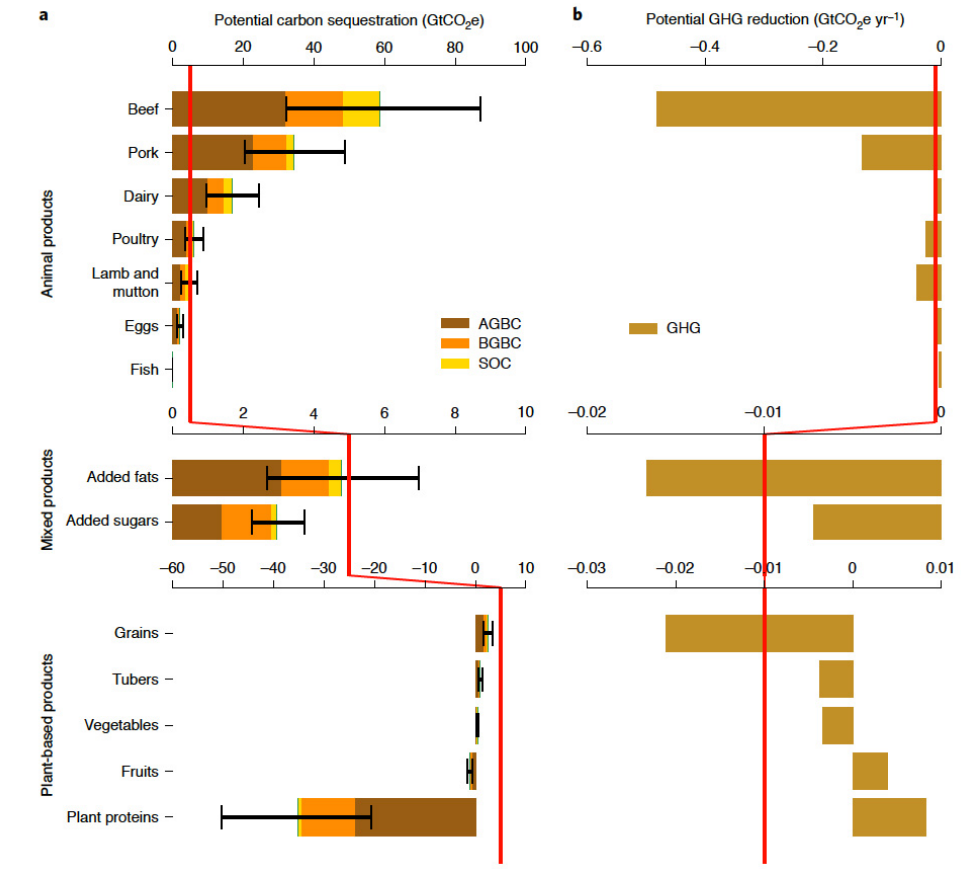
The plot shows that animal-based products – most notably beef – have high carbon and land footprints. The authors highlight that the US and Australia in particular would see benefits from reducing their beef intake, due to their high domestic production and consumption. 

Vermeulen tells Carbon Brief that changing diets in these countries could “transform” them:

“The term ‘food system transformation’ is perhaps often used too lightly – but there can be no doubt that the changes in these places would constitute total transformation of local economies, landscapes and cultures. Imagine the vast cattle ranches of the US and Australia replaced with equally vast rewilded or repurposed lands – would these be used for biomass and bioenergy, or conservation and biodiversity, and how would rural communities create new livelihoods for themselves?”

Dietary choices

High-income countries could see the largest per-capita carbon reductions by shifting to a planet-friendly diet, the study concludes. However, asking individuals to take charge of their personal carbon footprints can be a controversial area of discussion.

For example, the authors note that alcoholic beverages and “stimulants” including coffee, cocoa products and tea comprise 5.8% of dietary greenhouse gas emissions. These “luxury, low-nutrition crops” are predominantly consumed in high-income countries and present a “non-negligible” opportunity for cutting emissions and capturing carbon, according to the study. However, “sociological and policy complications” would make it difficult to reduce consumption of these products in practice, the authors say.

They also highlight that eating more offal – a co-product of meat production – could be a good way for individuals to reduce their meat-related carbon footprints. However, the authors say that offal is “not typically consumed in high-income nations due to convention and consumer preference”.

Dr Matthew Hayek is an assistant professor in the Department of Environmental Studies at NYU arts and science, who was not involved in the study. He tells Carbon Brief how governments could incentivise individuals to eat more sustainably: 

“Folks in developed countries eat far more meat and dairy than the global average… Reducing emissions from food consumption in rich countries is critical. For consumers who have ample food choices, these choices play a sizable role in contributing to our climate goals. Our policies must reflect this by making healthy and sustainable food choices more prevalent, convenient, and inexpensive.”

And Behrens tells Carbon Brief that “the onus is on high-income nations to transform food systems”. In the press release, he adds:

“It will be vital that we redirect agricultural subsidies to farmers for biodiversity protection and carbon sequestration. We must look after farming communities to enable this in a just food transition. We don’t have to be purist about this, even just cutting animal intake would be helpful. Imagine if half of the public in richer regions cut half the animal products in their diets, you’re still talking about a massive opportunity in environmental outcomes and public health.”

Sun, Z. et al. (2022) Dietary change in high-income nations alone can lead to substantial double climate dividend, Nature Food, doi: 10.1038/s43016-021-00431-5

66% das emissões brasileiras de CO2 vêm de atividade agropecuária (Folha de S.Paulo)

Phillippe Watanabe

06/09/2016

O desmatamento, de modo isolado, libera as emissões de gases

A agropecuária é a responsável pela maior parte da emissão de gases estufa no Brasil. Quando considerados desmatamento para atividade agropecuária e o exercício direto dela, a porcentagem das emissões chega a cerca de 66%.

Os dados são do Seeg (Sistema de Estimativa de Emissão de Gases Estufa), realizado pelo OC (Observatório do Clima). O relatório, lançado nesta terça (6), na sede do SOS Mata Atlântica, analisa a evolução histórica das emissões brasileiras.

Considerando dados referentes ao ano de 2014, de forma direta, 23% das emissões de CO2 no Brasil são provenientes da agropecuária. Dentro desse universo, 76% das emissões estão relacionadas à pecuária, sendo 64% derivados do consumo de carne (bovinos de corte), segundo dados da Imaflora, parte do OC.

A mudança de uso da terra é líder de emissões no país, com cerca 42%. O termo, de forma geral, se refere aos desmatamentos, normalmente associados à atividade agropecuária. Esse tipo de emissão somado aos 23% emitidos diretamente pela ação agropecuária alcançam o valor aproximado de 66%.

Segundo dados do Imazon, também parte do OC, com uma melhor aplicação da legislação ambiental atual seria possível aumentar a arrecadação em mais de R$ 1 bilhão por ano.

A energia é a segunda colocada entre as fontes dos gases estufa, com 26%. Essas emissões vêm crescendo anualmente, em parte por conta da crise na produção de energia hidrelétrica.

Segundo o Instituto de Energia e Meio Ambiente, que também faz parte do OC, quase metade (46%) das emissões relacionadas à energia estão associadas ao transporte, tanto de carga quanto de passageiros.

FUTURO

Os dados levantados pelo OC mostram que o Brasil, caso cumpra os compromissos firmados no Acordo de Paris, como restauração e reflorestamento de matas, recuperação de pastos, entre outros, conseguirá reduzir as emissões de gases estufa mais do que o planejado no INDC (Contribuições Nacionalmente Determinadas Pretendidas).

“O nosso estudo aponta que dá para ser mais ambicioso”, afirma Tasso de Azevedo, coordenador do Seeg.

Sequestro de CO2 (Pesquisa Fapesp)

Reunimos o que já publicamos sobre o processo de captura de dióxido de carbono da atmosfera, que se dá sobretudo em florestas e oceanos e ajuda a manter equilibrados os níveis de CO2 na atmosfera

Edição Online 13:10 27 de junho de 2016


mini Florestas secundárias podem contribuir para mitigar as mudanças climáticas
Se protegido adequadamente, esse tipo de vegetação neutralizaria as emissões da América Latina e do Caribe acumuladas entre 1993 e 2014 |Junho/2016|
MAR_Abre-Boletim Fundo do mar teve estoque de carbono
Circulação de água no Oceano Atlântico pode explicar baixos níveis de CO2 atmosférico no Último Máximo Glacial |Junho/2016|
Árvores da Amazônia geram novas folhas mesmo durante a seca
Estocagem de água no solo no período de chuvas é crucial nesse processo, segundo estudo publicado na revista Science |Fevereiro/2016|
Extinção de animais pode agravar efeito das mudanças climáticas
Ausência de espécies frugívoras de grande porte pode interferir no processo de sequestro de CO2 da atmosfera |Dezembro/2015|
Florestas em transformação
Trepadeiras estão remodelando a Amazônia, e os bambus, a mata atlântica |Outubro/2014|
068-069_Algas_222 Microalgas transformadas
Membrana que filtra meio de cultura permite selecionar biomassa com proteínas, ácidos graxos ou carboidratos |Agosto/2014|
022-027_Entrevista_217 Entrevista: Luciana Vanni Gatti
Química explica estudo sobre o balanço de carbono na Amazônia |Março/2014|
036-041_Manguezais_216 Rede de proteção
Manguezais ganham importância diante de alterações no clima |Fevereiro/2014|
brown_river_small Emissão desequilibrada
Floresta amazônica pode estar enviando mais CO2 à atmosfera durante período de seca |Fevereiro/2014|
030-033_cana_159 Balanço sustentável
Estudo da Embrapa atualiza as vantagens do etanol no combate aos gases causadores do efeito estufa |Maio/2009|
chuva As poderosas águas dos rios
Turbinadas pelo aquecimento global, variações no regime de chuvas na bacia do Prata podem tumultuar a circulação marinha no Sul e Sudeste |Janeiro/2008|
Castanheira da amazônia Abrindo o guarda-chuva verde
As cidades precisam de mais árvores, mas há prós e contras em plantar mais exemplares no meio urbano |Outubro/2007|
art3269img1 Tecnologia contra o aquecimento global
Brasil sai na frente com etanol, biodiesel e plantio direto |Junho/2007|
art3179img1 O dia depois de amanhã
Pesquisadores unem-se para esmiuçar os efeitos do aquecimento global no Brasil|Março/2007|
botanica O jatobá contra a poluição
Árvores tropicais podem ser opção para limpar atmosfera caso o efeito estufa aumente|Outubro/2002|
Castanheira da amazônia Impactos irreversíveis do desmatamento
Mata recuperada absorve menos gás carbônico do que até agora se pensava |Abril/2000|

Hurricanes key to carbon uptake by forests (Science Daily)

Increases in carbon uptake by southeast US forests in response to tropical cyclone activity alone exceed carbon emissions by American vehicles each year.

Date:
May 2, 2016
Source:
Duke University
Summary:
New research reveals that the increase in forest photosynthesis and growth made possible by tropical cyclones in the southeastern United States captures hundreds of times more carbon than is released by all vehicles in the US in a given year.

This map shows the total increase of photosynthesis and carbon uptake by forests caused by all hurricanes in 2004. The dotted gray lines represent the paths of the individual storms. Credit: Lauren Lowman, Duke University

While hurricanes are a constant source of worry for residents of the southeastern United States, new research suggests that they have a major upside — counteracting global warming.

Previous research from Duke environmental engineer Ana Barros demonstrated that the regular landfall of tropical cyclones is vital to the region’s water supply and can help mitigate droughts.

Now, a new study from Barros reveals that the increase in forest photosynthesis and growth made possible by tropical cyclones in the southeastern United States captures hundreds of times more carbon than is released by all vehicles in the U.S. in a given year.

The study was published online on April 20, 2016, in the Journal of Geophysical Research — Biogeosciences.

“Our results show that, while hurricanes can cause flooding and destroy city infrastructure, there are two sides to the story,” said Barros, the James L. Meriam Professor of Civil and Environmental Engineering at Duke University. “The other side is that hurricanes recharge the aquifers and have an enormous impact on photosynthesis and taking up carbon from the atmosphere.”

In the study, Lauren Lowman, a doctoral student in Barros’s laboratory, used a hydrological computer model to simulate the ecological impacts of tropical cyclones from 2004-2007. The earlier years of that time period had a high number of tropical cyclone landfall events, while the latter years experienced relatively few.

By comparing those disparate years to simulations of a year without tropical cyclone events, Lowman was able to calculate the effect tropical cyclones have on the rates of photosynthesis and carbon uptake in forests of the southeastern United States.

“It’s easy to make general statements about how much of an impact something like additional rainfall can have on the environment,” said Lowman. “But we really wanted to quantify the amount of carbon uptake that you can relate to tropical cyclones.”

According to Barros and Lowman, it is difficult to predict what effects climate change will have on the region’s future. Even if the number of tropical cyclones that form in the Atlantic increases, that doesn’t guarantee that the number making landfall will also rise. And long-term forecasts for the region’s temperature and rainfall currently show less change than normal year-to-year variability.

But no matter what the future brings, one thing is clear — the regularity and number of tropical cyclones making landfall will continue to be vital.

“There are a lot of regional effects competing with large worldwide changes that make it very hard to predict what climate change will bring to the southeastern United States,” said Barros. “If droughts do become worse and we don’t have these regular tropical cyclones, the impact will be very negative. And regardless of climate change, our results are yet one more very good reason to protect these vast forests.”

This research was funded in part by the National Science Foundation Coupled Human and Natural Systems Program (CNH-1313799) and an earlier grant from the National Oceanic and Atmospheric Administration (NA08OAR4310701).


Journal Reference:

  1. Lauren E. L. Lowman, Ana P. Barros. Interplay of Drought and Tropical Cyclone Activity in SE US Gross Primary ProductivityJournal of Geophysical Research: Biogeosciences, 2016; DOI: 10.1002/2015JG003279

Pecuária é responsável por 15% dos gases do efeito estufa (O Globo)

Renato Grandelle, 24/11/2015

Desmatamento na Região de Xapuri no Acre – Gustavo Stephan/ 05-12-2013

RIO— Parte expressiva da liberação de carbono na atmosfera fica bem longe da fumaça liberada por usinas ou carros. Um novo estudo do Chatham House, o Real Instituto de Relações Internacionais do Reino Unido, indica que cerca de 15% dos poluentes que levam ao aquecimento global são provenientes da pecuária — seja pelo metano da digestão e estrume dos animais, ou pela produção de culturas para alimentação. De acordo com o relatório “Mudanças climáticas, mudanças na alimentação”, reduzir a quantidade de carne no prato é fundamental para assegurar que a temperatura global não avance mais do que 2 graus Celsius neste século.

O planeta, porém, ignora a recomendação. Estima-se que, com o aumento da classe média nos países em desenvolvimento — especialmente na China e no Brasil —, o consumo de carne crescerá até 76% nos próximos 35 anos.

Mudar a alimentação pode cortar pela metade os custos das futuras medidas contra o aquecimento global. E o clima não será a única área favorecida pela nova dieta. Coautora do estudo, Laura Wellesley ressalta que conter o consumo exagerado de carne também traz benefícios imediatos à saúde.

— Não estamos sugerindo que todo mundo deve se tornar vegetariano. A carne, consumida com moderação, pode fazer parte de uma dieta saudável para o indivíduo e o meio ambiente — ressalta. — De acordo com a Escola de Medicina de Harvard, a porção diária não deve ultrapassar 70 gramas, que é um hambúrguer de tamanho médio. Se nada for feito para nos limitarmos a este valor, os padrões alimentares atuais serão incompatíveis com o aumento de temperatura de apenas 2 graus Celsius.

DIETA SAUDÁVEL FORA DA COP-21

Atualmente, o consumo dos brasileiros é de duas vezes e meia a quantidade diária recomendada; nos EUA, é de três vezes mais. Um estudo divulgado em outubro pela Organização Mundial de Saúde alertou que a ingestão exagerada de carnes vermelhas e processadas pode levar à ocorrência de doenças não transmissíveis, principalmente o câncer.

— Mudanças de alimentação devem estar no topo da lista das discussões na Conferência do Clima de Paris (COP-21). É uma estratégia rápida e econômica para conter as emissões de gases-estufa — avalia Laura.

Ainda assim, o debate sobre a dieta mundial deve ficar fora da mesa de negociações da COP-21. Para os pesquisadores do Chatham House, os governos temem que campanhas reivindicando limitações ao consumo de carne desagradem a opinião pública e a indústria de alimentos.

Desde o início do ano, cerca de 150 países apresentaram à ONU metas voluntárias para cortar a emissão de gases de efeito estufa. A diminuição do consumo de carne não foi mencionada em nenhum projeto.

— Como são cautelosos em assumir um risco, os governos têm favorecido a inércia e permanecem em silêncio sobre a questão das dietas sustentáveis — lamenta Laura. — As pesquisas revelam que inicialmente muitas pessoas não gostam da ideia de comer menos carne, e por isso são resistentes à ideia de intervenção do poder público. No entanto, depois que são informadas sobre a relação entre dieta e clima, a maioria recomenda que o governo promova intervenções e forneça orientações e incentivos para a mudança na alimentação.

No Brasil, diz o levantamento, a população sente orgulho da pecuária, mas demonstra preocupação com sua potencial expansão desordenada para a Floresta Amazônica. A pecuária é uma das atividades econômicas mais importantes do país — representa 6,8% do PIB —, mas também corresponde a uma das mais ineficientes do mundo, já que é baseada na prática extensiva. Os lucros estão no tamanho da área usada, e não na eficiência produtiva. No Cerrado há, em média, apenas 1 boi por hectare — estima-se que é possível triplicar esta ocupação sem qualquer comprometimento dos rendimentos do setor.

A força econômica da pecuária e o hábito do consumo exagerado de carne — a “tradição do churrasco de fim de semana”, como destaca o Chatham House — são os maiores obstáculos para que o governo federal desenvolva projetos que promovam a alimentação saudável e, ao mesmo tempo, aumente o alerta da população contra as mudanças climáticas. O brasileiro é conhecido como um dos povos mais preocupados no mundo com o aquecimento global, mas nunca foi informado sobre sua ligação com mudanças na dieta.

Site monitora em tempo real emissões de CO2 do setor elétrico no Brasil (Estadão)

Giovana Girardi

19/11/2015

Produção em termoelétricas cresceu 171,2% de 2011 a 2014 

Produção em termoelétricas cresceu 171,2% de 2011 a 2014 

De 2011 a 2014, as emissões de gases de efeito estufa do setor elétrico no Brasil cresceram 171%, enquanto a geração de energia subiu apenas 11%. A quantidade de gás carbônico (CO2) emitido por gigawatt de energia gerado passou de 32,26 para 133. Hoje o País – conhecido por ter uma matriz elétrica mais limpa, por conta da forte presença de hidrelétricas – está sujando sua geração de energia.

Dados como esses, na escala de anos, meses, semanas e dias, estão disponíveis a partir desta quinta-feira, 19, em uma nova ferramenta que monitora a geração e as emissões do setor no País. Trata-se de um subproduto do Seeg – sistema que estima desde 2013 as emissões anuais de gases de efeito estufa brasileiras. O levantamento, que traz dados totais e por setor, é feito paralelamente ao oficial do governo federal e tem oferecido essas informações de modo mais ágil.

Além dos dados anuais, agora também será possível acompanhar praticamente em tempo real como está se comportando o setor elétrico. A ferramenta entra no ar nesta quinta-feira junto com o novo relatório anual, que trará os dados de 2014. “Ter os dados anuais mostra a tendência e é muito importante. Mas aí as coisas já aconteceram. O que vemos no monitoramento em tempo real é que as decisões que são tomadas no dia a dia têm um tremendo impacto nas emissões. Isso acontece com o consumo de combustíveis, com a energia elétrica. Se mudar o preço do álcool ou da gasolina, por exemplo, muda a emissão. Então a gente queria capturar isso para poder fazer esse debate sobre as emissões e as decisões que a gente está tomando”, explica Tasso Azevedo, coordenador do Seeg.

O produto é o primeiro do que deve se tornar a série Seeg Monitor. “Começamos com o setor elétrico porque foi onde vimos que houve mais variação. Foi onde mais cresceram as emissões nos últimos quatro anos”, diz Azevedo. “E vemos que varia todo dia, toda semana, todo mês, com base nas decisões tomadas. Em três dias às vezes vemos uma variação de 15%”, complementa.

Crise hídrica. Ele se refere, por exemplo, à decisão de acionar mais as usinas termoelétricas, o que vem ocorrendo por conta da seca que atinge o País desde o ano passado. “Olhando para o monitor a gente consegue visualizar bem o que é a crise do setor elétrico”, comenta Larissa Rodrigues, da campanha de clima e energia do Greenpeace. A ONG colaborou com a elaboração da ferramenta, que foi capitaneada por técnicos do Instituto de Energia e Meio Ambiente (Iema).

O levantamento mostra que entre 2011 e 2014, a geração de eletricidade por fontes renováveis (hidráulica incluída) diminuiu 6,8%, por conta da seca. Outras fontes renováveis, principalmente eólica, subiram 67,2% no período. Mas a produção em termoelétricas cresceu muito mais: 171,2% – número que bate com o aumento das emissões.

“Ficam claros no monitor a sazonalidade das fontes e também como elas se complementam. Toda vez que a linha das hidrelétricas cai, a da eólica sobe”, afirma Marcelo Cremer, do Iema. Há uma tendência no País, especialmente para o Nordeste, de que se chove, não venta, e quando está seco, venta mais.

No site é possível acessar diversas informações. Logo no início há um gráfico que mostra os dados de geração elétrica do dia anterior, dividida pelas principais fontes (hidráulica, eólica, térmica a combustível renovável, térmica nuclear, térmica a combustível fóssil e térmica a combustível não identificado). Também dá para ver a geração nas usinas térmicas subdividida por combustível (carvão, petróleo, gás natural). A informação por dia está disponível até 1.º de janeiro de 2009. Nos próximos dias devem ser acrescentadas as informações até 2006.

Ao lado está um gráfico que mostra a evolução total das emissões do setor e por fonte de energia, também por dia, mês ou ano. Os dados representam a energia que circula na rede nacional, o chamado SIN (Sistema Interligado Nacional). Fontes isoladas e a geração distribuída (por exemplo, com solar nos telhados das casas) ainda não são contadas.

Outra opção de visualização é por subsistema gerador de energia: Norte, Nordeste, Sul, Sudeste e Centro-Oeste. E é possível fazer um zoom ainda maior na rede e olhar as emissões de cada usina do Brasil. O plano, para os próximos meses é oferecer mais informações, como outros poluentes emitidos e quanto de água está sendo consumido para o resfriamento de termoelétricas. A ideia é também traduzir como as escolhas do sistema nacional para a geração de energia refletem no valor da tarifa paga pelo consumidor.

Excitement grows as NASA carbon sleuth begins Year Two (Science Daily)

Date:
October 29, 2015
Source:
NASA/Jet Propulsion Laboratory
Summary:
Scientists busy poring over more than a year of data from NASA’s Orbiting Carbon Observatory-2 (OCO-2) mission are seeing patterns emerge as they seek answers to the science questions that drive the mission.

Global average carbon dioxide concentrations as seen by NASA’s Orbiting Carbon Observatory-2 mission, June 1-15, 2015. OCO-2 measures carbon dioxide from the top of Earth’s atmosphere to its surface. Higher carbon dioxide concentrations are in red, with lower concentrations in yellows and greens. Credit: NASA/JPL-Caltech

Scientists busy poring over more than a year of data from NASA’s Orbiting Carbon Observatory-2 (OCO-2) mission are seeing patterns emerge as they seek answers to the science questions that drive the mission.

Launched in July 2014, OCO-2, an experimental carbon-dioxide measurement mission, is designed to give the international science community a new view of the global carbon cycle in unprecedented detail. During its two-year primary mission, the satellite observatory is tracking the large-scale movement of carbon between Earth’s atmosphere, its plants and soil, and the ocean, from season to season and from year to year. OCO-2 began routine science operations in September 2014.

“We can already clearly see patterns of seasonal change and variations in carbon dioxide around the globe,” said Annmarie Eldering, OCO-2 deputy project scientist at NASA’s Jet Propulsion Laboratory in Pasadena, California. “Far more subtle features are expected to emerge over time.”

A new animation depicting the first full year of OCO-2 science operations is available at:

Armed with a full annual cycle of data, OCO-2 scientists are now beginning to study the net sources of carbon dioxide as well as their “sinks” — places in the Earth system that store carbon, such as the ocean and plants on land. This information will help scientists better understand the natural processes currently absorbing more than half the carbon dioxide emitted into the atmosphere by human activities. This is a key to understanding how Earth’s climate may change in the future as greenhouse gas concentrations increase.

The first year of data from the mission reveals a portrait of a dynamic, living planet. Between mid-May and mid-July 2015, OCO-2 saw a dramatic reduction in the abundance of atmospheric carbon dioxide across the northern hemisphere, as plants on land sprang to life and began rapidly absorbing carbon dioxide from the air to form new leaves, stems and roots. During this intense, two-month period, known as the “spring drawdown,” OCO-2 measurements show the concentration of atmospheric carbon dioxide over much of the northern hemisphere decreased by two to three percent. That’s 8 to 12 parts per million out of the global average background concentration of 400 parts per million.

“That’s a big but expected change,” said Eldering. “This is the first time we’ve ever had the opportunity to observe the spring drawdown across the entire northern hemisphere with this kind of spatial resolution, seeing changes from week to week.”

Also as expected, OCO-2 data show increased concentrations of carbon dioxide associated with human activities. Higher carbon dioxide levels of several parts per million are seen in regions where fossil fuels are being consumed by large power plants or megacities. Enhanced levels are also seen in the Amazon, Central Africa and Indonesia, where forests are being cleared and burned to create fields for agricultural use.

Researchers Abhishek Chatterjee of the Global Modeling and Assimilation Office at NASA’s Goddard Space Flight Center, Greenbelt, Maryland; and Michelle Gierach and Dave Schimel of JPL are investigating a strong correlation observed between atmospheric carbon dioxide over the Pacific Ocean and the current El Nino. Fluctuations in carbon dioxide appear to be strongly linked with warmer sea surface temperatures. OCO-2’s unprecedented density of measurements is giving researchers a unique data set to understand and separate the roles that sea surface temperatures, winds, regional emissions and other variables may be playing in the carbon dioxide concentrations.

“We believe 2016 will see breakthrough OCO-2 research results, as scientists work to unravel the mysteries of finding carbon dioxide sources and natural sinks,” said Eldering.

Through most of OCO-2’s first year in space, the mission team was busy calibrating its science instrument, learning how to process its massive amount of data, and delivering data products to NASA’s Goddard Earth Sciences Data and Information Services Center (GES-DISC) in Greenbelt, Maryland, for distribution to the world’s science community.

Scientists are comparing OCO-2 data to ground-based measurements to validate the satellite data and tie it to internationally accepted standards for accuracy and precision.

Routine delivery of OCO-2 data — calibrated spectra of reflected sunlight that reveal the fingerprints of carbon dioxide — began in late 2014, while estimates of carbon dioxide derived from cloud-free OCO-2 observations have been delivered since March 2015. Recently, the OCO-2 team reprocessed the OCO-2 data set to incorporate improvements in instrument calibration and correct other known issues with the original data release.

Every day, OCO-2 orbits Earth 14.5 times and collects and returns about a million measurements. After eliminating data contaminated by clouds, aerosols and steep terrain, between 10 to 13 percent of the measurements are of sufficient quality to derive accurate estimates of the average carbon dioxide concentration between Earth’s surface and space. That’s at least 100 times more carbon dioxide measurements than from all other sources of precise carbon dioxide data combined.

NASA uses the vantage point of space to increase our understanding of our home planet, improve lives and safeguard our future. NASA develops new ways to observe and study Earth’s interconnected natural systems with long-term data records. The agency freely shares this unique knowledge and works with institutions around the world to gain new insights into how our planet is changing.

For more information on OCO-2, visit:

http://www.nasa.gov/oco-2

For more information about NASA’s Earth science activities, visit:

http://www.nasa.gov/earth

Cortar emissões aumenta PIB (Observatório do Clima)

26/08/2015

 O biodiesel é uma das tecnologias de mitigação propostas. Foto: Agência Brasil

O biodiesel é uma das tecnologias de mitigação propostas. Foto: Agência Brasil

Por Cíntya Feitosa, do OC – 

Relatório produzido por grupo de 80 especialistas indica que economia cresce quase 4% mais com políticas mais ambiciosas de redução de gases-estufa até 2030.

Se o governo brasileiro ampliar medidas de redução de emissões de gases de efeito estufa em sua economia, o país pode crescer mais e com menos desigualdades sociais em 2030. A conclusão é de um grande estudo realizado durante um ano por um grupo de 80 especialistas, sob coordenação do Fórum Brasileiro de Mudanças Climáticas.

Segundo o estudo, o PIB (Produto Interno Bruto) do país pode chegar a R$ 5,68 trilhões em 2030 se forem adotadas medidas adicionais de redução de emissões no cenário mais ambicioso. A cifra é 3,98% maior do que o PIB previsto se forem adotadas apenas ações de mitigação já em curso, do atual Plano Nacional de Mudanças Climáticas. Com as ações sugeridas pelo relatório, o país pode chegar a 2030 emitindo 1 bilhão de toneladas de gás carbônico equivalente (CO2e), 39% a menos que o estimado com a adoção de ações governamentais já previstas (1,6 bilhão de toneladas) e 25% menos do que o país emitia em 1990. No cenário menos ambicioso, a redução de emissões é de 5% em relação a 1990, as emissões chegam a 1,3 bilhão de toneladas e o PIB fica 3,91% maior do que sem medidas adicionais.

De acordo com o “IES Brasil: Implicações Econômicas e Sociais: Cenários de Mitigação de GEE 2030”, 75% do potencial de abatimento de emissões tem custo abaixo de US$ 20 por tonelada de CO2e. O setor com maior margem de redução de emissões é o de agricultura, florestas e uso da terra – que também é o setor que mais emite gases causadores do efeito estufa no Brasil. As medidas mais caras são as de mudança em infraestrutura urbana, como melhorias no sistema de transporte.

A taxa de desemprego também cai com os cenários de mitigação adicional – com mais medidas de redução de emissões do que o Plano Nacional de Mudanças Climáticas. A projeção é que, com a adoção de medidas mais ousadas do que as previstas, a taxa varie entre 3,5% e 4,08%, enquanto a taxa de acordo com o cenário projetado pelo governo deve ser de 4,35%.

“A nossa projeção considera que o governo vai reduzir o custo Brasil, aumentar a nossa produtividade, investir em educação e inclusão social”, ressaltou William Wills, coordenador de modelagem do IES Brasil. “Se o governo brasileiro fizer o que tem que ser feito, não são políticas mais ambiciosas de redução de emissões que vão reduzir o potencial de crescimento”, disse. Ele apresentou os dados nesta terça-feira, durante audiência pública na Comissão Mista de Mudança Climática do Congresso.

grafico-ies-brasil


Os cenários de mitigação adicional preveem investimentos que variam entre R$ 164 bilhões, com adoção de medidas de baixo custo, e R$ 524 bilhões, contemplando medidas de maior custo, de 2015 e 2030. Em 2030, o valor investido poderia variar entre R$ 20,7 bilhões e R$ 82,9 bilhões – de 0,37% a 1,46% do PIB previsto para aquele ano.

Aumento de renda e poder de compra

O estudo também projeta um aumento de renda e poder de compra em todas as classes sociais. De acordo com o estudo, alguns setores produtivos em uma economia de baixo carbono – com menos emissões – empregam mais que os setores que emitem gases de efeito estufa. O relatório do IES Brasil destaca a oportunidade de geração de empregos no setor energético, em especial na produção de biomassa e biocombustíveis.

Se as negociações climáticas internacionais adotarem a taxação de carbono como medida de mitigação, a economia brasileira também pode ser beneficiada, de acordo com o estudo. Apesar de uma leve queda na projeção do PIB, a taxa de desemprego pode ser menor. Além disso, a imposição de uma taxa de carbono global pode beneficiar a indústria brasileira, que utiliza fontes mais limpas de energia, aumentando a competitividade no mercado.

Os técnicos responsáveis pelo relatório sugerem alocar a receita da taxa imposta aos setores que emitem mais gases de efeito estufa na desoneração da folha de pagamento dos que emitem menos, estimulando a criação de empregos. “É possível crescer economicamente, reduzir desigualdades e reduzir emissões, em todos os cenários estudados”, concluiu Wills. (Observatório do Clima/ #Envolverde)

* Publicado originalmente no site Observatório do Clima.

Emissões nacionais sobem 7,8% em 2013 (Folha de S.Paulo)

JC, 5070, 24 de novembro de 2014

Salto na poluição ameaça meta brasileira para combater aquecimento global; governo inocenta o desmatamento

Má notícia para o governo Dilma Rousseff, pior para o planeta: a contribuição do país para o aquecimento global avançou 7,8% em 2013. O dado indica reversão da tendência de queda após 2005.

Veja o texto na íntegra em:  http://www1.folha.uol.com.br/fsp/cienciasaude/196408-emissoes-nacionais-sobem-78-em-2013.shtml

(Marcelo Leite/Folha de S.Paulo)

Animação da Nasa mostra rotas do CO2 ao redor do planeta (BBC)

VIDEO

Uma nova animação divulgada pela Nasa mostra como os gases de efeito estufa se comportam ao longo de um ano.

O modelo evidencia que a concentração do gás carbônico ocorre na América do Norte, Europa e norte da Ásia.

Cerca de metade do dióxido de carbono emitido pela queima de combustíveis fósseis permanece na atmosfera; a outra metade é absorvida por plantas e pelos oceanos.

A animação permite ver ainda que os gases não ficam parados, mas se dispersam seguindo padrões climáticos.

A presença dos gases diminui na primavera e no verão do hemisfério norte, quando as plantas absorvem gás carbônico no processo de fotossíntese.

O vídeo usa imagens de 2006. Segundo a agência espacial americana, as concentrações de gás carbônico na atmosfera aumentam ano a ano – o que contribui para o aumento das temperaturas globais.

Coal Rush in India Could Tip Balance on Climate Change (N.Y.Times)

A mine in Jharkhand State. India’s coal rush could push the world past the brink of irreversible climate change, scientists say. CreditKuni Takahashi for The New York Times 

DHANBAD, India — Decades of strip mining have left this town in the heart of India’s coal fields a fiery moonscape, with mountains of black slag, sulfurous air and sickened residents.

But rather than reclaim these hills or rethink their exploitation, the government is digging deeper in a coal rush that could push the world into irreversible climate change and make India’s cities, already among the world’s most polluted, even more unlivable, scientists say.

“If India goes deeper and deeper into coal, we’re all doomed,” said Veerabhadran Ramanathan, director of the Center for Atmospheric Sciences at the Scripps Institution of Oceanography and one of the world’s top climate scientists. “And no place will suffer more than India.”

India’s coal mining plans may represent the biggest obstacle to a global climate pact to be negotiated at a conference in Paris next year. While the United States and China announced a landmark agreement that includes new targets for carbon emissions, and Europe has pledged to reduce greenhouse gas emissions by 40 percent, India, the world’s third-largest emitter, has shown no appetite for such a pledge.

“India’s development imperatives cannot be sacrificed at the altar of potential climate changes many years in the future,” India’s power minister, Piyush Goyal, said at a recent conference in New Delhi in response to a question. “The West will have to recognize we have the needs of the poor.”

Mr. Goyal has promised to double India’s use of domestic coal from 565 million tons last year to more than a billion tons by 2019, and he is trying to sell coal-mining licenses as swiftly as possible after years of delay. The government has signaled that it may denationalize commercial coal mining to accelerate extraction.

“India is the biggest challenge in global climate negotiations, not China,” said Durwood Zaelke, president of the Institute for Governance & Sustainable Development.

Prime Minister Narendra Modi has also vowed to build a vast array of solar power stations, and projects are already springing up in India’s sun-scorched west.

But India’s coal rush could push the world past the brink of irreversible climate change, with India among the worst affected, scientists say.

Indian cities are already the world’s most polluted, with Delhi’s air almost three times more toxic than Beijing’s by one crucial measure. An estimated 37 million Indians could be displaced by rising seas by 2050, far more than in any other country. India’s megacities are among the world’s hottest, with springtime temperatures in Delhi reaching 120 degrees. Traffic, which will only increase with new mining activity, is already the world’s most deadly. And half of Indians are farmers who rely on water from melting Himalayan glaciers and an increasingly fitful monsoons.

India’s coal is mostly of poor quality with a high ash content that makes it roughly twice as polluting as coal from the West. And while China gets 90 percent of its coal from underground mines, 90 percent of India’s coal is from strip mines, which are far more environmentally costly. In a country three times more densely populated than China, India’s mines and power plants directly affect millions of residents. Mercury poisoning has cursed generations of villagers in places like Bagesati, in Uttar Pradesh, with contorted bodies, decaying teeth and mental disorders.

The city of Dhanbad resembles a postapocalyptic movie set, with villages surrounded by barren slag heaps half-obscured by acrid smoke spewing from a century-old fire slowly burning through buried coal seams. Mining and fire cause subsidence that swallows homes, with inhabitants’ bodies sometimes never found.

Suffering widespread respiratory and skin disorders, residents accuse the government of allowing fires to burn and allowing pollution to poison them as a way of pushing people off land needed for India’s coal rush.

“The government wants more coal, but they are throwing their own people away to get it,” said Ashok Agarwal of the Save Jharia Coal Field Committee, a citizens’ group.

T. K. Lahiry, chairman of Bharat Coking Coal, a government-owned company that controls much of the Jharia region, denied neglecting fires and pollution but readily agreed that tens of thousands of residents must be displaced for India to realize its coal needs. Evictions are done too slowly, he said.

 Hauling coal by bicycle in Jharkhand in eastern India. The country plans to double its use of domestic coal by 2019 as part of efforts to reduce poverty. CreditKuni Takahashi for The New York Times 

“We need to shift these people to corporate villages far from the coal fields,” Mr. Lahiry said during an interview in his large office.

With land scarce, Bharat Coking is digging deeper at mines it already controls. On a tour of one huge strip mine, officials said they had recently purchased two mammoth Russian mining shovels to more than triple annual production to 10 million tons. The shovels are clawing coal from a 420-foot-deep pit, with huge trucks piling slag in flat-topped mountains. The deeper the mine goes, the more polluting the coal produced.

India has the world’s fifth-largest reserves of coal but little domestic oil or natural gas production. The country went on a coal-fired power plant building spree over the last five years, increasing capacity by 73 percent. But coal mining grew just 6 percent, leading to expensive coal imports, idle plants and widespread blackouts. Nearly 300 million Indians do not have access to electricity, and millions more get it only sporadically.

“India is going to use coal because that’s what it has,” said Chandra Bhushan, deputy director of the Delhi-based Center for Science and Environment, a prominent environmental group. “Its strategy is ‘all of the above,’ just like in the U.S.”

Each Indian consumes on average 7 percent of the energy used by an American, and Indian officials dismiss critics from wealthy countries.

“I don’t want to use the word ‘pontificate’ when talking about these people, but it would be reasonable to expect more fairness in the discussion and a recognition of India’s need to reach the development of the West,” Mr. Goyal said with a tight smile.

One reason for the widespread domestic support for India’s coal rush is the lack of awareness of just how bad the air has already become, scientists say. Smog levels that would lead to highway shutdowns and near-panic in Beijing go largely unnoticed in Delhi. Pediatric respiratory clinics are overrun, but parents largely shrug when asked about the cause of their children’s suffering. Face masks and air purifiers, ubiquitous among China’s elite, are rare here. And there are signs Indian air is rapidly worsening.

“People need to wake up to just how awful the air already is,” said Rajendra K. Pachauri, chairman of the Intergovernmental Panel on Climate Change, the world’s leading intergovernmental organization for the assessment of climate change.

India’s great hope to save both itself and the world from possible environmental dystopia can be found in the scrub grass outside the village of Neemuch, in India’s western state of Madhya Pradesh. Welspun Energy has constructed what for the moment is Asia’s largest solar plant, a $148 million silent farm of photovoltaic panels on 800 acres of barren soil.

Welspun harvests some of the most focused solar radiation in the world. Dust is so intense that workers must wash each panel every two weeks.

Under Mr. Modi, India is expected to soon underwrite a vast solar building program, and Welspun alone has plans to produce within two years more than 10 times the renewable energy it gets from its facility in Neemuch.

The benefits of solar and the environmental costs of coal are so profound that India has no other choice but to rely more on renewables, said Dr. Pachauri.

“India cannot go down China’s pathway, because the consequences for the public welfare are too horrendous,” he said.

Manipulação do clima pode causar efeitos indesejados (N.Y.Times/FSP)

Ilvy Njiokiktjien/The New York Times
Olivine, a green-tinted mineral said to remove carbon dioxide from the atmosphere, in the hands of retired geochemist Olaf Schuiling in Maasland, Netherlands, Oct. 9, 2014. Once considered the stuff of wild-eyed fantasies, such ideas for countering climate change — known as geoengineering solutions — are now being discussed seriously by scientists. (Ilvy Njiokiktjien/The New York Times)
Olivina, um mineral esverdeado que ajudaria remover o dióxido de carbono da atmosfera

HENRY FOUNTAIN
DO “NEW YORK TIMES”

18/11/2014 02h01

Para Olaf Schuiling, a solução para o aquecimento global está sob nossos pés.

Schuiling, geoquímico aposentado, acredita que a salvação climática está na olivina, mineral de tonalidade verde abundante no mundo inteiro. Quando exposta aos elementos, ela extrai lentamente o gás carbônico da atmosfera.

A olivina faz isso naturalmente há bilhões de anos, mas Schuiling quer acelerar o processo espalhando-a em campos e praias e usando-a em diques, trilhas e até playgrounds. Basta polvilhar a quantidade certa de rocha moída, diz ele, e ela acabará removendo gás carbônico suficiente para retardar a elevação das temperaturas globais.

“Vamos deixar a Terra nos ajudar a salvá-la”, disse Schuiling, 82, em seu gabinete na Universidade de Utrecht.
Ideias para combater as mudanças climáticas, como essas propostas de geoengenharia, já foram consideradas meramente fantasiosas.

Todavia, os efeitos das mudanças climáticas podem se tornar tão graves que talvez tais soluções passem a ser consideradas seriamente.

A ideia de Schuiling é uma das várias que visam reduzir os níveis de gás carbônico, o principal gás responsável pelo efeito estufa, de forma que a atmosfera retenha menos calor.

Outras abordagens, potencialmente mais rápidas e viáveis, porém mais arriscadas, criariam o equivalente a um guarda-sol ao redor do planeta, dispersando gotículas reflexivas na estratosfera ou borrifando água do mar para formar mais nuvens acima dos oceanos. A menor incidência de luz solar na superfície da Terra reduziria a retenção de calor, resultando em uma rápida queda das temperaturas.

Ninguém tem certeza de que alguma técnica de geoengenharia funcionaria, e muitas abordagens nesse campo parecem pouco práticas. A abordagem de Schuiling, por exemplo, levaria décadas para ter sequer um pequeno impacto, e os próprios processos de mineração, moagem e transporte dos bilhões de toneladas de olivina necessários produziriam enormes emissões de carbono.

Jasper Juinen/The New York Times
Kids play on a playground made with Olivine, a material said to remove carbon dioxide from the atmosphere, in Arnhem, Netherlands, Oct. 9, 2014. Once considered the stuff of wild-eyed fantasies, such ideas for countering climate change — known as geoengineering solutions — are now being discussed seriously by scientists. (Jasper Juinen/The New York Times)
Crianças brincam em playground na Holanda revestido com olivina; minério esverdeado retira lentamento o gás carbônico presente na atmosfera

Muitas pessoas consideram a ideia da geoengenharia um recurso desesperado em relação à mudança climática, o qual desviaria a atenção mundial da meta de eliminar as emissões que estão na raiz do problema.

O clima é um sistema altamente complexo, portanto, manipular temperaturas também pode ter consequências, como mudanças na precipitação pluviométrica, tanto catastróficas como benéficas para uma região à custa de outra. Críticos também apontam que a geoengenharia poderia ser usada unilateralmente por um país, criando outra fonte de tensões geopolíticas.

Especialistas, porém, argumentam que a situação atual está se tornando calamitosa. “Em breve poderá nos restar apenas a opção entre geoengenharia e sofrimento”, opinou Andy Parker, do Instituto de Estudos Avançados sobre Sustentabilidade, em Potsdam, Alemanha.

Em 1991, uma erupção vulcânica nas Filipinas expeliu a maior nuvem de gás anidrido sulforoso já registrada na alta atmosfera. O gás formou gotículas de ácido sulfúrico, que refletiam os raios solares de volta para o Espaço. Durante três anos, a média das temperaturas globais teve uma queda de cerca de 0,5 grau Celsius. Uma técnica de geoengenharia imitaria essa ação borrifando gotículas de ácido sulfúrico na estratosfera.

David Keith, pesquisador na Universidade Harvard, disse que essa técnica de geoengenharia, chamada de gestão da radiação solar (SRM na sigla em inglês), só deve ser utilizada lenta e cuidadosamente, para que possa ser interrompida caso prejudique padrões climáticos ou gere outros problemas.

Certos críticos da geoengenharia duvidam que qualquer impacto possa ser equilibrado. Pessoas em países subdesenvolvidos são afetadas por mudanças climáticas em grande parte causadas pelas ações de países industrializados. Então, por que elas confiariam que espalhar gotículas no céu as ajudaria?

“Ninguém gosta de ser o rato no laboratório alheio”, disse Pablo Suarez, do Centro do Clima da Cruz Vermelha/Crescente Vermelho.

Ideias para retirar gás carbônico do ar causam menos alarme. Embora tenham questões espinhosas –a olivina, por exemplo, contém pequenas quantidades de metais que poderiam contaminar o meio ambiente–,elas funcionariam de maneira bem mais lenta e indireta, afetando o clima ao longo de décadas ao alterar a atmosfera.

Como o doutor Schuiling divulga há anos sua ideia na Holanda, o país se tornou adepto da olivina. Estando ciente disso, qualquer um pode notar a presença da rocha moída em trilhas, jardins e áreas lúdicas.

Eddy Wijnker, ex-engenheiro acústico, criou a empresa greenSand na pequena cidade de Maasland. Ela vende areia de olivina para uso doméstico ou comercial. A empresa também vende “certificados de areia verde” que financiam a colocação da areia ao longo de rodovias.

A obstinação de Schuiling também incitou pesquisas. No Instituto Real de Pesquisa Marítima da Holanda em Yerseke, o ecologista Francesc Montserrat está pesquisando a possibilidade de espalhar olivina no leito do mar. Na Bélgica, pesquisadores na Universidade de Antuérpia estudam os efeitos da olivina em culturas agrícolas como cevada e trigo.

Boa parte dos profissionais de geoengenharia aponta a necessidade de haver mais pesquisas e o fato de as simulações em computador serem limitadas.

Poucas verbas no mundo são destinadas a pesquisas de geoengenharia. No entanto, até a sugestão de realizar experimentos em campo pode causar clamor popular. “As pessoas gostam de linhas bem demarcadas, e uma bem óbvia é que não há problema em testar coisas em um computador ou em uma bancada de laboratório”, comentou Matthew Watson, da Universidade de Bristol, no Reino Unido. “Mas elas reagem mal assim que você começa a entrar no mundo real.”

Watson conhece bem essas delimitações. Ele liderou um projeto financiado pelo governo britânico, que incluía um teste relativamente inócuo de uma tecnologia. Em 2011, os pesquisadores pretendiam soltar um balão a cerca de um quilômetro de altitude e tentar bombear um pouco de água por uma mangueira até ele. A proposta desencadeou protestos no Reino Unido, foi adiada por meio ano e, finalmente, cancelada.

Hoje há poucas perspectivas de apoio governamental a qualquer tipo de teste de geoengenharia nos EUA, onde muitos políticos negam sequer que as mudanças climáticas sejam uma realidade.

“O senso comum é que a direita não quer falar sobre isso porque reconhece o problema”, disse Rafe Pomerance, que trabalhou com questões ambientais no Departamento de Estado. “E a esquerda está preocupada com o impacto das emissões.”

Portanto, seria bom discutir o assunto abertamente, afirmou Pomerance. “Isso ainda vai levar algum tempo, mas é inevitável”, acrescentou.

A bolha global de carbono (Eco21)

06/11/2014 – 12h25

por Ricardo Abramovay*

carbono1 A bolha global de carbonoOs combustíveis fósseis são fortes candidatos a ocupar o epicentro de uma nova crise financeira global. A avaliação do jornalista Ambrose Evans-Pritchard está baseada em uma série de entrevistas com influentes protagonistas do setor de energia e em dois relatórios recentes sobre os impactos das negociações climáticas sobre estes mercados. Tendo em vista que, do trilhão de reais que, segundo o BNDES, devem ser investidos em infraestrutura no Brasil até 2017, quase metade vai para o setor de óleo e gás, o tema é de interesse estratégico para o País.

O primeiro relatório é o da Carbon Track Initiative, um grupo de trabalho dirigido pelo empresário, pesquisador e ativista Jeremy Leggett e que ganhou imenso prestígio internacional mostrando a existência de uma bolha de carbono (carbon bubble) no mercado global de energia. A expressão tem um duplo sentido, físico e financeiro. A bolha física está relacionada, evidentemente, à mudança climática. Para cumprir o objetivo de limitar a elevação da temperatura global média a, no máximo, 2°C, até o final do Século 21, a quantidade de fósseis a ser queimada pelo sistema econômico não pode ultrapassar o que corresponde à emissão de algo entre 900 e 1.000 gigatoneladas de Gases de Efeito Estufa entre 2010 e 2050. Ocorre que o patrimônio fóssil em mãos das empresas (em petróleo, carvão e gás) é quase três vezes superior a esse limite.

É nesse sentido que há uma bolha de carbono: este patrimônio só se converterá em riqueza se destruir o sistema climático. Em tese, seria possível capturar e armazenar o carbono lançado na atmosfera: mas, até hoje, os custos dessas operações são exorbitantes e não há indicações de que estejam prestes a se tornar economicamente viáveis. Portanto, não há terceiro caminho: ou se deixa sob o solo dois terços das reservas fósseis em poder dos gigantes da energia ou a elevação da temperatura global média chegará a um patamar em que consequências como a seca atual na Califórnia e os furacões Katrina e Sandy são apenas pálidas expressões.

É aí que ganha importância a dimensão financeira da bolha de carbono: apesar das evidências crescentes reunidas pelos cientistas e do acordo internacional (aprovado em 2010, em Cancún, México) de manter a elevação da temperatura aquém de 2°C, grandes empresas e seus financiadores continuam enxergando nos fósseis uma extraordinária fonte potencial de ganhos.

A Agência Internacional de Energia mostra que, globalmente, os investimentos em combustíveis fósseis dobraram entre 2000 e 2008, quando se estabilizaram em um patamar de US$ 950 bilhões por ano. Isso representa, segundo recente relatório da organização Ceres, 3,3 vezes mais do que os investimentos em renováveis realizados em 2012. Nos últimos seis anos, os gastos globais na busca de fósseis foram de US$ 5,4 trilhões. Praticamente todo esse investimento é feito em fontes não convencionais: areias betuminosas (sobretudo no Canadá), exploração no Ártico, gás de xisto e busca em águas profundas no Brasil e no Golfo do México. Essas fontes não convencionais exigem um esforço (e, portanto, têm um custo) muito maior que as convencionais. Elas só se viabilizam se o preço global do petróleo superar um patamar em torno de US$ 75 o barril.

Mas, se houver um acordo internacional para impedir a ruptura do sistema climático, a consequência será a queda na demanda e, portanto, nos preços dos fósseis. O crescimento exponencial das energias renováveis (a China dobrou sua geração solar nos primeiros seis meses de 2014, relativamente ao mesmo período do ano anterior) também deve resultar em menor demanda por fósseis. Portanto, o risco financeiro em torno dessa corrida à produção de fósseis é imenso.

O segundo relatório citado por Ambrose Evans-Pritchard e no qual se apoia a hipótese de crise financeira global, vem da consultoria Kepler Cheuvreux. Ele calcula as perdas financeiras dos gigantes da energia, caso um acordo para preservar o sistema climático seja alcançado. Nos próximos 20 anos, o prejuízo seria de US$ 28 trilhões, dos quais US$ 19,3 trilhões no setor de petróleo.

Os segmentos mais suscetíveis são justamente os não convencionais: Ártico, areias betuminosas e águas profundas. De que maneira esses números se relacionam com nosso pré-sal é um tema cuja discussão não pode ficar apenas entre especialistas.

* Ricardo Abramovay é professor Titular do Departamento de Economia da FEA/USP.

** Publicado originalmente no site Eco21.

(Eco21)

World falls behind in efforts to tackle climate change: PwC (Reuters)

LONDON Sun Sep 7, 2014 6:24pm EDT

(Reuters) – The world’s major economies are falling further behind every year in terms of meeting the rate of carbon emission reductions needed to stop global temperatures from rising more than 2 degrees this century, a report published on Monday showed.

The sixth annual Low Carbon Economy Index report from professional services firm PwC looked at the progress of major developed and emerging economies toward reducing their carbon intensity, or emissions per unit of gross domestic product.

“The gap between what we are achieving and what we need to do is growing wider every year,” PwC’s Jonathan Grant said. He said governments were increasingly detached from reality in addressing the 2 degree goal.

“Current pledges really put us on track for 3 degrees. This is a long way from what governments are talking about.”

Almost 200 countries agreed at United Nations climate talks to limit the rise in global temperatures to less than 2 degrees Celsius (3.6 Fahrenheit) above pre-industrial times to limit heat waves, floods, storms and rising seas from climate change. Temperatures have already risen by about 0.85 degrees Celsius.

Carbon intensity will have to be cut by 6.2 percent a year to achieve that goal, the study said. That compares with an annual rate of 1.2 percent from 2012 to 2013.

Grant said that to achieve the 6.2 percent annual cut would ‎require changes of an even greater magnitude than those achieved by recent major shifts in energy production in some countries.

France’s shift to nuclear power in the 1980s delivered a 4 percent cut, Britain’s “dash for gas” in the 1990s resulted in a 3 percent cut and the United States shale gas boom in 2012 led to a 3.5 percent cut.

GLIMMER OF HOPE

PwC said one glimmer of hope was that for the first time in six years emerging economies such as China, India and Mexico had cut their carbon intensity at a faster rate than industrialized countries such as the United States, Japan and the European Union.

As the manufacturing hubs of the world, the seven biggest emerging nations have emissions 1.5-times larger than those of the seven biggest developed economies and the decoupling of economic growth from carbon emissions in those nations is seen as vital.

Australia had the highest rate of decarbonization for the second year in a row, cutting its carbon intensity by 7.2 percent over 2013.

Coal producer Australia has one of the world’s highest rates of emissions per person but its efforts to rein in the heat-trapping discharges have shown signs of stalling since the government in July repealed a tax on emissions.

Britain, Italy and China each achieved a decarbonization rate of 4-5 percent, while five countries increased their carbon intensity: France, the United States, India, Germany and Brazil.

United Nations Secretary General Ban Ki-moon hopes to gather more than 100 world leaders in New York on September 23 to reinvigorate efforts to forge a global climate deal.

(Reporting by Ben Garside. Editing by Jane Merrman)


Clues to trapping carbon dioxide in rock: Calcium carbonate takes multiple, simultaneous roads to different minerals (Science Daily)

Date: September 4, 2014

Source: Pacific Northwest National Laboratory

Summary: Researchers used a powerful microscope that allows them to see the birth of calcium carbonate crystals in real time, giving them a peek at how different calcium carbonate crystals form.


An aragonite crystal — with its characteristic “sheaf of wheat” look — consumed a particle of amorphous calcium carbonate as it formed. Credit: Nielsen et al. 2014/Science

One of the most important molecules on earth, calcium carbonate crystallizes into chalk, shells and minerals the world over. In a study led by the Department of Energy’s Pacific Northwest National Laboratory, researchers used a powerful microscope that allows them to see the birth of crystals in real time, giving them a peek at how different calcium carbonate crystals form, they report in September 5’s issue of Science.

The results might help scientists understand how to lock carbon dioxide out of the atmosphere as well as how to better reconstruct ancient climates.

“Carbonates are most important for what they represent, interactions between biology and Earth,” said lead researcher James De Yoreo, a materials scientist at PNNL.. “For a decade, we’ve been studying the formation pathways of carbonates using high-powered microscopes, but we hadn’t had the tools to watch the crystals form in real time. Now we know the pathways are far more complicated than envisioned in the models established in the twentieth century.”

Earth’s Reserve

Calcium carbonate is the largest reservoir of carbon on the planet. It is found in rocks the world over, shells of both land- and water-dwelling creatures, and pearls, coral, marble and limestone. When carbon resides within calcium carbonate, it is not hanging out in the atmosphere as carbon dioxide, warming the world. Understanding how calcium carbonate turns into various minerals could help scientists control its formation to keep carbon dioxide from getting into the atmosphere.

Calcium carbonate deposits also contain a record of Earth’s history. Researchers reconstructing ancient climates delve into the mineral for a record of temperature and atmospheric composition, environmental conditions and the state of the ocean at the time those minerals formed. A better understanding of its formation pathways will likely provide insights into those events.

To get a handle on mineral formation, researchers at PNNL, the University of California, Berkeley, and Lawrence Berkeley National Laboratory examined the earliest step to becoming a mineral, called nucleation. In nucleation, molecules assemble into a tiny crystal that then grows with great speed. Nucleation has been difficult to study because it happens suddenly and unpredictably, so the scientists needed a microscope that could watch the process in real time.

Come to Order

In the 20th century, researchers established a theory that crystals formed in an orderly fashion. Once the ordered nucleus formed, more molecules added to the crystal, growing the mineral but not changing its structure. Recently, however, scientists have wondered if the process might be more complicated, with other things contributing to mineral formation. For example, in previous experiments they’ve seen forms of calcium carbonate that appear to be dense liquids that could be sources for minerals.

Researchers have also wondered if calcite forms from less stable varieties or directly from calcium and carbonate dissolved in the liquid. Aragonite and vaterite are calcium carbonate minerals with slightly different crystal architectures than calcite and could represent a step in calcite’s formation. The fourth form called amorphous calcium carbonate — or ACC, which could be liquid or solid, might also be a reservoir for sprouting minerals.

To find out, the team created a miniature lab under a transmission electron microscope at the Molecular Foundry, a DOE Office of Science User Facility at LBNL. In this miniature lab, they mixed sodium bicarbonate (used to make club soda) and calcium chloride (similar to table salt) in water. At high enough concentrations, crystals grew. Videos of nucleating and growing crystals recorded what happened [URLs to come].

Morphing Minerals

The videos revealed that mineral growth took many pathways. Some crystals formed through a two-step process. For example, droplet-like particles of ACC formed, then crystals of aragonite or vaterite appeared on the surface of the droplets. As the new crystals formed, they consumed the calcium carbonate within the drop on which they nucleated.

Other crystals formed directly from the solution, appearing by themselves far away from any ACC particles. Multiple forms often nucleated in a single experiment — at least one calcite crystal formed on top of an aragonite crystal while vaterite crystals grew nearby.

What the team didn’t see in and among the many options, however, was calcite forming from ACC even though researchers widely expect it to happen. Whether that means it never does, De Yoreo can’t say for certain. But after looking at hundreds of nucleation events, he said it is a very unlikely event.

“This is the first time we have directly visualized the formation process,” said De Yoreo. “We observed many pathways happening simultaneously. And they happened randomly. We were never able to predict what was going to come up next. In order to control the process, we’d need to introduce some kind of template that can direct which crystal forms and where.”

In future work, De Yoreo and colleagues plan to investigate how living organisms control the nucleation process to build their shells and pearls. Biological organisms keep a store of mineral components in their cells and have evolved ways to make nucleation happen when and where needed. The team is curious to know how they use cellular molecules to achieve this control.

This work was supported by the Department of Energy Office of Science.


Journal Reference:

  1. Michael H. Nielsen, Shaul Aloni, and James J. De Yoreo. In Situ TEM Imaging of CaCO3 Nucleation Reveals Coexistence of Direct and Indirect Pathways.Science, September 5, 2014 DOI: 10.1126/science.1254051

Carne bovina é dez vezes mais custosa ao meio ambiente, diz estudo (G1)

PUBLICADO 28 JULHO 2014

Produção de gado bovino demanda de mais recursos naturais, como terra e água, que outras culturas (Foto: Cristino Martins/O Liberal)

Criação de gado bovino demanda mais recursos naturais que demais culturas.
Estudo foi publicado nesta semana na revista científica ‘PNAS’.

Da EFE

O gado bovino demanda 28 vezes mais terra e 11 vezes mais irrigação que os suínos e as aves, e uma dieta com sua carne é dez vezes mais custosa para o meio ambiente, segundo um estudo publicado esta semana pela revista da Academia Nacional de Ciências dos Estados Unidos, a “PNAS”.

A equipe observou as cinco fontes principais de proteínas na dieta dos americanos: produtos lácteos, carne bovina, carne de aves, carne de suínos e ovos. O propósito era calcular os custos ambientais por unidade nutritiva, isto é uma caloria ou grama de proteína. A composição do índice encontrou dificuldades dada à complexidade e variações na produção dos alimentos derivados de animais.

Por exemplo, o gado pastoreado na metade ocidental dos Estados Unidos emprega enormes superfícies de terra, mas muito menos água de irrigação que em outras regiões, enquanto o gado em currais e alimentado com ração consome principalmente milho, que requer menos terra, mas muito mais água e adubos nitrogenados.

A informação que os pesquisadores usaram como base para seu estudo proveio, majoritariamente, dos bancos de dados do Departamento de Agricultura.

Os insumos agropecuários levados em consideração incluíram o uso da terra, da água de irrigação, das emissões dos gases que contribuem ao aquecimento atmosférico, e do uso de adubos nitrogenados.
Carne ‘cara’

Os cálculos mostraram que o alimento humano de origem animal com o custo ambiental mais elevado é a carne bovina: dez vezes mais alto que todos os outros produtos alimentícios de origem animal, inclusive carne suína e de aves. “O gado requer, na média, 28 vezes mais terra e 11 vezes mais água de irrigação, emite cinco vezes mais gases e consome seis vezes mais nitrogênio que a produção de ovos ou carne de aves”, indica o estudo.

Por seu lado, a produção de carne suína ou de aves, os ovos e os lácteos mostraram custos ambientais similares. Os autores se mostraram surpreendidos pelo custo ambiental da produção de lácteos, considerada em geral menos onerosa para o ambiente.

Se for levado em conta o preço de irrigação e os adubos que se aplicam na produção da ração que alimenta o gado bovino para ordenha assim como a ineficiência relativa das vacas comparadas com outros bovinos, o custo ambiental dos lácteos sobe substancialmente.

A pesquisa foi conduzida por Ron Milo do Instituto Weizmann de Ciência, em Rehovot (Israel), com a colaboração de pesquisadores do Centro Canadense de Pesquisa de Energias Alternativas, do Conselho Europeu de Pesquisa, e Charles Rotschild e Selmo Nissenbaum, do Brasil.

É possível descarbonizar o planeta até 2050 (Instituto Ethos)

24/7/2014 – 12h20

por Jorge Abrahão*

shutterstock 129374378 É possível descarbonizar o planeta até 2050

Relatório mostra como países mais poluidores (o Brasil entre eles) podem baixar drasticamente a concentração de carbono em suas atividades até 2050.

Enquanto nós e o mundo acompanhávamos a Copa do Mundo, um relatório elaborado pelo Instituto do Desenvolvimento Sustentável e Relações Internacionais (Iddri, na sigla em francês) e pela Rede de Soluções do Desenvolvimento Sustentável (SDSN, na sigla em inglês), que conta com a participação do economista Jeffrey Sachs, foi entregue ao secretário-geral da ONU, Ban-Ki Moon.

O documento mostrou pela primeira vez como os 15 países mais poluidores do mundo (o Brasil entre eles) podem baixar drasticamente a concentração de carbono em suas atividades até 2050 e, com isso, contribuir para que a temperatura do planeta não aumente 2 graus centígrados.

O relatório, que ainda não é definitivo, tem o título Pathways to Deep Decarbonization (algo como “Caminhos para Descarbonização Profunda”) e é a primeira iniciativa de cooperação global a traçar soluções para diminuir a emissão de gases de efeito estufa (GEE).

Esse documento é resultado do trabalho de 15 equipes de pesquisadores, representando as 15 nações que mais emitem GEE: África do Sul, Alemanha, Austrália, Brasil, Canadá, China, Coreia do Sul, Estados Unidos, França, Índia, Indonésia, Japão, México, Reino Unido e Rússia.

Estas equipes trabalharam para responder a seguinte pergunta: “O que falta fazer para chegar a 2050 com chance de manter o crescimento da temperatura global em menos de 2oC, sem emitir mais de 1,6 toneladas de carbono, em média, contra as 5,2 toneladas de hoje?”

O Iddri e a SDSN indicaram ainda três pilares sobre os quais a resposta de cada país devia ser trabalhada, pois são as matrizes em que as emissões globais mais têm crescido:

– Aumento da eficiência e da responsabilidade no consumo de energia;

– Descarbonização do setor elétrico, com investimentos em fontes renováveis e nuclear e em tecnologias de sequestro de carbono;

– Desenvolvimento de biocombustíveis, veículos elétricos, células de hidrogênio e outras tecnologias que reduzam as emissões do setor de transportes.

Embora sejam pilares comuns, as respostas dadas pelos países não foram idênticas, pois cada nação possui particularidades específicas e prioridades diferentes.

Os projetos de alguns países

A China, país altamente industrializado e dependente do carvão, optou por desenhar um caminho de modernização do parque fabril, com a implementação de tecnologia de captura e armazenamento de carbono.

A Indonésia, cujas emissões vêm principalmente do desmatamento e das queimadas, propôs uma melhor gestão do uso da terra e o manejo sustentável das florestas. Os pesquisadores indonésios relataram que há grandes áreas degradadas que podem ser recuperadas para atividades econômicas ou para o plantio de culturas para biocombustíveis, reduzindo a pressão sobre a floresta em pé.

Os Estados Unidos, com sua enorme classe média de forte poder aquisitivo, sinalizam com programas de eficiência energética e de padrões mais altos (ou de menor quantidade de poluentes) nos combustíveis.

A África do Sul pretende investir em eficiência energética na indústria, nos veículos elétricos e nos biocombustíveis.

Os relatórios do Brasil, da Alemanha e do México ainda não foram apresentados. Em nosso país, os trabalhos estão sendo coordenados pelo professor Emílio La Rovere, do Coppe/UFRJ. E as atividades têm a participação da SDSN Brasil, lançada em março de 2014, com o apoio de várias organizações, entre as quais o Instituto Ethos.

Conclusões

Os especialistas concluem, entre outras coisas que:

– De todos os setores estudados, os dois que apresentam mais desafios para uma profunda descarbonização são o de transporte de carga e o de processos industriais, que ainda precisam ser aprofundados;

– Essa descarbonização profunda depende, em larga escala, da capacidade de entrega nos próximos anos de novas tecnologias de baixo carbono que ainda estão em desenvolvimento. Algumas tecnologias em áreas-chave, como armazenamento de energia, ainda precisam de desenvolvimento.

Entretanto, a conclusão mais importante é que, sem um compromisso de longo prazo – até 2050 – os países não conseguirão firmar acordos de curto e médio prazos, indispensáveis para que a humanidade chegue ao meio do século sem atingir os 2oC de aumento na temperatura do planeta.

Isso significa limitar as emissões a 1.000 GtCO2e até o final do século, condição para termos dois terços de chance de mantermos o aquecimento global em até 2oC em 2100.

Jorge Abrahão é diretor-presidente do Instituto Ethos.

** Publicado originalmente no site Instituto Ethos.

(Instituto Ethos)

NASA’s Orbiting Carbon Observatory-2 / Aura satellite

NASA’s Orbiting Carbon Observatory-2: Data to lead scientists forward into the past

Date: July 20, 2014

Source: NASA/Jet Propulsion Laboratory

Summary: NASA’s Orbiting Carbon Observatory-2, which launched on July 2, will soon be providing about 100,000 high-quality measurements each day of carbon dioxide concentrations from around the globe. Atmospheric scientists are excited about that. But to understand the processes that control the amount of the greenhouse gas in the atmosphere, they need to know more than just where carbon dioxide is now. They need to know where it has been. It takes more than great data to figure that out.

Scientists will use measurements from the Orbiting Carbon Observatory-2 to track atmospheric carbon dioxide to sources such as these wildfires in Siberia, whose smoke plumes quickly carry the greenhouse gas worldwide. The fires were imaged on May 18 by NASA’s Moderate Resolution Imaging Spectrometer instrument on the Terra satellite. Credit: NASA/LANCE/EOSDIS Rapid Response 

NASA’s Orbiting Carbon Observatory-2, which launched on July 2, will soon be providing about 100,000 high-quality measurements each day of carbon dioxide concentrations from around the globe. Atmospheric scientists are excited about that. But to understand the processes that control the amount of the greenhouse gas in the atmosphere, they need to know more than just where carbon dioxide is now. They need to know where it has been. It takes more than great data to figure that out.

“In a sense, you’re trying to go backward in time and space,” said David Baker, a scientist at Colorado State University in Fort Collins. “You’re reversing the flow of the winds to determine when and where the input of carbon at the Earth’s surface had to be to give you the measurements you see now.”

Harry Potter used a magical time turner to travel to the past. Atmospheric scientists use a type of computer model called a chemical transport model. It combines the atmospheric processes found in a climate model with additional information on important chemical compounds, including their reactions, their sources on Earth’s surface and the processes that remove them from the air, known as sinks.

Baker used the example of a forest fire to explain how a chemical transport model works. “Where the fire is, at that point in time, you get a pulse of carbon dioxide in the atmosphere from the burning carbon in wood. The model’s winds blow it along, and mixing processes dilute it through the atmosphere. It gradually gets mixed into a wider and wider plume that eventually gets blown around the world.”

Some models can be run backward in time — from a point in the plume back to the fire, in other words — to search for the sources of airborne carbon dioxide. The reactions and processes that must be modeled are so complex that researchers often cycle their chemical transport models backward and forward through the same time period dozens of times, adjusting the model as each set of results reveals new clues. “You basically start crawling toward a solution,” Baker said. “You may not be crawling straight toward the best answer, but you course-correct along the way.”

Lesley Ott, a climate modeler at NASA’s Goddard Space Flight Center, Greenbelt, Maryland, noted that simulating carbon dioxide’s atmospheric transport correctly is a prerequisite for improving the way global climate models simulate the carbon cycle and how it will change with our changing climate. “If you get the transport piece right, then you can understand the piece about sources and sinks,” she said. “More and better-quality data from OCO-2 are going to create better characterization of global carbon.”

Baker noted that the volume of data provided by OCO-2 will improve knowledge of carbon processes on a finer scale than is currently possible. “With all that coverage, we’ll be able to resolve what’s going on at the regional scale,” Baker said, referring to areas the size of Texas or France. “That will help us understand better how the forests and oceans take up carbon. There are various competing processes, and right now we’re not sure which ones are most important.”

Ott pointed out that improving the way global climate models represent carbon dioxide provides benefits far beyond the scientific research community. “Trying to figure out what national and international responses to climate change should be is really hard,” she said. “Politicians need answers quickly. Right now we have to trust a very small number of carbon dioxide observations. We’re going to have a lot better coverage because so much more data is coming, and we may be able to see in better detail features of the carbon cycle that were missed before.” Taking those OCO-2 data backward in time may be the next step forward on the road to understanding and adapting to climate change.

To learn more about the OCO-2 mission, visit these websites:

NASA monitors Earth’s vital signs from land, air and space with a fleet of satellites and ambitious airborne and ground-based observation campaigns. NASA develops new ways to observe and study Earth’s interconnected natural systems with long-term data records and computer analysis tools to better see how our planet is changing. The agency shares this unique knowledge with the global community and works with institutions in the United States and around the world that contribute to understanding and protecting our home planet.

For more information about NASA’s Earth science activities in 2014, visit:http://www.nasa.gov/earthrightnow

OCO-2 is managed by NASA’s Jet Propulsion Laboratory, Pasadena, California.

*   *   *

A 10-year endeavor: NASA’s Aura and climate change

Date: July 18, 2014

Source: NASA/Jet Propulsion Laboratory

Summary: Celebrating its 10th anniversary this week, NASA’s Aura satellite and its four onboard instruments measure some of the climate agents in the atmosphere, including greenhouse gases, clouds and dust particles. These global datasets provide clues that help scientists understand how Earth’s climate has varied and how it will continue to change.

NASA’s 10-year-old Aura satellite, which studies Earth’s atmosphere, continues to help scientists understand Earth’s changing climate. Credit: NASA

Nitrogen and oxygen make up nearly 99 percent of Earth’s atmosphere. The remaining one percent comprises gases that — although present in small concentrations — can have a big impact on life on Earth. Trace gases called greenhouse gases warm the surface, making it habitable for humans, plants and animals. But these greenhouse gases, as well as clouds and tiny particles called aerosols in the atmosphere, also play vital roles in Earth’s complex climate system.

Celebrating its 10th anniversary this week, NASA’s Aura satellite and its four onboard instruments measure some of the climate agents in the atmosphere, including greenhouse gases, clouds and dust particles. These global datasets provide clues that help scientists understand how Earth’s climate has varied and how it will continue to change.

Measuring Greenhouse Gases

When the sun shines on Earth, some of the light reaches and warms the surface. The surface then radiates this heat back outward, and greenhouse gases stop some of the heat from escaping to space, keeping the surface warm. Greenhouse gases are necessary to keep Earth at a habitable temperature, but since the Industrial Revolution, greenhouse gases have increased substantially, causing an increase in temperature. Aura provides measurements of greenhouse gases such as ozone and water vapor, helping scientists understand the gases that influence climate.

People, plants and animals live in the lowest layer of the atmosphere, called the troposphere. In this layer, the temperature decreases with altitude, as mountain climbers experience. The temperature starts to increase again at the tropopause, about 8 miles (12.9 kilometers) above the surface at temperate latitudes, like those of the United States and Europe. Closer to the equator, the tropopause is about 11 miles (17.7 kilometers) from the surface.

In the middle and upper troposphere, ozone acts as a greenhouse gas, trapping heat in Earth’s atmosphere. Tropospheric ozone is one of the most important human-influenced greenhouse gases.

Aura’s Tropospheric Emission Spectrometer (TES) instrument, built and managed by NASA’s Jet Propulsion Laboratory, Pasadena, California, delivers global maps showing annual averages of the heat absorbed by ozone, in particular in the mid troposphere. Using these maps and computer models, researchers learned that ozone trapped different amounts of heat in Earth’s atmosphere depending on its geographic location. For instance, ozone appeared to be a more effective greenhouse gas over hotter regions like the tropics and cloud-free regions like the Middle East.

“If you want to understand climate change, you need to monitor the greenhouse gases and how they change over time,” said Bryan Duncan, an atmospheric scientist at NASA’s Goddard Space Flight Center in Greenbelt, Maryland.

Along with ozone, Aura measures other important greenhouse gases such as methane, carbon dioxide and water vapor.

Improving Climate Models

In addition to greenhouse gases, Aura measures several other constituents relevant to climate — smoke, dust and clouds including the ice particles within the clouds — that are important for testing and improving climate models.

“If you don’t have any data, then you don’t know if the models are right or not,” said Anne Douglass, Aura project scientist at Goddard. “The models can only be as good as your knowledge.”

The way clouds affect Earth’s climate depends on their altitude and latitude. Two of Aura’s instruments have provided information about tropical clouds. Like greenhouse gases, high, thin clouds in the tropics absorb some of Earth’s outgoing heat and warm the surface. Aura’s High Resolution Dynamics Limb Sounder (HIRDLS) instrument provided global maps showing cirrus clouds in the upper altitudes in the tropics. Researchers have used these data along with data records from previous satellites going back to 1985 to show that the tropical cirrus cloud distribution has been steady, giving scientists information about the interplay among water vapor, ice and the life cycle of these clouds.

Aura’s Microwave Limb Sounder (MLS) instrument, also built and managed by JPL, made the first global measurements of cloud ice content in the upper troposphere, providing new data input for climate models. MLS showed cloud ice is often present over warm oceans. Along with satellite rainfall data, MLS shows that dirty, polluted clouds rain less than clean clouds. The novel relationships obtained from HIRDLS and MLS connect ocean temperatures with clouds and ice and quantify effects of pollution on tropical rainfall — which are important assessments for climate models.

Aerosols influence climate, but their influence is challenging to decipher because they play several different roles. Aerosols reflect radiation from the sun back into space; this tends to cool Earth’s surface. Aerosols such as dust and smoke also absorb radiation and heat the atmosphere where they are concentrated. Aura’s Ozone Monitoring Instrument (OMI) is especially good at observing these absorbing aerosols above clouds and bright deserts. Both OMI and TES also provide data on gases, such as sulfur dioxide and ammonia, which are primary ingredients for other types of less-absorbing aerosols. Aura data, in conjunction with other satellite data, are helping scientists understand how aerosols interact with incoming sunlight in Earth’s atmosphere; this, in turn, helps scientists improve long-term predictions in climate models.

Learning from Long Data Sets

Researchers investigated how natural phenomena such as El Niño affect tropospheric ozone concentrations — a study made possible by Aura’s extensive data set.

El Niño is an irregularly occurring phenomenon associated with warm ocean currents near the Pacific coast of South America that changes the pattern of tropical rainfall. The occasional appearance of areas of warmer temperatures in the Pacific Ocean shifts the stormiest area from the west to the east; the region of upward motion — a hallmark of low ozone concentrations over the ocean — moves along with it.

Without a decade-long data record, researchers would not be able to conduct such a study. Using the extensive data set, researchers are able to separate the response of ozone concentrations to the changes in human activity, such as biomass burning, from its response to natural forcing such as El Niño.

“Studies like these that investigate how the composition of the troposphere responds to a natural variation are important for understanding how the Earth system will respond to other forcing, potentially including changes in climate,” said Douglass. “The Earth system is complex, and Aura’s breadth and the length of the composition data record help us to understand this important part of the system.”

For more information on Aura, visit: http://aura.gsfc.nasa.gov/

For more on TES, visit: http://tes.jpl.nasa.gov/

For more on MLS, visit: http://mls.jpl.nasa.gov/index-eos-mls.php

NASA monitors Earth’s vital signs from land, air and space with a fleet of satellites and ambitious airborne and ground-based observation campaigns. NASA develops new ways to observe and study Earth’s interconnected natural systems with long-term data records and computer analysis tools to better see how our planet is changing. The agency shares this unique knowledge with the global community and works with institutions in the United States and around the world that contribute to understanding and protecting our home planet.

For more information about NASA’s Earth science activities in 2014, visit:http://www.nasa.gov/earthrightnow

*   *   *

Ten-year endeavor: NASA’s Aura tracks pollutants

Date: July 18, 2014

Source: NASA/Jet Propulsion Laboratory

Summary: NASA’s Aura satellite, celebrating its 10th anniversary on July 15, has provided vital data about the cause, concentrations and impact of major air pollutants. With instruments providing key measurements of various gases — including two built and managed by NASA’s Jet Propulsion Laboratory: the Tropospheric Emission Spectrometer (TES) and Microwave Limb Sounder (MLS) — Aura gives a comprehensive view of one of the most important parts of Earth — the atmosphere.

The maps show the Antarctic ozone hole on September 16 in 2006 and 2011, the two years with the lowest ozone concentrations ever measured. They were made with data from the Ozone Monitoring Instrument on Aura. Credit: NASA’s Earth Observatory

NASA’s Aura satellite, celebrating its 10th anniversary on July 15, has provided vital data about the cause, concentrations and impact of major air pollutants. With instruments providing key measurements of various gases — including two built and managed by NASA’s Jet Propulsion Laboratory: the Tropospheric Emission Spectrometer (TES) and Microwave Limb Sounder (MLS) — Aura gives a comprehensive view of one of the most important parts of Earth — the atmosphere.

Aura has improved our understanding of ozone, a versatile gas that both benefits and harms the atmosphere, depending on its location. Near the ground, ozone is a pollutant that damages plants and can decrease lung function in humans. Somewhat higher in the atmosphere, ozone affects climate as a greenhouse gas. Aura’s TES instrument provides measurements of ozone and other greenhouse gases.

The majority of ozone, about 90 percent, is even higher — in the stratosphere, 12 to 90 miles above the surface — where it shields us from the sun’s ultraviolet light and makes life possible on Earth. Over the Antarctic, cold temperatures and human-produced chlorine gases destroy ozone each spring. Scientists use Aura’s Microwave Limb Sounder (MLS) instrument to measure ozone and other trace gases in and around the ozone hole every year. In 2006 and 2011, Aura’s instruments revealed two of the largest and deepest ozone holes in the past decade, and also helped scientists understand the different causes of the two large holes.

Shortly after Aura’s launch, the Ozone Monitoring Instrument (OMI) began monitoring levels of another major pollutant — nitrogen dioxide. This brownish gas can lead to respiratory problems and is an ingredient in ground-level ozone pollution. OMI data show that nitrogen dioxide levels in the United States decreased 4 percent per year from 2005 to 2010, a time when stricter policies on power plant and vehicle emissions came into effect. As a result, concentrations of ground-level ozone also decreased. During the same period, global nitrogen dioxide levels increased a little over half a percent per year. China’s level increased about 6 percent per year.

OMI also measures sulfur dioxide, a gas that combines with other chemicals in clouds to produce acid rain or reacts to form sulfate aerosols, which affect health and climate. OMI has identified large concentrations of sulfur dioxide around power plants and volcanoes.

Aura’s decade of work has set the stage for future air quality monitoring instruments. The European Space Agency will be launching the follow-up TROPOspheric Monitoring Instrument, which will continue Aura’s OMI measurements with better ground resolution and precision. NASA plans to launch the Tropospheric Emissions: Monitoring of Pollution (TEMPO) instrument, which will observe ozone, nitrogen dioxide, sulfur dioxide, formaldehyde and aerosols over the United States, Canada and Mexico.

“Pollution is a global issue because it can travel long distances in the wind,” said Anne Douglass, Aura project scientist at NASA’s Goddard Space Flight Center in Greenbelt, Maryland. “By using satellites, we can develop a valuable global inventory of pollutants and understand how air quality may be changing.”

For more on Aura’s 10-year contribution to atmospheric chemistry research, visit:

For more on TES, visit: http://tes.jpl.nasa.gov/

For more on MLS, visit: http://mls.jpl.nasa.gov/index-eos-mls.php

NASA monitors Earth’s vital signs from land, air and space with a fleet of satellites and ambitious airborne and ground-based observation campaigns. NASA develops new ways to observe and study Earth’s interconnected natural systems with long-term data records and computer analysis tools to better see how our planet is changing. The agency shares this unique knowledge with the global community and works with institutions in the United States and around the world that contribute to understanding and protecting our home planet.

For more information about NASA’s Earth science activities in 2014, visit: http://www.nasa.gov/earthrightnow


NASA launches carbon mission to watch Earth breathe (Science Daily)

Date: July 2, 2014

Source: NASA/Jet Propulsion Laboratory

Summary: NASA successfully launched its first spacecraft dedicated to studying atmospheric carbon dioxide on July 1, 2014. OCO-2 soon will begin a minimum two-year mission to locate Earth’s sources of and storage places for atmospheric carbon dioxide, the leading human-produced greenhouse gas responsible for warming our world, and a critical component of the planet’s carbon cycle.

The Orbiting Carbon Observatory-2, NASA’s first mission dedicated to studying carbon dioxide in Earth’s atmosphere, lifts off from Vandenberg Air Force Base, California, at 2:56 a.m. Pacific Time, July 2, 2014. The two-year mission will help scientists unravel key mysteries about carbon dioxide.

Credit: NASA/Bill Ingalls

NASA successfully launched its first spacecraft dedicated to studying atmospheric carbon dioxide at 2:56 a.m. PDT (5:56 a.m. EDT) Tuesday (July 1, 2014).

The Orbiting Carbon Observatory-2 (OCO-2) raced skyward from Vandenberg Air Force Base, California, on a United Launch Alliance Delta II rocket. Approximately 56 minutes after the launch, the observatory separated from the rocket’s second stage into an initial 429-mile (690-kilometer) orbit. The spacecraft then performed a series of activation procedures, established communications with ground controllers and unfurled its twin sets of solar arrays. Initial telemetry shows the spacecraft is in excellent condition.

OCO-2 soon will begin a minimum two-year mission to locate Earth’s sources of and storage places for atmospheric carbon dioxide, the leading human-produced greenhouse gas responsible for warming our world, and a critical component of the planet’s carbon cycle.

“Climate change is the challenge of our generation,” said NASA Administrator Charles Bolden. “With OCO-2 and our existing fleet of satellites, NASA is uniquely qualified to take on the challenge of documenting and understanding these changes, predicting the ramifications, and sharing information about these changes for the benefit of society.”

OCO-2 will take NASA’s studies of carbon dioxide and the global carbon cycle to new heights. The mission will produce the most detailed picture to date of natural sources of carbon dioxide, as well as their “sinks” — places on Earth’s surface where carbon dioxide is removed from the atmosphere. The observatory will study how these sources and sinks are distributed around the globe and how they change over time.

“This challenging mission is both timely and important,” said Michael Freilich, director of the Earth Science Division of NASA’s Science Mission Directorate in Washington. “OCO-2 will produce exquisitely precise measurements of atmospheric carbon dioxide concentrations near Earth’s surface, laying the foundation for informed policy decisions on how to adapt to and reduce future climate change.”

Carbon dioxide sinks are at the heart of a longstanding scientific puzzle that has made it difficult for scientists to accurately predict how carbon dioxide levels will change in the future and how those changing concentrations will affect Earth’s climate.

“Scientists currently don’t know exactly where and how Earth’s oceans and plants have absorbed more than half the carbon dioxide that human activities have emitted into our atmosphere since the beginning of the industrial era,” said David Crisp, OCO-2 science team leader at NASA’s Jet Propulsion Laboratory in Pasadena, California. “Because of this, we cannot predict precisely how these processes will operate in the future as climate changes. For society to better manage carbon dioxide levels in our atmosphere, we need to be able to measure the natural source and sink processes.”

Precise measurements of the concentration of atmospheric carbon dioxide are needed because background levels vary by less than two percent on regional to continental scales. Typical changes can be as small as one-third of one percent. OCO-2 measurements are designed to measure these small changes clearly.

During the next 10 days, the spacecraft will go through a checkout process and then begin three weeks of maneuvers that will place it in its final 438-mile (705-kilometer), near-polar operational orbit at the head of the international Afternoon Constellation, or “A-Train,” of Earth-observing satellites. The A-Train, the first multi-satellite, formation flying “super observatory” to record the health of Earth’s atmosphere and surface environment, collects an unprecedented quantity of nearly simultaneous climate and weather measurements.

OCO-2 science operations will begin about 45 days after launch. Scientists expect to begin archiving calibrated mission data in about six months and plan to release their first initial estimates of atmospheric carbon dioxide concentrations in early 2015.

The observatory will uniformly sample the atmosphere above Earth’s land and waters, collecting more than 100,000 precise individual measurements of carbon dioxide over Earth’s entire sunlit hemisphere every day. Scientists will use these data in computer models to generate maps of carbon dioxide emission and uptake at Earth’s surface on scales comparable in size to the state of Colorado. These regional-scale maps will provide new tools for locating and identifying carbon dioxide sources and sinks.

OCO-2 also will measure a phenomenon called solar-induced fluorescence, an indicator of plant growth and health. As plants photosynthesize and take up carbon dioxide, they fluoresce and give off a tiny amount of light that is invisible to the naked eye. Because more photosynthesis translates into more fluorescence, fluorescence data from OCO-2 will help shed new light on the uptake of carbon dioxide by plants

OCO-2 is a NASA Earth System Science Pathfinder Program mission managed by JPL for NASA’s Science Mission Directorate in Washington. Orbital Sciences Corporation in Dulles, Virginia, built the spacecraft bus and provides mission operations under JPL’s leadership. The science instrument was built by JPL, based on the instrument design co-developed for the original OCO mission by Hamilton Sundstrand in Pomona, California. NASA’s Launch Services Program at NASA’s Kennedy Space Center in Florida is responsible for launch management. JPL is managed for NASA by the California Institute of Technology in Pasadena.

For more information about OCO-2, visit: http://oco.jpl.nasa.gov

OCO-2 is the second of five NASA Earth science missions scheduled to launch into space this year, the most new Earth-observing mission launches in one year in more than a decade. NASA monitors Earth’s vital signs from land, air and space with a fleet of satellites and ambitious airborne and ground-based observation campaigns. NASA develops new ways to observe and study Earth’s interconnected natural systems with long-term data records and computer analysis tools to better see how our planet is changing. The agency shares this unique knowledge with the global community and works with institutions in the United States and around the world that contribute to understanding and protecting our home planet.

For more information about NASA’s Earth science activities in 2014, visit:http://www.nasa.gov/earthrightnow

Follow OCO-2 on Twitter at: https://twitter.com/IamOCO2

Story Source:

The above story is based on materials provided by NASA/Jet Propulsion LaboratoryNote: Materials may be edited for content and length.

Rachel Biderman: Agropecuária está se tornando a principal fonte de emissões brasileiras (Carbono Brasil)

02/7/2014 – 10h03

por Maura Campanili, do IPAM

Rachel Rachel Biderman: Agropecuária está se tornando a principal fonte de emissões brasileiras

A produção agropecuária de baixo carbono é importante para que o Brasil cumpra suas metas de redução de emissões e colabora para que o produtor consiga adequação ambiental, mas pode ser também um caminho para abrir portas e aumentar a competitividade no mercado internacional, principalmente na Europa e nos Estados Unidos.

Uma ferramenta que pode ajudar o produtor brasileiro a acessar esses benefícios é o Greenhouse Gas Protocol (GHG Protocol) Agropecuária, primeiro instrumento voluntário para medir emissões em propriedades rurais, cuja primeira versão foi lançada em primeira mão no Brasil, no final de maio.

O instrumento foi desenvolvido por meio de uma parceria entre o WRI, a Empresa de Pesquisa Agropecuária (Embrapa) e a Universidade Estadual de Campinas (Unicamp), levando em consideração as condições brasileiras. Segundo Rachel Biderman, diretora Executiva do WRI Brasil, “ações desse tipo também ajudam a criar uma cultura de gestão, contribuindo para a solução do problema das mudanças climáticas”.

Em entrevista para a Clima e Floresta, Rachel, que também é professora responsável por módulo de meio ambiente do MBA em Gestão da Sustentabilidade e coordenadora do curso de extensão da Fundação Getúlio Vargas de “Gestão para o Baixo Carbono”, explica porque é importante reduzir as emissões da agricultura no Brasil.

Clima e Floresta – Qual a importância do combate às emissões de gases de efeito estufa na agricultura brasileira?

Rachel Biderman – O Brasil cada vez mais se consolida como grande fonte de alimentos para o mundo. Ao mesmo tempo, estamos entre os maiores emissores de gases de efeito estufa (GEE) do planeta. Considerando a redução das emissões em mudanças do uso da terra, devido à queda dos desmatamentos, a agropecuária está se tornando a principal fonte de emissões brasileiras e já representa 29,7% das emissões brutas brasileiras em CO2e.

Clima e Floresta – Como a agricultura emite GEE?

Biderman – O setor agropecuário gera emissões em função da fermentação entérica dos animais criados; do manejo de dejetos animais; do cultivo de arroz; da queima de resíduos agrícolas e dos solos agrícolas, estas decorrentes da fertilização nitrogenada e de organossolos cultivados. Há também emissões relativas a atividades associadas ao setor, que incluem a conversão de uso do solo – por exemplo, de florestas para pastagens ou de um tipo de lavoura em outro -, e outras relacionadas à produção de energia.

Clima e Floresta – O que é o GHG Protocol Agrícola e como ele pode colaborar para diminuir as emissões?

Biderman – Trata-se de um conjunto de dois instrumentos principais: as Diretrizes e a Ferramenta de Cálculo de Emissões de GEE no setor Agropecuário. Esses instrumentos permitem aos produtores rurais conhecer melhor o perfil das suas emissões de gases de efeito estufa e desenvolver planos de redução mitigando seus impactos sobre o clima. Esses instrumentos permitirão aos produtores rurais contribuir diretamente para o cumprimento dos objetivos do Plano ABC (Agricultura de Baixo Carbono) e para que mecanismos financeiros adequados sejam alocados para essa atividade sustentável.

Clima e Floresta – A quem o GHG Protocol é destinado?

Biderman – Produtores rurais de qualquer porte.

Clima e Floresta – Pequenos agricultores, assentamentos rurais, populações tradicionais podem participar? Como?

Biderman – Os instrumentos se aplicam a qualquer tipo de produção agropecuária. O WRI Brasil organizará projeto para treinar empresas e interessados para o uso dessas ferramentas.

Clima e Floresta – Além da questão das emissões, há outros benefícios na adoção de uma agricultura de baixo carbono?

Biderman – As empresas que adotarem as diretrizes e ferramenta de cálculo do GHG Protocol terão algumas vantagens competitivas. Entre elas podemos citar: Entender riscos operacionais e de reputação; identificar oportunidades de redução de emissões; implantar metas de redução e monitorar a performance; melhorar a reputação e transparência através da divulgação pública de suas emissões de GEE; colher os frutos dos benefícios associados à redução de emissões, como conservação de energia, ampliação de produtividade, melhora na qualidade do solo e da água; preparar-se para regime de quotas e cumprimento legal; antecipar-se para um potencial mercado de carbono.

* Publicado originalmente no site CarbonoBrasil.

(CarbonoBrasil)

A War Without End, With Earth’s Carbon Cycle Held in the Balance (Science Daily)

Feb. 13, 2013 — The greatest battle in Earth’s history has been going on for hundreds of millions of years — it isn’t over yet — and until now no one knew it existed, scientists reported Feb. 13 in the journalNature.

This SAR11 bacterium is infected with a Pelagiphage virus. (Credit: Image courtesy of Oregon State University)

In one corner is SAR11, a bacterium that’s the most abundant organism in the oceans, survives where most other cells would die and plays a major role in the planet’s carbon cycle. It had been theorized that SAR11 was so small and widespread that it must be invulnerable to attack.

In the other corner, and so strange-looking that scientists previously didn’t even recognize what they were, are “Pelagiphages,” viruses now known to infect SAR11 and routinely kill millions of these cells every second. And how this fight turns out is of more than casual interest, because SAR11 has a huge effect on the amount of carbon dioxide that enters the atmosphere, and the overall biology of the oceans.

“There’s a war going on in our oceans, a huge war, and we never even saw it,” said Stephen Giovannoni, a professor of microbiology at Oregon State University. “This is an important piece of the puzzle in how carbon is stored or released in the sea.”

Researchers from OSU, the University of Arizona and other institutions have just outlined the discovery of this ongoing conflict, and its implications for the biology and function of ocean processes. The findings disprove the theory that SAR11 cells are immune to viral predation, researchers said.

“In general, every living cell is vulnerable to viral infection,” said Giovannoni, who first discovered SAR11 in 1990. “What has been so puzzling about SAR11 was its sheer abundance; there was simply so much of it that some scientists believed it must not get attacked by viruses.”

What the new research shows, Giovannoni said, is that SAR11 is competitive, good at scavenging organic carbon, and effective at changing to avoid infection. Because of that, it thrives and persists in abundance even though it’s constantly being killed by the new viruses that have been discovered.

The discovery of the Pelagiphage viral families was made by Yanlin Zhao, Michael Schwalbach and Ben Temperton, OSU postdoctoral researchers working with Giovannoni. They used traditional research methods, growing cells and viruses from nature in a laboratory, instead of sequencing DNA from nature. The new viruses were so unique that computers could not recognize the virus DNA.

“The viruses themselves, of course, appear to be just as abundant as SAR11,” Giovannoni said. “Our colleagues at the University of Arizona demonstrated this with new technologies they developed for measuring viral diversity.”

SAR11 has several unique characteristics, including the smallest known genetic structure of any independent cell. Through sheer numbers, this microbe has a huge role in consuming organic carbon, which it uses to generate energy while producing carbon dioxide and water in the process. SAR11 recycles organic matter, providing the nutrients needed by algae to produce about half of the oxygen that enters Earth’s atmosphere every day.

This carbon cycle ultimately affects all plant and animal life on Earth.

Journal Reference:

  1. Yanlin Zhao, Ben Temperton, J. Cameron Thrash, Michael S. Schwalbach, Kevin L. Vergin, Zachary C. Landry, Mark Ellisman, Tom Deerinck, Matthew B. Sullivan, Stephen J. Giovannoni. Abundant SAR11 viruses in the ocean.Nature, 2013; DOI: 10.1038/nature11921