Arquivo da tag: Incerteza

‘There is no absolute truth’: an infectious disease expert on Covid-19, misinformation and ‘bullshit’ (The Guardian)

theguardian.com

Carl Bergstrom’s two disparate areas of expertise merged as reports of a mysterious respiratory illness emerged in January

‘Just because the trend that you see is consistent with a story that someone’s selling,inferring causality is dangerous.’
‘Just because the trend that you see is consistent with a story that someone’s selling,inferring causality is dangerous.’ Photograph: Matthew Horwood/Alamy Stock Photo

Julia Carrie Wong, Tue 28 Apr 2020 11.00 BST

Carl Bergstrom is uniquely suited to understanding the current moment. A professor of biology at the University of Washington, he has spent his career studying two seemingly disparate topics: emerging infectious diseases and networked misinformation. They merged into one the moment reports of a mysterious respiratory illness emerged from China in January.

The coronavirus touched off both a pandemic and an “infodemic” of hoaxes, conspiracy theories, honest misunderstandings and politicized scientific debates. Bergstrom has jumped into the fray, helping the public and the press navigate the world of epidemiological models, statistical uncertainty and the topic of his forthcoming book: bullshit.

The following interview has been edited for length and clarity.

You’ve been teaching a course and have co-written a book about the concept of bullshit. Explain what you mean by bullshit?

The formal definition that we use is “language, statistical figures, data, graphics and other forms of presentation that are intended to persuade by impressing and overwhelming a reader or listener with a blatant disregard for truth or logical coherence”.

The idea with bullshit is that it’s trying to appear authoritative and definitive in a way that’s not about communicating accurately and informing a reader, but rather by overwhelming them, persuading them, impressing them. If that’s done without any allegiance to truth, or accuracy, that becomes bullshit.

We’re all used to verbal bullshit. We’re all used to campaign promises and weasel words, and we’re pretty good at seeing through that because we’ve had a lot of practice. But as the world has become increasingly quantified and the currency of arguments has become statistics, facts and figures and models and such, we’re increasingly confronted, even in the popular press, with numerical and statistical arguments. And this area’s really ripe for bullshit, because people don’t feel qualified to question information that’s given to them in quantitative form.

Are there bullshit narratives about the coronavirus that you are concerned about right now?

What’s happened with this pandemic that we’re not accustomed to in the epidemiology community is that it’s been really heavily politicized. Even when scientists are very well-intentioned and not trying to support any side of the narrative, when they do work and release a paper it gets picked up by actors with political agendas.

Whether it’s talking about seroprevalence or estimating the chance that this is even going to come to the United States at all each study gets picked up and placed into this little political box and sort of used as a cudgel to beat the other side with.

So even when the material isn’t being produced as bullshit, it’s being picked up and used in the service of that by overstating its claims, by cherry-picking the information that’s out there and so on. And I think that’s kind of the biggest problem that we’re facing.

One example [of intentional bullshit] might be this insistence for a while on graphing the number of cases on a per-capita basis, so that people could say the US response is so much better than the rest of the world because we have a slower rate of growth per capita. That was basically graphical malfeasance or bullshit. When a wildfire starts spreading, you’re interested in how it’s spreading now, not whether it’s spreading in a 100-acre wood or millions of square miles of national forest.

Is there one big lesson that you think that the media should keep in mind as we communicate science to the public? What mistakes are we making?

I think the media has been adjusting really fast and doing really well. When I’m talking about how to avoid misinformation around this I’m constantly telling people to trust the professional fact-based media. Rather than looking for the latest rumor that’s spreading across Facebook or Twitter so that you can have information up to the hour, recognize that it’s much better to have solidly sourced, well-vetted information from yesterday.

Hyper-partisan media are making a huge mess of this, but that’s on purpose. They’ve got a reason to promote hydroxychloroquine or whatever it is and just run with that. They’re not even trying to be responsible.

But one of the biggest things that people [in the media]could do to improve would be to recognize that scientific studies, especially in a fast-moving situation like this, are provisional. That’s the nature of science. Anything can be corrected. There’s no absolute truth there. Each model, each finding is just adding to a weight of evidence in one direction or another.

A lot of the reporting is focusing on models, and most of us probably don’t have any basic training in how to read them or what kind of credence to put in them. What should we know?

The key thing, and this goes for scientists as well as non-scientists, is that people are not doing a very good job thinking about what the purpose of different models are, how the purposes of different models vary, and then what the scope of their value is. When these models get treated as if they’re oracles, then people both over-rely on them and treat them too seriously – and then turn around and slam them too hard for not being perfect at everything.

Are there mistakes that are made by people in the scientific community when it comes to communicating with the public?

We’re trying to communicate as a scientific community in a new way, where people are posting their data in real time. But we weren’t ready for the degree to which that stuff would be picked up and assigned meaning in this highly politically polarized environment. Work that might be fairly easy for researchers to contextualize in the field can be portrayed as something very, very different in the popular press.

The first Imperial College model in March was predicting 1.1 million to 2.2 million American deaths if the pandemic were not controlled. That’s a really scary, dramatic story, and I still think that it’s not unrealistic. That got promoted by one side of the partisan divide. Then Imperial came back and modeled a completely different scenario, where the disease was actually brought under control and suppressed in the US, and they released a subsequent model that said, ‘If we do this, something like 50,000 deaths will occur.’ That was picked up by the other side and used to try to discredit the Imperial College team entirely by saying, ‘A couple of weeks ago they said a million now they’re saying 50,000; they can’t get anything right.’ And the answer , of course, is that they were modeling two different scenarios.

We’re also not doing enough of deliberately stressing the possible weaknesses of our interpretations. That varies enormously from researcher to researcher and team to team.

It requires a lot of discipline to argue really hard for something but also be scrupulously open about all of the weaknesses in your own argument.

But it’s more important than ever, right? A really good paper will lay out all the most persuasive evidence it can and then in the conclusion section or the discussion section say, ‘OK, here are all the reasons that this could be wrong and here are the weaknesses.’

When you have something that’s so directly policy relevant, and there’s a lot of lives at stake, we’re learning how to find the right balance.

It is a bit of a nightmare to put out data that is truthful, but also be aware that there are bad faith actors at the moment who might pounce on it and use it in a way you didn’t intend.

There’s a spectrum. You have outright bad faith actors – Russian propaganda picking up on things and bots spreading misinformation – and then you have someone like Georgia Governor Brian Kemp who I wouldn’t calla bad faith actor. He’s a misinformed actor.

There’s so much that goes unsaid in science in terms of context and what findings mean that we don’t usually write in papers. If someone does a mathematical forecasting model, you’re usually not going to have a half-page discussion on the limitations of forecasting. We’re used to writing for an audience of 50 people in the world, if we’re lucky, who have backgrounds that are very similar to our own and have a huge set of shared assumptions and shared knowledge. And it works really well when you’re writing on something that only 50 people in the world care about and all of them have comparable training, but it is a real mess when it becomes pressing, and I don’t think any of us have figured out exactly what to do about that because we’re also trying to work quickly and it’s important to get this information out.

One area that has already become contentious and in some ways politicized is the serology surveys, which are supposed to show what percentage of the population has antibodies to the virus. What are some of the big picture contextual caveats and limitations that we should keep in mind as these surveys come out?

The seroprevalence in the US is a political issue, and so the first thing is to recognize that when anyone is reporting on that stuff, there’s a political context to it. It may even be that some of the research is being done with an implicitly political context, depending on who the funders are or what the orientations and biases of some of the researchers.

On the scientific side, I think there’s really two things to think about. The first one is the issue of selection bias. You’re trying to draw a conclusion about one population by sampling from a subset of that population and you want to know how close to random your subset is with respect to the thing you’re trying to measure. The Santa Clara study recruited volunteers off of Facebook. The obvious source of sampling bias there is that people desperately want to get tested. The people that want it are, of course, people that think they’ve had it.

The other big piece is understanding the notion of positive predictive value and the way false positive and false negative error rates influence the estimate. And that depends on the incidence of infection in the population.

If you have a test that has a 3% error rate, and the incidence in the population is below 3%, then most of the positives that you get are going to be false positives. And so you’re not going to get a very tight estimate about how many people have it. This has been a real problem with the Santa Clara study. From my read of the paper, their data is actually consistent with nobody being infected. A New York Citystudy on the other hand showed 21% seropositive, so even if there has a 3% error rate, the majority of those positives have to be true positives.

Now that we’ve all had a crash course in models and serosurveys, what are the other areas of science where it makes sense for the public to start getting educated on the terms of the debate?

One that I think will come along sooner or later is interpreting studies of treatments. We’ve dealt with that a little bit with the hydroxychloroquine business but not in any serious way because the hydroxychloroquine work has been pretty weak and the results have not been so positive.

But there are ongoing tests of a large range of existing drugs. And these studies are actually pretty hard to do. There’s a lot of subtle technical issues: what are you doing for controls? Is there a control arm at all? If not, how do you interpret the data? If there is a control arm, how is it structured? How do you control for the characteristics of the population on whom you’re using the drug or their selection biases in terms of who’s getting the drug?

Unfortunately, given what we’ve already seen with hydroxychloroquine, it’s fairly likely that this will be politicized as well. There’ll be a parallel set of issues that are going to come around with vaccination, but that’s more like a year off.

If you had the ability to arm every person with one tool – a statistical tool or scientific concept – to help them understand and contextualize scientific information as we look to the future of this pandemic, what would it be?

I would like people to understand that there are interactions between the models we make, the science we do and the way that we behave. The models that we make influence the decisions that we take individually and as a society, which then feed back into the models and the models often don’t treat that part explicitly.

Once you put a model out there that then creates changes in behavior that pull you out of the domain that the model was trying to model in the first place. We have to be very attuned to that as we try to use the models for guiding policy.

That’s very interesting, and not what I expected you to say.

What did you expect?

That correlation does not imply causation.

That’s another very good one. Seasonality is a great example there. We’re trying a whole bunch of things at the same time. We’re throwing all kinds of possible solutions at this and lots of things are changing. It’s remarkable to me actually, that so many US states are seeing the epidemic curve decrease. And so there’s a bunch of possibilities there. It could be because people’s behavior is changing. There could be some seasonality there. And there are other possible explanations as well.

But what is really important is that just because the trend that you see is consistent with a story that someone’s selling, there may be many other stories that are also consistent, so inferring causality is dangerous.

Com pandemia de covid-19, cartórios registram alta de 43% em mortes por causa indeterminada (Estadão)

saude.estadao.com.br

Fabiana Cambricoli, 27 de abril de 2020

SÃO PAULO – Os cartórios brasileiros registraram alta de 43% no número de mortes por causa indeterminada notificadas no País desde o início da pandemia de covid-19 em território brasileiro. Os dados, antecipados pelo Estado, serão divulgados nesta segunda-feira, 27, em novo painel do Portal da Transparência do Registro Civil, mantido pela Associação Nacional dos Registradores de Pessoas Naturais (Arpen-Brasil). Segundo especialistas, o aumento de óbitos sem causa definida pode estar associado a vítimas de coronavírus que morreram sem ter o diagnóstico da doença.

A alta refere-se ao período de 26 de fevereiro, data em que o primeiro caso de infecção por coronavírus foi registrado no Brasil, até 17 de abril – como os cartórios tem até dez dias para repassar os registros para a Central de Informações do Registro Civil (CRC Nacional), a reportagem optou por um recorte até dez dias atrás.

Em 2020, o País teve 1.329 mortes por causa indeterminada no periodo mencionado. Em 2019, 925 óbitos do tipo foram registrados pelos cartórios no mesmo intervalo. De acordo com especialistas, o dado pode ser mais um indício de subnotificação do número de óbitos por coronavírus no País. Com a falta de testes e a alta demanda sobre o sistema de saúde em algumas regiões, doentes podem estar morrendo sem ter uma avaliação médica.

Para Fátima Marinho, professora da Faculdade de Medicina da Universidade Federal de Minas Gerais (UFMG) e integrante do grupo de especialistas que auxiliou a Arpen-Brasil na elaboração do painel, é provável que o aumento de mortes por causa indefinida tenha como uma das razões a morte de pessoas por covid-19 que não tiveram acesso ao sistema de saúde. “Em uma situação de uma doença nova, uma pandemia, a gente espera um aumento de mortes em casa, sem que a pessoa sequer consiga ter atendimento médico. Isso pode estar acontecendo agora”, explica.

Se analisadas as mortes também por faixa etária, o aumento de óbitos por causa indeterminada é maior entre idosos, principal grupo de risco para complicações do coronavírus. O número de mortes sem causa definida entre pessoas com idade a partir de 60 anos passou de 568 em 2019 para 879 em 2020, alta de 54,8%. Já entre indivíduos com menos de 60 anos, a variação foi de 30,5% – subiu de 321 para 419 no mesmo intervalo de tempo.

Fátima diz que outra razão que pode estar impactando na alta de mortes por causas indeterminadas é o provável crescimento de óbitos por outras causas que não estão chegando aos hospitais pela dificuldade de conseguir leitos no meio da pandemia ou pelo eventual medo de pacientes em procurar unidades de saúde e se contaminarem. “Provavelmente teremos um aumento de mortes por infarto, AVC e outros problemas registrados em casa porque as pessoas estão adiando a ida ao pronto-socorro ou tendo que disputar leitos com pacientes com covid-19”, diz ela.

Salto em mortes por Síndrome Respiratória Aguda Grave

O portal da transparência mantido pela Arpen-Brasil também passa a disponibilizar o número de mortes por Síndrome Respiratória Aguda Grave (SRAG), que registrou aumento de 680% entre 26 de fevereiro e 17 de abril de 2019 e o mesmo período de 2020. Os números contemplam casos dessa condição respiratória em que não foi especificado o agente causador da síndrome, que pode ser coronavírus, mas também influenza ou outro vírus respiratório.

De acordo com o portal, o número de mortes do tipo passou de 156 para 1.217 no período citado. A alta nos óbitos por SRAG não especificada registradas em cartórios seriam outro indício de subnotificação. Ela é ainda maior em Estados com muitos casos da doença. No Amazonas, o aumento foi de 1.214%. No Ceará, de 3.828%. Em São Paulo, Estado com o maior número de infectados, o crescimento observado foi de 916%.

Outros dados anteriormente divulgados pela Arpen-Brasil mostravam indícios de que o número de mortes por coronavírus no Brasil pode ser maior que o computado oficialmente pelo Ministério da Saúde. Como revelou o Estado em 13 de abril, o número de registros de mortes por insuficiência respiratória e pneumonia no Brasil teve um salto em março, contrariando tendência de queda que vinha sendo observada nos meses de janeiro e fevereiro. Foram 2.239 mortes a mais em março de 2020 do que no mesmo período de 2019.

O número de mortes suspeitas ou confirmadas por covid-19 registradas nos cartórios também vem se mostrando maior do que as registradas pelo Ministério da Saúde (que considera só os óbitos confirmados por coronavírus). Na tarde desta segunda, por exemplo, os cartórios já registravam 4.839 vítimas com confirmação ou suspeita da doença. Já o Ministério contabilizava 4.543 registros.

Para Luis Carlos Vendramin Júnior, vice-presidente da Arpen-Brasil, a disponibilização dos dados dos cartórios ajudam a entender o avanço da epidemia. “Como temos esses dados com atualização diária, avaliamos que ampliar a transparência e divulgar dados também sobre mortes por SRAG e causas indeterminadas, além das que já vínhamos divulgando, vai auxiliar tanto o poder público quanto a imprensa e a população em geral na análise de números”, destacou.

We Still Don’t Know How the Coronavirus Is Killing Us (The Intelligencer)

nymag.com

David Wallace-Wells, Apr. 26, 2020

Omar Rodriguez organizes bodies in the Gerard J. Neufeld funeral home in Elmhurst on April 22. Photo: Spencer Platt/Getty Images

Over the last few weeks, the country has managed to stabilize the spread of the coronavirus sufficiently enough to begin debating when and in what ways to “reopen,” and to normalize, against all moral logic, the horrifying and ongoing death toll — thousands of Americans dying each day, in multiples of 9/11 every week now with the virus seemingly “under control.” The death rate is no longer accelerating, but holding steady, which is apparently the point at which an onrushing terror can begin fading into background noise. Meanwhile, the disease itself appears to be shape-shifting before our eyes.

In an acute column published April 13, the New York Times’ Charlie Warzel listed 48 basic questions that remain unanswered about the coronavirus and what must be done to protect ourselves against it, from how deadly it is to how many people caught it and shrugged it off to how long immunity to the disease lasts after infection (if any time at all). “Despite the relentless, heroic work of doctors and scientists around the world,” he wrote, “there’s so much we don’t know.” The 48 questions he listed, he was careful to point out, did not represent a comprehensive list. And those are just the coronavirus’s “known unknowns.”

In the two weeks since, we’ve gotten some clarifying information on at least a handful of Warzel’s queries. In early trials, more patients taking the Trump-hyped hydroxychloroquinine died than those who didn’t, and the FDA has now issued a statement warning coronavirus patients and their doctors from using the drug. The World Health Organization got so worried about the much-touted antiviral remdesivir, which received a jolt of publicity (and stock appreciation) a few weeks ago on rumors of positive results, the organization leaked an unpublished, preliminary survey showing no benefit to COVID-19 patients. Globally, studies have consistently found exposure levels to the virus in most populations in the low single digits — meaning dozens of times more people have gotten the coronavirus than have been diagnosed with it, though still just a tiny fraction of the number needed to achieve herd immunity. In particular hot spots, the exposure has been significantly more widespread — one survey in New York City found that 21 percent of residents may have COVID-19 antibodies already, making the city not just the deadliest community in the deadliest country in a world during the deadliest pandemic since AIDS, but also the most infected (and, by corollary, the farthest along to herd immunity). A study in Chelsea, Massachusetts, found an even higher and therefore more encouraging figure: 32 percent of those tested were found to have antibodies, which would mean, at least in that area, the disease was only a fraction as severe as it might’ve seemed at first glance, and that the community as a whole could be as much as halfway along to herd immunity. In most of the rest of the country, the picture of exposure we now have is much more dire, with much more infection almost inevitably to come.

But there is one big question that didn’t even make it onto Warzel’s list that has only gotten more mysterious in the weeks since: How is COVID-19 actually killing us?

We are now almost six months into this pandemic, which began in November in Wuhan, with 50,000 Americans dead and 200,000 more around the world. If each of those deaths is a data point, together they represent a quite large body of evidence from which to form a clear picture of the pandemic threat. Early in the epidemic, the coronavirus was seen as a variant of a familiar family of disease, not a mysterious ailment, however infectious and concerning. But while uncertainties at the population level confuse and frustrate public-health officials, unsure when and in what form to shift gears out of lockdowns, the disease has proved just as mercurial at the clinical level, with doctors revising their understanding of COVID-19’s basic pattern and weaponry — indeed often revising that understanding in different directions at once. The clinical shape of the disease, long presumed to be a relatively predictable respiratory infection, is getting less clear by the week. Lately, it seems, by the day. As Carl Zimmer, probably the country’s most respected science journalist, asked virologists in a tweet last week, “is there any other virus out there that is this weird in terms of its range of symptoms?”

You probably have a sense of the range of common symptoms, and a sense that the range isn’t that weird: fever, dry cough, and shortness of breath have been, since the beginning of the outbreak, the familiar, oft-repeated group of tell-tale signs. But while the CDC does list fever as the top symptom of COVID-19, so confidently that for weeks patients were turned away from testing sites if they didn’t have an elevated temperature, according to the Journal of the American Medical Association, as many as 70 percent of patients sick enough to be admitted to New York State’s largest hospital system did not have a fever.

Over the past few months, Boston’s Brigham and Women’s Hospital has been compiling and revising, in real time, treatment guidelines for COVID-19 which have become a trusted clearinghouse of best-practices information for doctors throughout the country. According to those guidelines, as few as 44 percent of coronavirus patients presented with a fever (though, in their meta-analysis, the uncertainty is quite high, with a range of 44 to 94 percent). Cough is more common, according to Brigham and Women’s, with between 68 percent and 83 percent of patients presenting with some cough — though that means as many as three in ten sick enough to be hospitalized won’t be coughing. As for shortness of breath, the Brigham and Women’s estimate runs as low as 11 percent. The high end is only 40 percent, which would still mean that more patients hospitalized for COVID-19 do not have shortness of breath than do. At the low end of that range, shortness of breath would be roughly as common among COVID-19 patients as confusion (9 percent), headache (8 to 14 percent), and nausea and diarrhea (3 to 17 percent). That the ranges are so wide themselves tells you that the disease is presenting in very different ways in different hospitals and different populations of different patients — leading, for instance, some doctors and scientists to theorize the virus might be attacking the immune system like HIV does, with many others finding the disease is triggering something like the opposite response, an overwhelming overreaction of the immune system called a “cytokine storm.”

The most bedeviling confusion has arisen around the relationship of the disease to breathing, lung function, and oxygenation levels in the blood — typically, for a respiratory illness, a quite predictable relationship. But for weeks now, front-line doctors have been expressing confusion that so many coronavirus patients were registering lethally low blood-oxygenation levels while still appearing, by almost any vernacular measure, pretty okay. It’s one reason they’ve begun rethinking the initial clinical focus on ventilators, which are generally recommended when patients oxygenation falls below a certain level, but seemed, after a few weeks, of unclear benefit to COVID-19 patients, who may have done better, doctors began to suggest, on lesser or different forms of oxygen support. For a while, ventilators were seen so much as the essential tool in treating life-threatening coronavirus that shortages (and the president’s unwillingness to invoke the Defense Production Act to manufacture them quickly) became a scandal. But by one measure 88 percent of New York patients put on ventilators, for whom an outcome as known, had died. In China, the figure was 86 percent.

On April 20 in the New York Times, an ER doctor named Richard Levitan who had been volunteering at Bellevue proposed that the phenomenon of seemingly stable patients registering lethally low oxygen levels might be explained by “silent hypoxia” — the air sacs in the lung collapsing, not getting stiff or heavy with fluid, as is the case with the pneumonias doctors had been using as models in their treatment of COVID-19. But whether this explanation is universal, limited to the patients at Bellevue, or somewhere in between is not yet entirely clear. A couple of days later, in a pre-print paper others questioned, scientists reported finding that the ability of the disease to mutate has been “vastly underestimated” — investigating the disease as it appeared in just 11 patients, they said they found 30 mutations. “The most aggressive strains could generate 270 times as much viral load as the weakest type,” the South China Morning-Post reported. “These strains also killed the cells the fastest.”

That same day, the Washington Post reported on another theory gaining traction among American doctors treating the disease — that one key could be the way COVID-19 affects the blood of patients, producing much more clotting. “Autopsies have shown that some people’s lungs are filled with hundreds of microclots,” the Post reported. “Errant blood clots of a larger size can break off and travel to the brain or heart, causing a stroke or a heart attack.”

But the bigger-picture perspective the newspaper offered is perhaps more eye-opening and to the point:

One month ago, as the country went into lockdown to prepare for the first wave of coronavirus cases, many doctors felt confident that they knew what they were dealing with. Based on early reports, covid-19 appeared to be a standard variety respiratory virus, albeit a very contagious and lethal one with no vaccine and no treatment. But they’ve since become increasingly convinced that covid-19 attacks not only the lungs, but also the kidneys, heart, intestines, liver and brain.

That is a dizzying list. But it is not even comprehensive. In a fantastic survey published April 17 (“How does coronavirus kill? Clinicians trace a ferocious rampage through the body, from brain to toes,” by Meredith Wadman, Jennifer Couzin-Frankel, Jocelyn Kaiser, and Catherine Matacic), Science magazine took a thorough, detailed tour of the ever-evolving state of understanding of the disease. “Despite the more than 1,000 papers now spilling into journals and onto preprint servers every week,” Science concluded, “a clear picture is elusive, as the virus acts like no pathogen humanity has ever seen.”

In a single illuminating chart, Science lists the following organs as being vulnerable to COVID-19: brain, eyes, nose, lungs, heart, blood vessels, livers, kidneys, intestines. That is to say, nearly every organ:

And the disparate impacts were significant ones: Heart damage was discovered in 20 percent of patients hospitalized in Wuhan, where 44 percent of those in ICU exhibited arrhythmias; 38 percent of Dutch ICU patients had irregular blood clotting; 27 percent of Wuhan patients had kidney failure, with many more showing signs of kidney damage; half of Chinese patients showed signs of liver damage; and, depending on the study, between 20 percent and 50 percent of patients had diarrhea.

On April 15, the Washington Post reported that, in New York and Wuhan, between 14 and 30 percent of ICU patients had lost kidney function, requiring dialysis. New York hospitals were treating so much kidney failure “they need more personnel who can perform dialysis and have issued an urgent call for volunteers from other parts of the country. They also are running dangerously short of the sterile fluids used to deliver that therapy.” The result, the Post said, was rationed care: patients needing 24-hour support getting considerably less. On Saturday, the paper reported that “[y]oung and middle-aged people, barely sick with COVID-19, are dying from strokes.” Many of the patients described didn’t even know they were sick:

The patient’s chart appeared unremarkable at first glance. He took no medications and had no history of chronic conditions. He had been feeling fine, hanging out at home during the lockdown like the rest of the country, when suddenly, he had trouble talking and moving the right side of his body. Imaging showed a large blockage on the left side of his head. Oxley gasped when he got to the patient’s age and covid-19 status: 44, positive.

The man was among several recent stroke patients in their 30s to 40s who were all infected with the coronavirus. The median age for that type of severe stroke is 74.

But the patient’s age wasn’t the only abnormality of the case:

As Oxley, an interventional neurologist, began the procedure to remove the clot, he observed something he had never seen before. On the monitors, the brain typically shows up as a tangle of black squiggles — “like a can of spaghetti,” he said — that provide a map of blood vessels. A clot shows up as a blank spot. As he used a needlelike device to pull out the clot, he saw new clots forming in real-time around it.

“This is crazy,” he remembers telling his boss.

These strokes, several doctors who spoke to the Post theorized, could explain the high number of patients dying at home — four times the usual rate in New York, many or most of them, perhaps, dying quite suddenly. According to the Brigham and Women’s guidelines, only 53 percent of COVID-19 patients have died from respiratory failure alone.

It’s not unheard of, of course, for a disease to express itself in complicated or hard-to-parse ways, attacking or undermining the functioning of a variety of organs. And it’s common, as researchers and doctors scramble to map the shape of a new disease, for their understanding to evolve quite quickly. But the degree to which doctors and scientists are, still, feeling their way, as though blindfolded, toward a true picture of the disease cautions against any sense that things have stabilized, given that our knowledge of the disease hasn’t even stabilized. Perhaps more importantly, it’s a reminder that the coronavirus pandemic is not just a public-health crisis but a scientific one as well. And that as deep as it may feel we are into the coronavirus, with tens of thousands dead and literally billions in precautionary lockdown, we are still in the very early stages, when each new finding seems as likely to cloud or complicate our understanding of the coronavirus as it is to clarify it. Instead, confidence gives way to uncertainty.

In the space of a few months, we’ve gone from thinking there was no “asymptomatic transmission” to believing it accounts for perhaps half or more of all cases, from thinking the young were invulnerable to thinking they were just somewhat less vulnerable, from believing masks were unnecessary to requiring their use at all times outside the house, from panicking about ventilator shortages to deploying pregnancy massage pillows instead. Six months since patient zero, we still have no drugs proven to even help treat the disease. Almost certainly, we are past the “Rare Cancer Seen in 41 Homosexuals” stage of this pandemic. But how far past?

Opinion | When Will Life Be Normal Again? We Just Don’t Know (The New York Times)

nytimes.com

By Charlie Warzel, April 13, 2020

Many Americans have been living under lockdown for a month or more. We’re all getting antsy. The president is talking about a “light at the end of the tunnel.” People are looking for hope and reasons to plan a return to something — anything — approximating normalcy. Experts are starting to speculate on what lifting restrictions will look like. Despite the relentless, heroic work of doctors and scientists around the world, there’s so much we don’t know.

We don’t know how many people have been infected with Covid-19.

We don’t know the full range of symptoms.

We don’t always know why some infections develop into severe disease.

We don’t know the full range of risk factors.

We don’t know exactly how deadly the disease is.

We don’t have answers to more detailed questions about how the virus spreads, including: “How many virus particles does it even take to launch an infection? How far does the virus travel in outdoor spaces, or in indoor settings? Have these airborne movements affected the course of the pandemic?”

We don’t know for sure how this coronavirus first emerged.

We don’t know how much China has concealed the extent of the coronavirus outbreak in that country.

We don’t know what percentage of adults are asymptomatic. Or what percentage of children are asymptomatic.

We don’t know the strength and duration of immunity. Though people who recover from Covid-19 likely have some degree of immunity for some period of time, the specifics are unknown.

We don’t yet know why some who’ve been diagnosed as “fully recovered” from the virus have tested positive a second time after leaving quarantine.

We don’t know why some recovered patients have low levels of antibodies.

We don’t know the long-term health effects of a severe Covid-19 infection. What are the consequences to the lungs of those who survive intensive care?

We don’t yet know if any treatments are truly effective. While there are many therapies in trials, there are no clinically proven therapies aside from supportive care.

We don’t know for certain if the virus was in the United States before the first documented case.

We don’t know when supply chains will strengthen to provide health care workers with enough masks, gowns and face shields to protect them.

In America, we don’t know the full extent to which black people are disproportionately suffering. Fewer than a dozen states have published data on the race and ethnic patterns of Covid-19.

We don’t know if people will continue to adhere to social distancing guidelines once infections go down.

We don’t know when states will be able to test everyone who has symptoms.

We don’t know if the United States could ever deploy the number of tests — as many as 22 million per day — needed to implement mass testing and quarantining.

We don’t know if we can implement “test and trace” contact tracing at scale.

We don’t know whether smartphone location tracking could be implemented without destroying our privacy.

We don’t know if or when researchers will develop a successful vaccine.

We don’t know how many vaccines can be deployed and administered in the first months after a vaccine becomes available.

We don’t know how a vaccine will be administered — who will get it first?

We don’t know if a vaccine will be free or costly.

We don’t know if a vaccine will need to be updated every year.

We don’t know how, when we do open things up again, we will do it.

We don’t know if people will be afraid to gather in crowds.

We don’t know if people will be too eager to gather in crowds.

We don’t know what socially distanced professional sports will look like.

We don’t know what socially distanced workplaces will look like.

We don’t know what socially distanced bars and restaurants will look like.

We don’t know when schools will reopen.

We don’t know what a general election in a pandemic will look like.

We don’t know what effects lost school time will have on children.

We don’t know if the United States’s current and future government stimulus will stave off an economic collapse.

We don’t know whether the economy will bounce back in the form of a “v curve” …

Or whether it’ll be a long recession.

We don’t know when any of this will end for good.

There is, at present, no plan from the Trump White House on the way forward.

We’re working on a project about the ways people’s lives might be permanently altered by the coronavirus, even after the pandemic subsides. In what ways do you think your life will change in the long term? What will be your new “normal”?

Recovered, almost: China’s early patients unable to shed coronavirus (Reuters)

uk.reuters.com

Brenda Goh, April 22, 2020

WUHAN, China (Reuters) – Dressed in a hazmat suit, two masks and a face shield, Du Mingjun knocked on the mahogany door of a flat in a suburban district of Wuhan on a recent morning.

FILE PHOTO: Medical personnel in protective suits wave hands to a patient who is discharged from the Leishenshan Hospital after recovering from the novel coronavirus, in Wuhan, the epicentre of the novel coronavirus outbreak, in Hubei province, China March 1, 2020. China Daily via REUTERS

A man wearing a single mask opened the door a crack and, after Du introduced herself as a psychological counsellor, burst into tears.

“I really can’t take it anymore,” he said. Diagnosed with the novel coronavirus in early February, the man, who appeared to be in his 50s, had been treated at two hospitals before being transferred to a quarantine centre set up in a cluster of apartment blocks in an industrial part of Wuhan.

Why, he asked, did tests say he still had the virus more than two months after he first contracted it?

The answer to that question is a mystery baffling doctors on the frontline of China’s battle against COVID-19, even as it has successfully slowed the spread of the coronavirus across the country.

Chinese doctors in Wuhan, where the virus first emerged in December, say a growing number of cases in which people recover from the virus, but continue to test positive without showing symptoms, is one of their biggest challenges as the country moves into a new phase of its containment battle.

Those patients all tested negative for the virus at some point after recovering, but then tested positive again, some up to 70 days later, the doctors said. Many have done so over 50-60 days.

The prospect of people remaining positive for the virus, and therefore potentially infectious, is of international concern, as many countries seek to end lockdowns and resume economic activity as the spread of the virus slows. Currently, the globally recommended isolation period after exposure is 14 days.

So far, there have been no confirmations of newly positive patients infecting others, according to Chinese health officials.

China has not published precise figures for how many patients fall into this category. But disclosures by Chinese hospitals to Reuters, as well as in other media reports, indicate there are at least dozens of such cases.

In South Korea, about 1,000 people have been testing positive for four weeks or more. In Italy, the first European country ravaged by the pandemic, health officials noticed that coronavirus patients could test positive for the virus for about a month.

As there is limited knowledge available on how infectious these patients are, doctors in Wuhan are keeping them isolated for longer.

Zhang Dingyu, president of Jinyintan Hospital, where the most serious coronavirus cases were treated, said health officials recognised the isolations may be excessive, especially if patients proved not to be infectious. But, for now, it was better to do so to protect the public, he said.    

He described the issue as one of the most pressing facing the hospital and said counsellors like Du are being brought in to help ease the emotional strain.

“When patients have this pressure, it also weighs on society,” he said.

DOZENS OF CASES

The plight of Wuhan’s long-term patients underlines how much remains unknown about COVID-19 and why it appears to affect different people in numerous ways, Chinese doctors say. So far global infections have hit 2.5 million with over 171,000 deaths.

As of April 21, 93% of 82,788 people with the virus in China had recovered and been discharged, official figures show.

Yuan Yufeng, a vice president at Zhongnan Hospital in Wuhan, told Reuters he was aware of a case in which the patient had positive retests after first being diagnosed with the virus about 70 days earlier.

“We did not see anything like this during SARS,” he said, referring to the 2003 Severe Acute Respiratory Syndrome outbreak that infected 8,098 people globally, mostly in China.

Patients in China are discharged after two negative nucleic acid tests, taken at least 24 hours apart, and if they no longer show symptoms. Some doctors want this requirement to be raised to three tests or more.

China’s National Health Commission directed Reuters to comments made at a briefing Tuesday when asked for comment about how this category of patients was being handled.

Wang Guiqiang, director of the infectious disease department of Peking University First Hospital, said at the briefing that the majority of such patients were not showing symptoms and very few had seen their conditions worsen.

“The new coronavirus is a new type of virus,” said Guo Yanhong, a National Health Commission official. “For this disease, the unknowns are still greater than the knowns.”

REMNANTS AND REACTIVATION

Experts and doctors struggle to explain why the virus behaves so differently in these people.

Some suggest that patients retesting as positive after previously testing negative were somehow reinfected with the virus. This would undermine hopes that people catching COVID-19 would produce antibodies that would prevent them from getting sick again from the virus.

Zhao Yan, a doctor of emergency medicine at Wuhan’s Zhongnan Hospital, said he was sceptical about the possibility of reinfection based on cases at his facility, although he did not have hard evidence.

“They’re closely monitored in the hospital and are aware of the risks, so they stay in quarantine. So I’m sure they were not reinfected.”

Jeong Eun-kyeong, director of the Korea Centers for Disease Control and Prevention, has said the virus may have been “reactivated” in 91 South Korean patients who tested positive after having been thought to be cleared of it.  

Other South Korean and Chinese experts have said that remnants of the virus could have stayed in patients’ systems but not be infectious or dangerous to the host or others.

Few details have been disclosed about these patients, such as if they have underlying health conditions.

Paul Hunter, a professor at the University of East Anglia’s Norwich School of Medicine, said an unusually slow shedding of other viruses such as norovirus or influenza had been previously seen in patients with weakened immune systems.

In 2015, South Korean authorities disclosed that they had a Middle East Respiratory Syndrome patient stricken with lymphoma who showed signs of the virus for 116 days. They said his impaired immune system kept his body from ridding itself of the virus. The lymphoma eventually caused his death.

FILE PHOTO: A volunteer walks inside a convention center that was used as a makeshift hospital to treat patients with the coronavirus disease (COVID-19), in Wuhan, Hubei province, China April 9, 2020. REUTERS/Aly Song

Yuan said that even if patients develop antibodies, it did not guarantee they would become virus-free.

He said that some patients had high levels of antibodies, and still tested positive to nucleic acid tests.

“It means that the two sides are still fighting,” he said.

MENTAL TOLL

As could be seen in Wuhan, the virus can also inflict a heavy mental toll on those caught in a seemingly endless cycle of positive tests.

Du, who set up a therapy hotline when Wuhan’s outbreak first began, allowed Reuters in early April to join her on a visit to the suburban quarantine centre on the condition that none of the patients be identified.

One man rattled off the names of three Wuhan hospitals he had stayed at before being moved to a flat in the centre.  He had taken over 10 tests since the third week of February, he said, on occasions testing negative but mostly positive.

“I feel fine and have no symptoms, but they check and it’s positive, check and it’s positive,” he said. “What is with this virus?”

Patients need to stay at the centre for at least 28 days and obtain two negative results before being allowed to leave. Patients are isolated in individual rooms they said were paid for by the government.

The most concerning case facing Du during the visit was the man behind the mahogany door; he had told medical workers the night before that he wanted to kill himself.

“I wasn’t thinking clearly,” he told Du, explaining how he had already taken numerous CT scans and nucleic acid tests, some of which tested negative, at different hospitals. He worried that he had been reinfected as he cycled through various hospitals.

His grandson missed him after being gone for so long, he said, and he worried his condition meant he would never be able to see him again.

He broke into another round of sobs. “Why is this happening to me?”

Reporting by Brenda Goh; Additional reporting by Jack Kim in Seoul, Elvira Pollina in Milan, Belen Carreno in Madrid, and Shanghai newsroom; Editing by Philip McClellan

Climate Change – Catastrophic or Linear Slow Progression? (Armstrong Economics)

woolyrhino
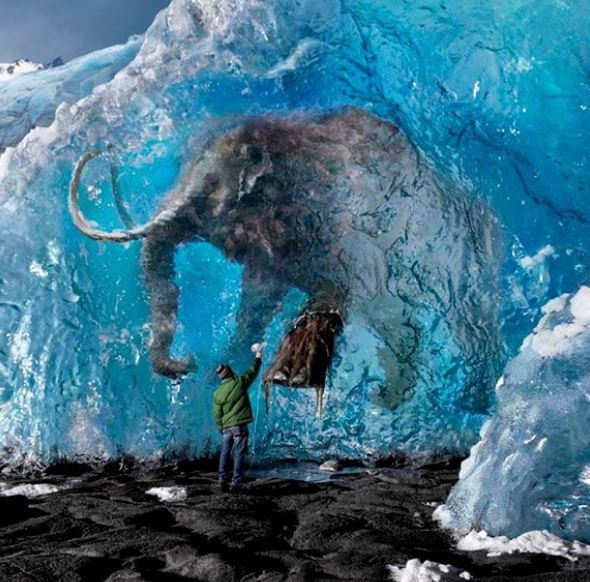
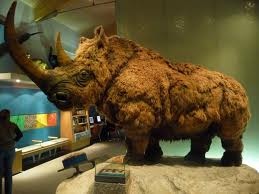
Indeed, science was turned on its head after a discovery in 1772 near Vilui, Siberia, of an intact frozen woolly rhinoceros, which was followed by the more famous discovery of a frozen mammoth in 1787. You may be shocked, but these discoveries of frozen animals with grass still in their stomachs set in motion these two schools of thought since the evidence implied you could be eating lunch and suddenly find yourself frozen, only to be discovered by posterity.

baby-mammoth

The discovery of the woolly rhinoceros in 1772, and then frozen mammoths, sparked the imagination that things were not linear after all. These major discoveries truly contributed to the “Age of Enlightenment” where there was a burst of knowledge erupting in every field of inquisition. Such finds of frozen mammoths in Siberia continue to this day. This has challenged theories on both sides of this debate to explain such catastrophic events. These frozen animals in Siberia suggest strange events are possible even in climates that are not that dissimilar from the casts of dead victims who were buried alive after the volcanic eruption of 79 AD at Pompeii in ancient Roman Italy. Animals can be grazing and then suddenly freeze abruptly. That climate change was long before man invented the combustion engine.

Even the field of geology began to create great debates that perhaps the earth simply burst into a catastrophic convulsion and indeed the planet was cyclical — not linear. This view of sequential destructive upheavals at irregular intervals or cycles emerged during the 1700s. This school of thought was perhaps best expressed by a forgotten contributor to the knowledge of mankind, George Hoggart Toulmin in his rare 1785 book, “The Eternity of the World“:

” ••• convulsions and revolutions violent beyond our experience or conception, yet unequal to the destruction of the globe, or the whole of the human species, have both existed and will again exist ••• [terminating] ••• an astonishing succession of ages.”

Id./p3, 110

bernhardi-erratics

In 1832, Professor A. Bernhardi argued that the North Polar ice cap had extended into the plains of Germany. To support this theory, he pointed to the existence of huge boulders that have become known as “erratics,” which he suggested were pushed by the advancing ice. This was a shocking theory for it was certainly a nonlinear view of natural history. Bernhardi was thinking out of the box. However, in natural science people listen and review theories unlike in social science where theories are ignored if they challenge what people want to believe. In 1834, Johann von Charpentier (1786-1855) argued that there were deep grooves cut into the Alpine rock concluding, as did Karl Schimper, that they were caused by an advancing Ice Age.

This body of knowledge has been completely ignored by the global warming/climate change religious cult. They know nothing about nature or cycles and they are completely ignorant of history or even that it was the discovery of these ancient creatures who froze with food in their mouths. They cannot explain these events nor the vast amount of knowledge written by people who actually did research instead of trying to cloak an agenda in pretend science.

Glaciologists have their own word, jökulhlaup(from Icelandic), to describe the spectacular outbursts when water builds up behind a glacier and then breaks loose. An example was the 1922 jökulhlaup in Iceland. Some seven cubic kilometers of water, melted by a volcano under a glacier, had rushed out in a few days. Still grander, almost unimaginably events, were floods that had swept across Washington state toward the end of the last ice age when a vast lake dammed behind a glacier broke loose. Catastrophic geologic events are not generally part of the uniformitarian geologist’s thinking. Rather, the normal view tends to be linear including events that are local or regional in size

One example of a regional event would be the 15,000 square miles of the Channeled Scablands in eastern WashingtonInitially, this spectacular erosion was thought to be the product of slow gradual processes. In 1923, JHarlen Bretz presented a paper to the Geological Society of America suggesting the Scablands were eroded catastrophically. During the 1940s, after decades of arguing, geologists admitted that high ridges in the Scablands were the equivalent of the little ripples one sees in mud on a streambed, magnified ten thousand times. Finally, by the 1950s, glaciologists were accustomed to thinking about catastrophic regional floods. The Scablands are now accepted to have been catastrophically eroded by the “Spokane Flood.” This Spokane flood was the result of the breaching of an ice dam which had created glacial Lake Missoula. Now the United States Geological Survey estimates the flood released 500 cubic miles of water, which drained in as little as 48 hours. That rush of water gouged out millions of tons of solid rock.

When Mount St. Helens erupted in 1980, this too produced a catastrophic process whereby two hundred million cubic yards of material was deposited by volcanic flows at the base of the mountain in just a matter of hours. Then, less than two years later, there was another minor eruption, but this resulted in creating a mudflow, which carved channels through the recently deposited material. These channels, which are 1/40th the size of the Grand Canyon, exposed flat segments between the catastrophically deposited layers. This is what we see between the layers exposed in the walls of the Grand Canyon. What is clear, is that these events were relatively minor compared to a global flood. For example, the eruption of Mount St. Helens contained only 0.27 cubic miles of material compared to other eruptions, which have been as much as 950 cubic miles. That is over 2,000 times the size of Mount St. Helens!

With respect to the Grand Canyon, the specific geologic processes and timing of the formation of the Grand Canyon have always sparked lively debates by geologists. The general scientific consensus, updated at a 2010 conference, maintains that the Colorado River carved the Grand Canyon beginning 5 million to 6 million years ago. This general thinking is still linear and by no means catastrophic. The Grand Canyon is believed to have been gradually eroded. However, there is an example cyclical behavior in nature which demonstrates that water can very rapidly erode even solid rock. An example of this took place in the Grand Canyon region back on June 28th, 1983. There emerged an overflow of Lake Powell which required the use of the Glen Canyon Dam’s 40-foot diameter spillway tunnels for the first time. As the volume of water increased, the entire dam started to vibrate and large boulders spewed from one of the spillways. The spillway was immediately shut down and an inspection revealed catastrophic erosion had cut through the three-foot-thick reinforced concrete walls and eroded a hole 40 feet wide, 32 feet deep, and 150 feet long in the sandstone beneath the dam. Nobody thought such catastrophic erosion that quick was even possible.

Some have speculated that the end of the Ice Age resulted in a flood of water which had been contained by an ice dam. Like that of the Scablands, it is possible that a sudden catastrophic release of water originally carved the Grand Canyon. It is clear that both the formation of the Scablands and the evidence of how Mount St Helens unfolded, may be support for the catastrophic formation of events rather than nice, slow, and linear formations.

Then there is the Biblical Account of the Great Flood and Noah. Noah is also considered to be a Prophet of Islam. Darren Aronofsky’s film Noah was based on the biblical story of Genesis. Some Christians were angry because the film strayed from biblical Scripture. The Muslim-majority countries banned the film Noah from screening in theaters because Noah was a prophet of God in the Koran. They considered it to be blasphemous to make a film about a prophet. Many countries banned the film entirely.

The story of Noah predates the Bible. There exists the legend of the Great Flood rooted in the ancient civilizations of Mesopotamia. The Sumerian Epic of Gilgamesh dates back nearly 5,000 years which is believed to be perhaps the oldest written tale on Earth. Here too, we find an account of the great sage Utnapishtim, who is warned of an imminent flood to be unleashed by wrathful gods. He builds a vast circular-shaped boat, reinforced with tar and pitch, and carries his relatives, grains along with animals. After enduring days of storms, Utnapishtim, like Noah in Genesis, releases a bird in search of dry land. Since there is evidence that there were survivors in different parts of the world, it is merely logical that there should be more than just one.

Archaeologists generally agree that there was a historical deluge between 5,000 and 7,000 years ago which hit lands ranging from the Black Sea to what many call the cradle of civilization, which was the floodplain between the Tigris and Euphrates rivers. The translation of ancient cuneiform tablets in the 19th century confirmed the Mesopotamian Great Flood myth as an antecedent of the Noah story in the Bible.

The problem that existed was the question of just how “great” was the Great Flood? Was it regional or worldwide? The stories of the Great Flood in Western Culture clearly date back before the Bible. The region implicated has long been considered to be the Black Sea. It has been suggested that the water broke through the land by Istanbul and flooded a fertile valley on the other side much as we just looked at in the Scablands. Robert Ballard, one of the world’s best-known underwater archaeologists, who found the Titanic, set out to test that theory to search for an underwater civilization. He discovered that some four hundred feet below the surface, there was an ancient shoreline, proving that there was a catastrophic event did happen in the Black Sea. By carbon dating shells found along the underwater shoreline, Ballard dated this catastrophic event to around 5,000 BC. This may match around the time when Noah’s flood could have occurred.

Given the fact that for the entire Earth to be submerged for 40 days and 40 nights is impossible for that much water to simply vanish, we are probably looking at a Great Flood that at the very least was regional. However, there are tales of the Great Floodwhich spring from many other sources. Various ancient cultures have their own legends of a Great Flood and salvation. According to Vedic lore, a fish tells the mythic Indian king Manu of a Great Flood that will wipe out humanity. In turn, Manu also builds a ship to withstand the epic rains and is later led to a mountaintop by the same fish.

We also find an Aztec story that tells of a devout couple hiding in the hollow of a vast tree with two ears of corn as divine storms drown the wicked of the land. Creation myths from Egypt to Scandinavia also involve tidal floods of all sorts of substances purging and remaking the earth. The fact that we have Great Flood stories from India is not really a surprise since there was contact between the Middle East and India throughout recorded history. However, the Aztec story lacks the ship, but it still contains punishing the wicked and here there was certainly no direct contact, although there is evidence of cocaine use in Egypt implying there was some trade route probably through island hopping in the Pacific to the shores of India and off to Egypt. Obviously, we cannot rule out that this story of the Great Flood even made it to South America. 

Then again, there is the story of Atlantis – the island that sunk beath the sea. The Atlantic Ocean covers approximately one-fifth of Earth’s surface and second in size only to the Pacific Ocean. The ocean’s name, derived from Greek mythology, means the “Sea of Atlas.” The origin of names is often very interesting clues as well. For example. New Jersey is the English Translation of Latin Nova Caesarea which appeared even on the colonial coins of the 18th century. Hence, the state of New Jersey is named after the Island of Jersey which in turn was named in the honor of Julius Caesar. So we actually have an American state named after the man who changed the world on par with Alexander the Great, for whom Alexandria of Virginia is named after with the location of the famous cemetery for veterans, where John F. Kennedy is buried.

So here the Atlantic Ocean is named after Atlas and the story of Atlantis. The original story of Atlantis comes to us from two Socratic dialogues called Timaeus and Critias, both written about 360 BC by the Greek philosopher Plato. According to the dialogues, Socrates asked three men to meet him: Timaeus of Locri, Hermocrates of Syracuse, and Critias of Athens. Socrates asked the men to tell him stories about how ancient Athens interacted with other states. Critias was the first to tell the story. Critias explained how his grandfather had met with the Athenian lawgiver Solon, who had been to Egypt where priests told the Egyptian story about Atlantis. According to the Egyptians, Solon was told that there was a mighty power based on an island in the Atlantic Ocean. This empire was called Atlantis and it ruled over several other islands and parts of the continents of Africa and Europe.

Atlantis was arranged in concentric rings of alternating water and land. The soil was rich and the engineers were technically advanced. The architecture was said to be extravagant with baths, harbor installations, and barracks. The central plain outside the city was constructed with canals and an elaborate irrigation system. Atlantis was ruled by kings but also had a civil administration. Its military was well organized. Their religious rituals were similar to that of Athens with bull-baiting, sacrifice, and prayer.

Plato told us about the metals found in Atlantis, namely gold, silver, copper, tin and the mysterious Orichalcum. Plato said that the city walls were plated with Orichalcum (Brass). This was a rare alloy metal back then which was found both in Crete as well as in the Andes, in South America. An ancient shipwreck was discovered off the coast of Sicily in 2015 which contained 39 ingots of Orichalcum. Many claimed this proved the story of AtlantisOrichalcum was believed to have been a gold/copper alloy that was cheaper than gold, but twice the value of copper. Of course, Orichalcum was really a copper-tin or copper-zinc brass. We find in Virgil’s Aeneid, the breastplate of Turnus is described as “stiff with gold and white orichalc”.

The monetary reform of Augustus in 23BC reintroduced bronze coinage which had vanished after 84BC. Here we see the introduction of Orichalcum for the Roman sesterius and the dupondius. The Roman As was struck in near pure copper. Therefore, about 300 years after Plato, we do see Orichalcum being introduced as part of the monetary system of Rome. It is clear that Orichalcum was rare at the time Plato wrote this. Consequently, this is similar to the stories of America that there was so much gold, they paved the streets with it.

As the story is told, Atlantis was located in the Atlantic Ocean. There have been bronze-age anchors discovered at the Gates of Hercules (Straights of Gibralter) and many people proclaimed this proved Atlantis was real. However, what these proponents fail to take into account is the Minoans. The Minoans were perhaps the first International Economy. They traded far and wide even with Britain seeking tin to make bronze – henceBronze Age. Their civilization was of the Bronze Age rising civilization that arose on the island of Crete and flourished from approximately the 27th century BC to the 15th century BC – nearly 12,000 years. Their trading range and colonization extended to Spain, Egypt, Israel (Canaan), Syria (Levantine), Greece, Rhodes, and of course to Turkey (Anatolia). Many other cultures referred to them as the people from the islands in the middle of the sea. However, the Minoans had no mineral deposits. They lacked gold as well as silver or even the ability to produce large mining of copper. They appear to have copper mines in Anatolia (Turkey) in colonized cities. What has survived are examples of copper ingots that served as MONEY in trade. Keep in mind that gold at this point was rare, too rare to truly serve as MONEY. It is found largely as jewelry in tombs of royal dignitaries.

The Bronze Age emerged at different times globally appearing in Greece and China around 3,000BC but it came late to Britain reaching there about 1900BC. It is known that copper emerged as a valuable tool in Anatolia (Turkey) as early as 6,500BC, where it began to replace stone in the creation of tools. It was the development of casting copper that also appears to aid the urbanization of man in Mesopotamia. By 3,000BC, copper is in wide use throughout the Middle East and starts to move up into Europe. Copper in its pure stage appears first, and tin is eventually added creating actual bronze where a bronze sword would break a copper sword. It was this addition of tin that really propelled the transition of copper to bronze and the tin was coming from England where vast deposits existed at Cornwall. We know that the Minoans traveled into the Atlantic for trade. Anchors are not conclusive evidence of Atlantis.

As the legend unfolds, Atlantis waged an unprovoked imperialistic war on the remainder of Asia and Europe. When Atlantis attacked, Athens showed its excellence as the leader of the Greeks, the much smaller city-state the only power to stand against Atlantis. Alone, Athens triumphed over the invading Atlantean forces, defeating the enemy, preventing the free from being enslaved, and freeing those who had been enslaved. This part may certainly be embellished and remains doubtful at best. However, following this battle, there were violent earthquakes and floods, and Atlantis sank into the sea, and all the Athenian warriors were swallowed up by the earth. This appears to be almost certainly a fiction based on some ancient political realities. Still, the explosive disappearance of an island some have argued is a reference to the eruption of MinoanSantorini. The story of Atlantis does closely correlate with Plato’s notions of The Republic examining the deteriorating cycle of life in a state.


There have been theories that Atlantiswas the Azores, and still, others argue it was actually South America. That would explain to some extent the cocaine mummies in Egypt. Yet despite all these theories, usually, when there is an ancient story, despite embellishment, there is often a grain of truth hidden deep within. In this case, Atlantis may not have completely submerged, but it could have partially submerged from an earthquake at least where some people survived. Survivors could have made to either the Americas or to Africa/Europe. What is clear, is that a sudden event could have sent a  tsunami into the Mediterranean which then broke the land mass at Istanbul and flooded the valley below transforming this region into the Black Sea becoming the story of Noah.

We also have evidence which has surfaced that the Earth was struck by a comet around 12,800 years ago. Scientific American has published that sediments from six sites across North America—Murray Springs, Ariz.; Bull Creek, Okla.; Gainey, Mich.; Topper, S.C.; Lake Hind, Manitoba; and Chobot, Alberta, have yielded tiny diamonds, which only occur in sediment exposed to extreme temperatures and pressures. The evidence surfacing implies that the Earth moved into an Ice Age killing off large mammals and setting the course for Global Cooling for the next 1300 years. This may indeed explain that catastrophic freezing of Wooly Mammoths in Siberia. Such an event could have also been responsible for the legend of Atlantis where the survivors migrated taking their stories with them.

There is also evidence surfacing from stone carvings at one of the oldest sites recorded located in Anatolia (Turkey). Using a computer programme to show where the constellations would have appeared above Turkey thousands of years ago, researchers were able to pinpoint the comet strike to 10,950BC, the exact time the Younger Dryas,which was was a return to glacial conditions and Global Cooling which temporarily reversed the gradual climatic warming after the Last Glacial Maximum that began to recede around 20,000 BC, utilizing ice core data from Greenland.

Now, there is a very big asteroid which passed by the Earth on September 16th, 2013. What is most disturbing is the fact that its cycle is 19 years so it will return in 2032. Astronomers have not been able to swear it will not hit the Earth on the next pass in 2032. It was discovered by Ukrainian astronomers with just 10 days to go back in 2013.  The 2013 pass was only a distance of 4.2 million miles (6.7 million kilometers). If anything alters its orbit, then it will get closer and closer. It just so happens to line up on a cyclical basis that suggests we should begin to look at how to deflect asteroids and soon.

It definitely appears that catastrophic cooling may also be linked to the Earth being struck by a meteor, asteroids, or a comet. We are clearly headed into a period of Global Cooling and this will get worse as we head into 2032. The question becomes: Is our model also reflecting that it is once again time for an Earth change caused by an asteroid encounter? Such events are not DOOMSDAY and the end of the world. They do seem to be regional. However, a comet striking in North America would have altered the comet freezing animals in Siberia.

If there is a tiny element of truth in the story of Atlantis, the one thing it certainly proves is clear – there are ALWAYS survivors. Based upon a review of the history of civilization as well as climate, what resonates profoundly is that events follow the cyclical model of catastrophic occurrences rather than the linear steady slow progression of evolution.

¿Adiós al Servicio Meteorológico? Un biólogo argentino predice el clima estudiando hormigas (y acierta) (La Nación)

Jorge Finardi anticipa lluvias y tormentas a partir del comportamiento de insectos

LA NACION

JUEVES 26 DE ENERO DE 2017 • 17:44

¿Chau Servicio Meteorológico? El biólogo argentino que predice el clima estudiando hormigas

¿Chau Servicio Meteorológico? El biólogo argentino que predice el clima estudiando hormigas. Foto: Archivo 

Jorge Finardi predice el clima a través de las hormigas. Estudia sus movimientos, los registra, los compara y llega a la conclusión, por ejemplo, de que mañana a la tarde lloverá. Y acierta. Esta semana, Finardi anticipó con su método el calor sofocante del lunes, la tormenta del martes, y la caída de la temperatura del miércoles. Nada mal.

Finardi es químico, biólogo, y lleva adelante la cuenta de Twitter @GeorgeClimaPron. En ella, comunica sus pronósticos climatológicos. En una entrevista con LA NACION, explica su sistema.

-¿Cómo funciona tu método de análisis?

-En primer lugar, determino el grado de actividad de las hormigas en una escala del 1 al 10. Para armar la escala tengo en cuenta la cantidad de interacciones entre las hormigas, el número de hormigas involucradas, y el tipo y tamaño de carga que llevan, además, de la clase de hormiga que trabaja.

-¿Y de qué manera se relaciona con el clima? ¿Más actividad es indicativa de lluvia?

-En parte sí, pero depende de la carga que lleven. Por ejemplo, cuando las hormigas llevan palitos y barritas, es porque tienen que fortalecer el hormiguero, debido a que se aproxima lluvia o frío. Cuando hay movilización de tierra es porque se viene una lluvia fuerte. Cuando llevan cereal, viene frío, porque el cereal fermenta dentro del hormiguero y produce calor para que nazcan los hongos que ellas comen.

Para las altas temperaturas, por otro lado, se acondicionan los túneles: las hormigas empiezan a abrir “chimeneas”, que son como agujeritos esparcidos dentro del hormiguero, que puede llegar a tener metros de profundidad. Cuando pasa eso, se viene una ola de calor.

-¿Cómo te interesaste por el tema?

-Desde los tres años me paso horas mirando las hormigas y todo tipo de insectos. Por otro lado, mi profesión me ayudó a profundizar estos temas, y también a hablar con gente de edad avanzada que vive en el campo y no se fija en los pronósticos. No los necesita. Así avancé. Así y con un poco de prueba y error. Al principio introduje hormigas en un terrario para poder observarlas más cómodo. Pero ellas se comportaban de otra manera, por el aislamiento. Ahora las sigo con una cámara.

-¿Además de las hormigas, analizás otros insectos?

-Sí. Las arañas, por ejemplo, tienen la capacidad de detectar actividad eléctrica, cuando aparecen y están muy activas. Las libélulas pueden anticipar una tormenta o viento. Las cigarras anuncian calor. Los gallos, cuando cantan a media noche, anuncian neblinas. También hay que prestar atención a las hormigas cuando están desorientadas, porque pueden captar actividad sísmica a grandes distancias.

-¿Este tipo de análisis es científico?

-No. Hay que destacar que el método no es científico, no es positivista, pero sí es cualitativo, experimental y observacional. Y sirve. Los hombres estamos acá desde el período cuaternario, pero las hormigas, por ejemplo, están desde la época de los dinosaurios. Están muy adaptadas, son muy sensibles a los cambios de ambiente. Y la naturaleza, así, nos habla, nos presenta síntomas. Hay que saber leerlos.

Com 516 milímetros de chuva em 5 anos, Ceará tem pior seca desde 1910 (G1)

09/09/2016 09h20 – Atualizado em 09/09/2016 11h57

Previsão para 2017 ainda é indefinida devido ao “Oceano Pacífico Neutro”.
Águas do Açude Orós estão sendo transferidas para o Castanhão.

Do G1 CE com informações da TV Verdes Mares

VER VIDEO

Levantamento feito pela Fundação Cearense de Meteorologia e Recursos Hídricos (Funceme) nesta quinta-feira (8) mostra que nos últimos cinco anos, de 2012 a 2016, foram apenas 516 milímetros de chuva, em média, no Ceará. O índice é o menor desde 1910.

De acordo com o meteorologista Davi Ferran, vai ser preciso conviver com a incerteza pelos próximos meses, já que ainda é cedo pra afirmar se 2017 vai trazer chuva ou não.

Ano Chuva (mm)
2012 388
2013 552
2014 565
2015 524
2016 550
Média 516
Fonte: Funceme

“No período chuvoso do ano que vem, ou seja, março, abril e maio, que é o período chuvoso principal, a maior probabilidade é que o Oceano Pacífico não tenha El Niño nem La Niña. Vamos ter o Oceano Pacífico neutro. Em anos de Oceano Pacífico neutro, a probabilidade de chuvas no Ceará depende mais fortemente do Atlântico. Então a previsão vai ser divulgada somente em janeiro”, explica.

Enquanto isso, segundo a Companhia de Gestão de Recursos Hídricos (Cogerh), os reservatórios secam cada vez mais. No momento, o nível médio dos 153 açudes monitorados pela Cogerh é de apenas 9,4% do volume total.O “Gigante” Castanhão, responsável por abastecer toda a Região Metropolitana de Fortaleza, está praticamente sem água. Há apenas sete anos, ele chegou a inundar a cidade de Jaguaribara com a enorme vazão das comportas.

Hoje, a Cogerh diz que o maior açude do Ceará está com apenas 6% da capacidade. Bem perto dele, o Açude Orós, também na Região Jaguaribana, sangrou em 2004 e 2008. Na época, virou até atração turística no Centro Sul do Estado.

Agora em 2016, o Orós aparece nesse cenário de seca em forma de ajuda. Desde julho, as águas do açude estão sendo transferidas para o Castanhão. Segundo a Cogerh, essa água deve chegar às residências da Região Metropolitana de Fortaleza em setembro, e garantir o abastecimento pelo menos durante esse período  de crise hídrica.

“Nossa programação é até o final de janeiro. Ou seja, até janeiro vamos estar operando de forma integrada os dois reservatórios. O caso da Região Metropolitana, ela está totalmente integrada à Região do Jaguaribe por dois grandes canais: o do Trabalhador e Eixão das Águas. Então é o caso de uma bacia hoje tem uma maior dependência de outra região, de outra bacia hidrográfica, mas elas estão integradas. Esse é o caso que eu diria mais emblemática no Estado”, explica o presidente da Cogerh, João Lúcio Farias.

saiba mais

Uncertainty in Brazil, Vitality in Its Art (New York Times)

SÃO PAULO, Brazil — Biennial art exhibitions were founded in the 1890s at almost the same time as the Olympics, and they serve a similar purpose: to bring attention to the cities that host them and the nations that participate in them. But where the Olympics are still a rather contained affair, art biennials are proliferating like art fairs, becoming homogeneous and forgettable.

The 32nd São Paulo Biennial, through Dec. 11, consciously tries to buck this trend by positioning itself as locally sensitive and globally pertinent. And its timing is perfect. On the heels of the Rio Olympics and the impeachment of Brazil’s president Dilma Rousseff, the exhibition embraces, rather than denies, the problems of the region.

Organized by Jochen Volz, the show includes 81 artists from 33 countries. Its title, “Incerteza Viva” — translated as “Live Uncertainty” — refers to political instability, climate change, huge disparities of wealth, migration and other international problems, but also suggests art’s ability to thrive in the unknown and suggest visionary solutions.

This is particularly true on the first floor of the pavilion built by Oscar Niemeyer, which showcases Brazilian art with an international context: The artist Bené Fonteles has erected a “terreiro,” or ceremonial structure made of clay with a thatched roof, in an attempt to connect traditional Brazilian practices with contemporary art ones.

Objects used by an indigenous shaman sit alongside photos of Marcel Duchamp and John Lennon and Yoko Ono and a copy of João Guimarães-Rosa’s novel “Grande Sertão: Veredas” (1956) — in English, it was “The Devil to Pay in the Backlands”— a masterpiece of modern Brazilian literature. (Incorporating archaic dialects, it has been compared to Joyce’s “Finnegans Wake.”)

One of the most beautiful works in the Biennial is Jonathas de Andrade’s “The Fish” (2016), in which he filmed fishermen in the mangroves of northeast Brazil who still use traditional methods like nets and harpoons. For the video, Mr. de Andrade had the fishermen hold a caught fish to their chests, as if cradling a baby, until it takes its last breath.

At the São Paulo Biennial, the artist Bené Fonteles has erected a “terreiro,” or ceremonial structure made of clay with a thatched roof, in an attempt to connect traditional Brazilian practices with contemporary art ones.Credit Leo Eloy/Estúdio Garagem/Fundação Bienal de São Paulo. 

The video is a shockingly intimate depiction of life, death and the relationship of predator and prey — but also a reminder of our connection with other species — a fact that gets lost in the hyper-industrialized world.

The Brazilian director Leon Hirszman’s films from the 1970s documenting rural laborers singing as they work expand upon this idea. Mr. Hirszman describes the songs, which relieved boredom and shaped the rhythm and movements of the work, as “endangered” cultural products. You can’t sing, after all, over the sounds of industrial machines — or in your corporate cubicle.

Folk art and craft-based practices, often seen as an antidote to digital culture and social media, have been very popular on the biennial circuit in recent years. Folk-inspired art here includes Gilvan Samico’s prints influenced by mythology and carving in northeastern Brazil, and the visionary 1950s and ’60s work by Oyvind Fahlstrom, a Swedish multimedia artist who championed concrete poetry — a visual way of finding liberation through patterns of words and typography. The neo-hippie installation by Wlademir Dias-Pino, “Brazilian Visual Encyclopedia” (1970-2016), is a wild compendium of collages made with found materials.

The Biennial organizers stress that “Live Uncertainty” was intended to interact with the surrounding Ibirapuera Park, a habitat for indigenous tribes before the Europeans arrived. But even nature is a contested term these days, especially in Brazil, where the rain forest and grasslands were seen as obstacles to be conquered. Even Niemeyer, the architect whose futuristic buildings are scattered throughout the park, originally planned to pave over the area in an attempt to tame (if symbolically) Brazil’s unruly wilderness.

The exhibition includes installations by Pia Lindman and Ruth Ewan, which incorporate live plants, and Eduardo Navarro’s sculptural megaphone, which twists out the window to let visitors talk to a palm tree. Brazilian wood — often seen as “exotic” and hence harvested to the brink of extinction — earns a category of the Biennial unto itself.

Carolina Caycedo’s excellent video looks at how river development has affected communities in Brazil’s interior. In Rachel Rose’s video, an astronaut, David Wolf, describes how it’s harder to acclimate to Earth, with its overwhelming smells of grass and air, and gravity, than to outer space.

Jochen Volz, the curator of the São Paulo Biennial, which continues through Dec. 11.CreditNelson Almeida/Agence France-Presse — Getty Images 


What started in the ’90s as “identity art,” the idea that an individual’s identity consists of multiple factors, including gender, race, ethnicity, class and sexuality, has now blossomed into investigations of “the post-human,” which could mean a robot or an extraterrestrial.

Lyle Ashton Harris provides some grounding of these cultural shifts in his beautiful assemblage of photographs from this American artist’s journals intertwined with video. Much of his archive is from the late ’80s and ’90s, coinciding with landmark events such as the Black Popular Culture Conference in 1991, the truce between the Crips and the Bloods in 1992 and the Black Nations/Queer Nations conference in 1995.

Cecilia Bengolea and Jeremy Deller’s video highlights a competitive dancer in Jamaican dancehall music culture, echoing the importance of popular music and identity that reverberates throughout the show.

Another tic of biennials is their expansionist tendency: Tired of the white cube, artists and curators would rather inhabit shops, hospitals, schools. This seems like a democratic move, but it often functions in just the opposite way, expending a huge amount of viewers’ time and energy.

“Live Uncertainty” remains mostly — thankfully — in the pavilion. One outside work included William Pope.L’s roving performance with a small contingent of local dancers, which took place over three days. Performers moved through the city in costumes inspired by debutante festivals. They made a sharp contrast with demonstrators who were springing up, too, protesting the president’s impeachment.

Biennials are now given the impossible task of making sense not only of contemporary art but also contemporary history, politics, philosophy, economics, the environment and beyond — all the while remaining sensitive to local culture and cognizant of global developments.

With this tall order, “Live Uncertainty” does an admirable balancing act, arguing for the vitality of indigenous knowledge and experience, and of wisdom drawn from the people who inhabited this hemisphere long before Europeans arrived. Given the current climate of uncertainty in Brazil, this makes more than a little good sense.

Seca se intensifica com alto risco para cerca de 90 municípios do semiárido brasileiro (CEMADEN)

JC, 5498, 8 de setembro de 2016

As chuvas de setembro a novembro devem se tornar mais escassas na Zona da Mata dos Estados de Sergipe, Alagoas, Pernambuco, Paraíba e Rio Grande do Norte. Há poucas chances de reversão do quadro crítico dos municípios impactados pela seca, conforme o Relatório da Seca no Semiárido Brasileiro e Impactos divulgado, hoje, pelo Cemaden

O período chuvoso, entre abril e julho, apresentou um déficit pluviométrico, agravado no mês de agosto,  com o registro de acumulados de chuva inferiores a 60 mm nos municípios da maior parte da região Nordeste. Esses municípios, principalmente na zona da mata, foram caracterizados por condições de  “ Muito Seco”.

A avaliação do risco agroclimático (balanço hídrico) para o ano hidrológico 2015/2016 – referente ao período de outubro de 2015 a 31 de agosto de 2016- indicou que cerca de 90 municípios foram classificados como de risco “Alto”, aos que apresentaram entre 60 a 75 dias com déficit hídrico  e  de “Muito Alto”, para os municípios com mais de 75 dias com o déficit hídrico.

O trimestre agosto -setembro-outubro de 2016 pode marcar a transição para um episódio de La Niña, provavelmente com fraca intensidade. A evolução climatológica (histórica) das precipitações no trimestre Setembro-Outubro-Novembro/2016 indica que as chuvas devem se tornar mais escassas na Zona da Mata dos Estados de Sergipe, Alagoas, Pernambuco, Paraíba e Rio Grande do Norte. Portanto, para os municípios impactados pela seca, nestes Estados, há poucas chances de reversão do quadro crítico.

“A intensidade dos impactos da seca atingem as atividades agrícolas e/ou pastagens. A situação de seca intensificou-se, principalmente, na parte leste da Região Semiárida, atingindo os municípios inseridos nos estados do Rio Grande do Norte, Paraíba e Pernambuco.”, destaca o coordenador-geral do Cemaden, meteorologista Marcelo Seluchi. Ele explica que essa seca é o reflexo dos acumulados de chuva inferiores a média dos meses da estação chuvosa- entre os meses de abril a julho – conforme o sensoriamento remoto com base no índice de suprimento de água para a vegetação (VSWI).

Essa análise foi divulgada, hoje,  no Boletim da Seca e Impactos no Semiárido Brasileiro de Agosto 2016, elaborado pelo Centro Nacional de Monitoramento e Alertas de Desastres Naturais (Cemaden), do Ministério da Ciência, Tecnologia, Inovações e Comunicações.

No relatório, de acordo com o índice de suprimento de água para a vegetação (VSWI), 981 municípios apresentaram pelo menos 50% de suas áreas impactadas no mês de agosto de 2016. “ A estação chuvosa foi encerrada no ultimo mês de julho e, em razão disso, o estresse vegetativo atual é esperado.”, explica Seluchi.  Considerando as poucas regiões onde o calendário de plantio se estende até o mês de junho,  o ciclo fenológico pode ainda estar em curso nos municípios inseridos no Estado de Alagoas, região leste da Bahia, Pernambuco e Sergipe. Nessa região, as áreas impactadas pela seca somam cerca de 9 milhões de hectares.

As previsões em escala de médio prazo (até 21 de agosto) indicam condições favoráveis para a ocorrência de precipitações no litoral da Bahia, ao sul de Salvador. A previsão climática sazonal de chuva (MCTIC) para setembro-outubro e novembro de 2016 mostra, para toda a região Nordeste do País, uma previsão na qual os três cenários (acima-dentro-abaixo da média) são igualmente prováveis, indicando a incerteza associada a esta previsão.

Assessoria de Comunicação do Cemaden

Global climate models do not easily downscale for regional predictions (Science Daily)

Date:
August 24, 2016
Source:
Penn State
Summary:
One size does not always fit all, especially when it comes to global climate models, according to climate researchers who caution users of climate model projections to take into account the increased uncertainties in assessing local climate scenarios.

One size does not always fit all, especially when it comes to global climate models, according to Penn State climate researchers.

“The impacts of climate change rightfully concern policy makers and stakeholders who need to make decisions about how to cope with a changing climate,” said Fuqing Zhang, professor of meteorology and director, Center for Advanced Data Assimilation and Predictability Techniques, Penn State. “They often rely upon climate model projections at regional and local scales in their decision making.”

Zhang and Michael Mann, Distinguished professor of atmospheric science and director, Earth System Science Center, were concerned that the direct use of climate model output at local or even regional scales could produce inaccurate information. They focused on two key climate variables, temperature and precipitation.

They found that projections of temperature changes with global climate models became increasingly uncertain at scales below roughly 600 horizontal miles, a distance equivalent to the combined widths of Pennsylvania, Ohio and Indiana. While climate models might provide useful information about the overall warming expected for, say, the Midwest, predicting the difference between the warming of Indianapolis and Pittsburgh might prove futile.

Regional changes in precipitation were even more challenging to predict, with estimates becoming highly uncertain at scales below roughly 1200 miles, equivalent to the combined width of all the states from the Atlantic Ocean through New Jersey across Nebraska. The difference between changing rainfall totals in Philadelphia and Omaha due to global warming, for example, would be difficult to assess. The researchers report the results of their study in the August issue of Advances in Atmospheric Sciences.

“Policy makers and stakeholders use information from these models to inform their decisions,” said Mann. “It is crucial they understand the limitation in the information the model projections can provide at local scales.”

Climate models provide useful predictions of the overall warming of the globe and the largest-scale shifts in patterns of rainfall and drought, but are considerably more hard pressed to predict, for example, whether New York City will become wetter or drier, or to deal with the effects of mountain ranges like the Rocky Mountains on regional weather patterns.

“Climate models can meaningfully project the overall global increase in warmth, rises in sea level and very large-scale changes in rainfall patterns,” said Zhang. “But they are uncertain about the potential significant ramifications on society in any specific location.”

The researchers believe that further research may lead to a reduction in the uncertainties. They caution users of climate model projections to take into account the increased uncertainties in assessing local climate scenarios.

“Uncertainty is hardly a reason for inaction,” said Mann. “Moreover, uncertainty can cut both ways, and we must be cognizant of the possibility that impacts in many regions could be considerably greater and more costly than climate model projections suggest.”

Cobrada pelo mau tempo, Fundação Cacique Cobra Coral diz que não falhou (O Globo)

Representantes da organização garantem que não houve falhas em sua operação

Apesar da operação da Fundação Cacique Cobra Coral os jogos do Rio tem registrado mau tempo, com provas tendo que ser adiadas Foto: Jorge William / Agência O Globo

Apesar da operação da Fundação Cacique Cobra Coral os jogos do Rio tem registrado mau tempo, com provas tendo que ser adiadas – Jorge William / Agência O Globo

POR LUIZ ERNESTO MAGALHAES

10/08/2016 15:53 / atualizado 10/08/2016 16:17

RIO – Regatas na Lagoa adiadas, sessões de tênis remarcadas, transtornos provocados por ressacas que invadem instalações na Praia de Copacabana… Credenciados pelo Comitê Organizador Rio-2016 para acompanhar as condições climáticas durante a Olimpíada, os integrantes da Fundação Cacique Cobra Coral, que garantem ter poder sobrenatural para controlar o tempo, afirmam que não houve falhas na operação espiritual para garantir o sucesso da Olimpíada.

A médium Adelaide Scritori, que afirma incorporar o espírito do Cacique Cobra Coral, já circulou várias vezes pelo Parque Olímpico. O porta-voz da fundação, Osmar Santos, garante que o desempenho até agora da entidade é digno de medalha de ouro. Segundo ele, as prioridades foram direcionar o tempo para garantir a cerimônia de abertura sem chuvas e que os ventos soprassem de forma a a garantir que as regatas da Baía de Guanabara ocorressem em raias sem lixo:

Segundo Osmar, no domingo, quando uma forte ventania atingiu a cidade causando estragos e adiando provas do remo, Adelaide sequer estava no Rio. A médium, segundo ele, estaria na Região Serrana, encerrando a operação da Cerimônia de Abertura. O porta voz da médium argumenta que as demandas espirtuais da entidade são inúmeras e não se limitam a Olimpíada

– O grande legado nosso da cerimônia de abertura foi o desvio da Frente Fria que estava no Rio e foi desviada para Minas erais onde despejou 30 milímetros de chuva em pleno agosto no Vale do Jequitinonha. Isso para o cacique é muito mais importante. Agora vamos abrir um corredor para as frentes entrarem pelo continente e apagarem as queimadas no Pantanal – disse Osmar.

De acordo com Osmar, o mau tempo de hoje está relacionado com o atraso na entrada da frente fria na cidade para garantir a limpeza da Baía

Essa não é a primeira vez que a Fundação atua numa Olimpíada. Repórteres do GLOBO encontraram integrantes da Fundação em Londres, em 2012, credenciados inclusive para uma visita da presidente afastada Dilma Roousseff durante um evento oficial do Comitê Olímpico do Brasil. Adelaide também estava em Copenhague (Dinamarca) em 2009 quando o Rio foi eleito cidade sede da Olimpíada de 2016.

A Fundação também, é chamada para outros eventos como o Réveillon e o Rock in Rio. Nas últimas edições das Olimpíadas, no entanto, chegou a chover forte alguns dias. A Fundação Cacique Cobra Coral nas duas ocasiões alegou que ficou retida antes de chegar à Cidade do Rock por problemas no credenciamento do carro que transportava os integrantes.

Leia mais sobre esse assunto em  http://oglobo.globo.com/rio/cobrada-pelo-mau-tempo-fundacao-cacique-cobra-coral-diz-que-nao-falhou-19894579#ixzz4H3PcWa6C
© 1996 – 2016. Todos direitos reservados a Infoglobo Comunicação e Participações S.A. Este material não pode ser publicado, transmitido por broadcast, reescrito ou redistribuído sem autorização.

Cemaden completa cinco anos com o monitoramento de 957 municípios do País (MCTI)

JC, 5449, 1 de julho de 2016

Mais de R$ 72 milhões já foram investidos em radares meteorológicos de alta resolução para monitoramento de áreas de risco. Além disso, o Cemaden desenvolve tecnologia para previsão de quebra de safra no semiárido

O Centro Nacional de Monitoramento e Alertas de Desastres Naturais (Cemaden) completa cinco anos com o monitoramento de áreas de risco em 957 municípios do País. Um trabalho feito 24 horas por dia, sem interrupção. As informações fornecidas por radares meteorológicos de alta tecnologia já permitiram a emissão de 5,5 mil alertas para a Defesa Civil. Segundo o diretor do Cemaden, Osvaldo Moraes, 12 novos equipamentos serão adquiridos, o que vai aumentar a confiabilidade dos alertas.

“Os radares serão instalados nas áreas que atualmente não estão cobertas, o que fará com que o Brasil possua um dos mais avançados sistemas de monitoramento de risco de ocorrência de desastres naturais do mundo”, afirma Moraes.

Vinculado ao Ministério da Ciência, Tecnologia, Inovações e Comunicações, o Cemaden investiu R$ 72 milhões em nove radares meteorológicos, equipamentos no estado da arte para aplicações voltadas ao monitoramento de desastres naturais instalados em Petrolina (PE), Natal (RN), Maceió (AL), Salvador (BA), Almenara (MG), Três Marias (MG), São Francisco (MG), Santa Teresa (ES) e Jaraguari (MS). Com eles, o Cemaden consegue mensurar a quantidade de chuvas, fazer uma previsão de tempo de curtíssimo prazo e antecipar a emissão de alertas para municípios com risco de desastres naturais. Os dados estão disponíveis em tempo real para acesso público.

“Esses radares possuem a capacidade de identificar e localizar as nuvens presentes dentro da área de cobertura do equipamento, além de medir a quantidade de chuva em um determinado local. O uso permite que os operadores do Cemaden identifiquem os locais onde as condições meteorológicas aumentam o risco de desastres naturais. Com isso, podemos emitir alertas antecipados sobre o risco de deslizamentos de terra e enchentes, por exemplo, preservando as vidas das pessoas expostas ao risco”, explica o coordenador do projeto Radares Meteorológicos do Cemaden, Carlos Frederico de Angelis.

Ele ressalta que a unidade implantada em Maceió, por exemplo, possui tecnologia e sensibilidade para levantar dados elaborados sobre chuvas num raio de 400 quilômetros de distância. Segundo Angelis, o equipamento é capaz de antecipar os riscos de desastres provocados por fenômenos meteorológicos com até seis horas de antecedência.

“Um desastre natural afeta não só a vida das pessoas que estão em áreas de risco como também a infraestrutura e a economia, como o agronegócio, por exemplo. Os impactos são ainda maiores para os pequenos produtores”, diz Angelis.

Ciência Cidadã

A quebra de safras agrícolas também está no radar do Cemaden, que vai lançar, no segundo semestre, o Sistema de Previsão de Riscos de Colapso de Safras no Semiárido Brasileiro com previsões de risco de colapso de safras geradas a partir de estimativas de modelos agrometeorológicos; dados públicos de safras típicas (milho, mandioca, feijão, arroz e sorgo) por região; e previsão do tempo para um período de 15 a 45 dias.

“A implantação deste projeto contempla o uso de modelos agrometeorológicos integrados a uma rede de monitoramento de dados (meteorológicos, fenológicos, práticas de manejo e informações do solo), contribuindo para a geração de indicadores para o monitoramento da seca, previsão e manejo dos riscos de colapso de safras e aprimoramento dos sistemas de alerta”, explica o diretor do Cemaden.

Além disso, o sistema vai contar com as informações enviadas pelos próprios produtores por meio de aplicativo desenvolvido em parceria com o Instituto Nacional de Ciência e Tecnologia para Mudanças Climáticas (INCT) do MCTIC e o International Institute for Applied Systems Analysis (Iiasa), da Áustria.

Disponibilizado para aparelhos celulares desde o início do ano, o AgriSupport permite o registro fotográfico georreferenciado de áreas plantadas e a coleta de informações sobre plantios realizados pelos pequenos produtores do semiárido.

No futuro, o monitoramento das safras será estendido para outros cultivos em outras regiões do País.

 MCTIC

2016 é um dos anos mais secos do Ceará e o pior começa agora (O Povo)

CHUVA 14/06/2016

Os meteorologistas afirmam que não há previsão de precipitações para os últimos seis meses do ano 

Igor Cavalcante

Os próximos meses serão de mais escassez hídrica para o Ceará. Quando o assunto é chuva, o segundo semestre é o mais crítico para o Estado. As precipitações que ainda acontecem são causadas por instabilidades meteorológicas e não devem impactar no cenário de estiagem.

Em coletiva de imprensa ontem, a Fundação Cearense de Meteorologia e Recursos Hídricos (Funceme) informou que, de 2012 para cá, a estiagem deste ano é a segunda pior. Em algumas regiões não choveu nem metade do esperado. O cenário faz de 2016 um dos dez anos mais secos da história.

Contudo, monitoramento do Oceano Pacífico indica que águas estão resfriando. É um sinal de que precipitações podem aumentar no próximo ano. O aquecimento oceânico, fenômeno conhecido como El Niño, impacta na formação da Zona de Convergência Intertropical, principal responsável pelas chuvas na costa cearense. Quando parte do Pacífico está aquecida, as nuvens tendem a se formar e precipitar no mar.

De acordo com Eduardo Sávio Martins, presidente da Funceme, ainda é cedo para garantir boa quadra chuvosa para 2017. “É um aspecto positivo, mas temos de aguardar como vai ser o padrão desse resfriamento”, pondera.

O meteorologista Raul Fritz também é cauteloso quanto às previsões. Segundo ele, mesmo num cenário em que não haja El Niño, bom inverno é incerto.

A preocupação dos meteorologistas é com os meses até a próxima quadra chuvosa.. “A gente tem certeza da chuva no primeiro semestre e certeza de que não chove no segundo semestre”, cita o presidente da Funceme. Historicamente, mais de 90% do volume anual de chuva no Estado acontece no primeiro semestre.

Abaixo do esperado

Também foram as temperaturas elevadas das águas do Pacífico que contribuíram para as poucas precipitações no Estado. Conforme O POVO havia adiantado na edição do último dia 1°, a quadra chuvosa deste ano terminou como a segunda pior desde 2012, quando começou a sequência de cinco anos de estiagem.

Entre fevereiro e maio deste ano, as chuvas ficaram 45,2% abaixo do esperado. Fevereiro foi o período mais crítico, quando o volume no Estado ficou 55,3% abaixo da expectativa. Os meses de março e abril — historicamente de mais chuva — também tiveram precipitações inferiores à média.

As regiões Jaguaribana e do Sertão dos Inhamuns foram as de maior escassez. Nos municípios, as chuvas sequer atingiram metade do esperado, ficando 54,5% e 52,3% abaixo da média, respectivamente.

Segundo o presidente da Funceme, desde o início do ano, o Estado trabalha com o cenário da seca e promove ações para garantir licitações de poços e adutoras emergenciais na tentativa de suprir a necessidade hídrica do Interior.

Saiba mais 

Uma das alternativas para amenizar a escassez hídrica, o Projeto de Integração do rio São Francisco será concluído em dezembro, com previsão de abastecer os reservatórios em janeiro do próximo ano.

No último fim de semana, comitiva do Ministério da Integração vistoriou os eixos Norte e Leste do Projeto. Além do Ceará, Pernambuco e Paraíba devem ser beneficiados a partir de 2017.

Mudanças climáticas podem levar à exclusão de espécies arbóreas em áreas úmidas (INPA)

JC 5423, 24 de maio de 2016

Alterações na composição de espécies vegetais poderão trazer implicações para toda a cadeia alimentar, incluindo o homem

Cheias e secas extremas e subsequentes, como essas que os rios da Amazônia vêm sofrendo nas duas últimas décadas, podem levar à exclusão de espécies de árvores e à colonização por outras espécies menos tolerantes à inundação.

É o que apontam estudos desenvolvidos por pesquisadores associados ao Grupo Ecologia, Monitoramento e Uso Sustentável de Áreas Úmidas (Maua) do Instituto Nacional de Pesquisas da Amazônia (Inpa/MCTI), em Manaus, que participa, desde 2013, do Programa de Pesquisas Ecológicas de Longa Duração (Peld), por meio do Peld-Maua.

Durante a década de 1970, por exemplo, os níveis máximos anuais do rio Negro ficaram alguns metros acima do valor médio da enchente, e a descida das águas não foi intensa, resultando na inundação de várias populações de plantas durante anos consecutivos. Isso causou a exclusão de muitas espécies arbustivas e arbóreas nas baixas topografias de igapós na região da Amazônia Central, como é o caso de macacarecuia (Eschweilera tenuifolia).

“Acredita-se que esses fenômenos podem ser consequência das mudanças climáticas em curso, mas podem também derivar de variações naturais do ciclo hidrológico. Os estudos realizados no âmbito do Peld-Maua visam confirmar a origem desses fenômenos utilizando informações sobre o crescimento da vegetação”, adianta a coordenadora do Peld-Maua, a pesquisadora do Inpa Maria Teresa Fernandez Piedade.

Anos de secas ou cheias consecutivas podem ultrapassar a capacidade adaptativa das espécies de árvores, especialmente de populações estabelecidas nos extremos do ótimo de distribuição no gradiente inundável (composição de diferentes níveis de inundação a que estão sujeitas as áreas alagáveis).

Segundo Piedade, como a vegetação sustenta a fauna desses ambientes, mudanças na composição de espécies vegetais poderão trazer implicações para toda a cadeia alimentar, incluindo o homem. “A vegetação arbórea das áreas alagáveis amazônicas é bem adaptada à dinâmica anual de cheias e vazantes”, destaca a pesquisadora.

Para ela, determinar o grau de tolerância a períodos extremos das espécies de árvores desses ambientes e de sua fauna associada, como os peixes e roedores, e conhecer sua reação com a dinâmica de alternância entre fases inundadas e não inundadas normais e extremas é um grande desafio e se constitui na base para seu uso sustentável e preservação.

Segundo Piedade, as áreas úmidas (várzeas, igapós, buritizais e outros tipos) cobrem cerca de 30% da região amazônica e são de fundamental importância ecológica e econômica. Ela explica que na várzea, múltiplas atividades econômicas são tradicionalmente desenvolvidas, como a pesca e a agricultura familiar, enquanto que nos igapós, por serem mais pobres em nutrientes e em espécies de plantas e animais, menos atividades econômicas são praticadas. Já nas campinas/campinaranas alagáveis essas atividades são ainda mais reduzidas.

“A ecologia, o funcionamento e as limitações para determinadas práticas econômicas nas várzeas são bastante conhecidas, mas nos igapós de água pretas e nas campinas/campinaranas alagáveis tais aspectos ainda são pouco estudados”, diz Piedade. “Embora se saiba que esses ambientes são frágeis, aumentar e disponibilizar informações sobre eles é fundamental”, acrescenta.

Peld-Mauá

Com o título “Monitoramento e modelagem de dois grandes ecossistemas de áreas úmidas amazônicas em cenários de mudanças climáticas”, o Peld-Maua é um projeto financiado pelo Conselho Nacional de Desenvolvimento Científico e Tecnológico (CNPq), e também conta com recursos da Fundação de Amparo à Pesquisa do Estado do Amazonas (Fapeam). Insere-se no plano de ação “Ciência, Tecnologia e Inovação para Natureza e Clima”, do MCTI.

O Programa Peld foca no estabelecimento de sítios de pesquisa permanentes em diversos ecossistemas do País, integrados em redes para o desenvolvimento e o acompanhamento de pesquisas ecológicas de longa duração. Atualmente, existem 31 sítios de pesquisa vigentes.

O Peld-Maua é gerenciado pelo Inpa, em Manaus. Tem como vice-coordenador o pesquisador do Inpa, Jochen Schöngart; e como coordenador do Banco de Dados o pesquisador Florian Wittmann, do Departamento de Biogeoquímica do Instituto Max-Planck de Química, com sede em Mainz, na Alemanha.

A coordenadora do Peld-Maua explica que as atividades tiveram início há três anos. “Na primeira fase, que será completada agora em 2016, o Peld-Maua priorizou estudos em um ambiente de igapó e outro de campinarana alagável, mas espera-se que os estudos tenham continuidade e sejam expandidos para outras tipologias alagáveis amazônicas”, diz Piedade.

O Peld-Maua desenvolve estudos nas áreas de inundação das florestas de igapó no Parque Nacional do Jaú (Parna Jaú) – Unidade de Conservação localizada entre os municípios de Novo Airão e Barcelos, no Amazonas –, e ao longo dos gradientes de profundidade do lençol freático das florestas de campinas/campinaranas na Reserva de Desenvolvimento Sustentável (RDS) do Uatumã, situada entre os municípios de São Sebastião do Uatumã e Itapiranga, também no Amazonas.

Conforme Piedade, diante da conectividade entre os ambientes alagáveis e as formações contíguas de terra-firme ou outras, os sítios de estudos foram escolhidos em ambientes onde os gradientes podem ser também avaliados. “Isso aumenta as possibilidades de trabalhos comparativos”, ressalta.

O Peld-Maua tem por objetivo relacionar a estrutura, composição florística e dinâmica de plantas que produzem sementes (fanerógamas) de dois ecossistemas de áreas úmidas na Amazônia Central com fatores do solo e da disponibilidade de água (hidro-edáficos), por meio do monitoramento em longo prazo para entender possíveis impactos e respostas da vegetação frente a mudanças dos regimes pluviométricos e hidrológicos.

O programa, até o momento, já permitiu a realização de cinco dissertações de mestrado e uma tese de doutorado. Além dos estudos já finalizados, estão em andamento dois pós-doutorados, seis doutorados e quatro mestrados. Quanto à formação de pessoal, dois bolsistas do Programa de Capacitação Institucional (PCI) concluíram suas atividades e dois estão realizando seus projetos, e dois bolsistas do programa de Bolsa de Fomento ao Desenvolvimento Tecnológico (DTI) e dois Pibic’s realizaram seus projetos junto ao Peld-Maua.

Inpa

Weasel Apparently Shuts Down World’s Most Powerful Particle Collider (NPR)

April 29, 201611:04 AM ET

GEOFF BRUMFIEL

The Large Hadron Collider uses superconducting magnets to smash sub-atomic particles together at enormous energies.

The Large Hadron Collider uses superconducting magnets to smash sub-atomic particles together at enormous energies. CERN

A small mammal has sabotaged the world’s most powerful scientific instrument.

The Large Hadron Collider, a 17-mile superconducting machine designed to smash protons together at close to the speed of light, went offline overnight. Engineers investigating the mishap found the charred remains of a furry creature near a gnawed-through power cable.

A small mammal, possibly a weasel, gnawed-through a power cable at the Large Hadron Collider.A small mammal, possibly a weasel, gnawed-through a power cable at the Large Hadron Collider. Ashley Buttle/Flickr

“We had electrical problems, and we are pretty sure this was caused by a small animal,” says Arnaud Marsollier, head of press for CERN, the organization that runs the $7 billion particle collider in Switzerland. Although they had not conducted a thorough analysis of the remains, Marsollier says they believe the creature was “a weasel, probably.” (Update: An official briefing document from CERN indicates the creature may have been a marten.)

The shutdown comes as the LHC was preparing to collect new data on the Higgs Boson, a fundamental particle it discovered in 2012. The Higgs is believed to endow other particles with mass, and it is considered to be a cornerstone of the modern theory of particle physics.

Researchers have seen some hints in recent data that other, yet-undiscovered particles might also be generated inside the LHC. If those other particles exist, they could revolutionize researcher’s understanding of everything from the laws of gravity, to quantum mechanics.

Unfortunately, Marsollier says, scientists will have to wait while workers bring the machine back online. Repairs will take a few days, but getting the machine fully ready to smash might take another week or two. “It may be mid-May,” he says.

These sorts of mishaps are not unheard of, says Marsollier. The LHC is located outside of Geneva. “We are in the countryside, and of course we have wild animals everywhere.” There have been previous incidents, including one in 2009, when a bird is believed to have dropped a baguette onto critical electrical systems.

Nor are the problems exclusive to the LHC: In 2006, raccoons conducted a “coordinated” attack on a particle accelerator in Illinois.

It is unclear whether the animals are trying to stop humanity from unlocking the secrets of the universe.

Of course, small mammals cause problems in all sorts of organizations. Yesterday, a group of children took National Public Radio off the air for over a minute before engineers could restore the broadcast.

Anthropologies #21: Weather changes people: stretching to encompass material sky dynamics in our ethnography (Savage Minds)

See original text here.

September 24, 2015.

This entry is part 10 of 10 in the Anthropologies #21 series.

Heid Jerstad brings our climate change issue to a close with this thoughtful essay. Jerstad (BA Oxford, MRes SOAS) is writing up her PhD on the effects of weather on peoples lives at the university of Edinburgh. Having done fieldwork in the western Indian Himalayas, she is particularly interested in the range of social and livelihood implications that weather (and thus climate change) has. She is on twitter @entanglednotion –R.A.

For most people, the climate change issue is a bundle of scientific ideas, or maybe a chunk of guilt lurking behind that short haul flight. The words have fused together to form a single stone, immobile and heavy. Change is a bit of a nothing word anyway – anything can change, and who is to say if it is good or bad, drastic or practically unnoticeable?

But what about climate? It is a big science-y word, neither human nor particularly tangible. Climate is about a place – engrained, palimpsested, with time-depth. That big sky, those habits – the Frenchman advising wine and bed on a rainy day, the Croatian judge lenient because there was a hot wind from the Sahara that day. This is weather I am talking about, seasons, years, the heat, damp and sparkling frost.

People care about the weather. We consider ourselves used to this or good at observing that. My home has more weather than other places – it is colder in winter, the air is clearer and brighter – because it is mine. My sunsets – this is eastern Norway – are vibrant and fill the sky, my sky will snow in June with not a cloud, my nose can feel that special tingle when it gets to below -20˚c. The north is not gloomy in winter – the snow is bright white, the hydro-fuelled streetlights illuminate empty streets and windows seal the warmth in.

What is your weather? It would be safe to assume it is part of the climate and I would go out on a limb and say I think you care about it. Am I wrong?

When the weather matters to people, the task becomes one of bridging this caring and the climate change science and projections. Looking at the impact of these weather changes in different areas of life is, then, going to make up a steadily larger part of useful climate change research.

Mead famously convened a conference with Kellogg titled ‘The Atmosphere: Endangered and Endangering’ in 1975, and Douglas published Risk and Blame in 1992. In the new millennium Strauss and Orlove (2003), Crate and Nuttall (2009) and Hastrup and Rubow (2014) brought edited volumes to the debate. It seems to be fairly well established, then, that climate change is a matter for anthropologists, as phrased by the AAA statement on climate change: ‘Climate change is rooted in social institutions and cultural habits. … Climate change is not a natural problem, it is a human problem.’ What then, can anthropologists do, about this problem?

Anthropologists provide description. The mapping of people’s stories of how the weather is ‘going wrong’, stories of change, and of coping and consequences is underway (Crate 2008 described the effects of unusual winter melt on the Vilui Sakha in Siberia, Cruikshank 2005 explored the tendrils of meaning surrounding glaciers between Alaska, British Colombia and the Yukon territory). Linked to the description, of course, and not really disentanglable from it is the explanation. Explanations and understandings of weather and weather changes in the places where they are happening, whether Chesapeake Bay, the Marshall Islands, or Rajasthan, India, fill in the social significance of what had been an empty sky (Paolisso 2003, Rudiak-Gould 2013, Grodzins-Gold 1998). The weather changes, in fact, constitute one of those satisfying areas of inquiry which concern those asked as much as the anthropologist.

The question of knowledge, however, can still seem a barrier when climate scientists are those with a mandate to understand changing weather. Anna Tsing, in the Firth Lecture at the Association of Social Anthropologists of the UK and Commonwealth’s (ASA) 2015 conference in Exeter, brought the contextual ecological study of mushrooms and the trees that they are mutual with in the forests of Japan and China to illustrate the gains anthropology can make when we give up scepticism of natural science. Earlier in the year, Moore, at the launch of the Centre of the Anthropology of Sustainability (CAOS) at University College London used microbial research to break down the bounded image of the body, where on the cellular level culture and biology shape each other – for instance when poor black women in the States eat fish which contains mercury and this affects the biological development of their children. Tsing and Moore brought together what might previously have been considered within the remit of ecology or biology to make important points about the capacity of anthropology—and to suggest where we might go next, expanding vision of social science. When mushrooms and microbes are appropriate topics for anthropological research, then looking at the climate and its material as well as social effects (rotting, drying, illness (Jerstad 2014)) starts to look feasible.

The anthropocene is a term which has been shown to have considerable analytical purchase outside of geology, illuminating moral and political debates about blame, the north-south divide and the global movement of materials, people and plants (Chakrabarty 2014, Tsing 2013). These ideas have been applyied in the study of climate scientists themselves (Simonetti 2015) as well as climate policy (Lahsen 2009). The anthropocene, i.e. the world as subject to the effects of human activities such as climate change, may be read as a set of material relationships, where the weather, bodies and landscapes meet, as Ingold showed (2010). This term allows the larger picture, where the world and all the people in it – those people for whom climate change matters – to be considered in a single conceptual space. In this space climate change can be seen as part of the encompassing extra-somatic human activity which defines our world as we are starting to understand it.

The anthropocene and climate change, however, both involve the challenge of how to follow the conceptual and material threads that lead from these global issues and into particular, ethnographically described lives:

 A close examination of scientific practice makes clear that localizing is as much a problem for climate researchers as it is for ethnographers. This holds not only for the     interconnectedness of the global and the local climate, but also for the separation of climate change as a ‘scientific fact’ on the one hand, and a ‘matter of concern’ on the other. Climate research offers an insight into a messy world of ramifications, surprising activities and unexpected “social” context (Krauss 2009:149–50).

Anthropological work has the reflexive capacity to deal with the messy world Krauss refers to here, where these ramifications, surprising activities and unexpected ‘social’ context are part of the particular places where we, as anthropologists, work, taking cues from events and observations around us. In my own fieldwork I found all kinds of unanticipated connections between weathers and other aspects of life. With a research proposal full of religion and ‘belief’ I ended up with far more material interests, guided by the sometimes patient and sometimes exasperated villagers with whom I lived in the western Indian Himalayas.

I was walking with Karishma to get green grass one day during the monsoon. She told me that our village (Gau) is famous for being misty, and therefore that the girls are known, both for working hard and for being beautiful, because even though they are outside the mistiness keeps them pale. So apparently on festival days people say that the girls from this village are gori (white) because there is so much mist here. But Karishma pointed out that this can’t be true because there is mist only in the rainy season. Then she said that the girls here wear sweaters to stay gori. Also, she said girls of this village have a reputation for being hard working so people ask for them in marriage when there is a household where work is to be done. This (I think) might be part of why quite a few of the new brides in Gau are not used to doing as much work as women do here. But then Karishma said fairly that it is not just the girls who work hard, everyone works hard in this village (well, most people). She said that when girls go away to study, like she did, then they come back more beautiful. That is to say pale from not being outside. She was saying how on the other hand I had become more black (kala) since being there in the village (this was true).

People, whether Himalayan villagers or Norwegian PhD students, live with weather on an ongoing basis, and consistently live in the weather, which is not always catastrophic but does always impinge (think food perishability, wardrobe choices, sitting in the shade). The considerations people have with regards to the weather, then, necessarily translate to potential climate change concerns. Climate change is a threat, it has potentially deadly dimensions, but weather is inherent to our world, and I would not want to pathologize it.

Weather relates in fundamental ways to sensation and the body, thermal infrastructure, agriculture and animal husbandry, health and illness, disasters and other areas of anthropology (that is to say life). Weather may be implicated in all kinds of ways with other areas of life – for instance the hot/cold symbolism in India which classifies illness, the body, food and even moods. I think that it can be surprisingly easy to forget or ignore weather precisely because it is so pervasive. And this resistance of the mind against focusing on it is a risk when it comes to climate change. It can be tiring to think about. How, after all, do you write about the wind? And people have (Parkin 1995, James 1972, Hsu and Low 2007), but personally I find it challenging just to make a start – capturing the sky with a few black marks on paper feels so unrealistic. In that sense it is a great stretching area for our minds, about the material and the social, about what we mean with words like ‘impact’ and ‘atmosphere’ and the connections between people and places.

Finally there is the role of anthropology in clarifying the terms of the climate change debate. This is a new kind of challenge, it is a global one (hence the usefulness of Tsing’s work, who demonstrated the crucial part material relationships and meetings play in globalisation (2005)), it is to do with both technologies and nature (we can apply Latour, who shows in ‘we have never been modern’ (1993) how ‘modernity’ has not succeeded in cutting us off from the material and natural world around us), it is political, historical (hence Chakrabarty, whose work pushes us to think in new ways about how we are positioned in history and what place climate change has in this context), and there is something about it which is pushing at the edges in all these areas and others, in which new terms are required to even conceive of some of these problematics. Building on what we understand and moving further, in ways that might tread new neural pathways and enable new realities, simply from the newness of our thinking, feels like a worthwhile undertaking. I suggest that the orientation of research which maps out the weather-weight of social life can help bring the people back into climate change.

So the immovable stone of ‘climate change’ is being loosened up, pulled apart to reassemble in illuminating and constructive ways by people contributing to blow away the fog obstructing understanding, using the culminations of what we know so far and the ways in which we can think new thoughts. This effort rewards.

References

AAA statement on climate change. 29th January 2015. http://www.aaanet.org/cmtes/commissions/CCTF/upload/AAA-Statement-on-Humanity-and-Climate-Change.pdf Accessed 1st July 2015.

Chakrabarty, Dipesh 2014. Climate and Capital: On Conjoined Histories. Critical Inquiry 41(1):1-23.

Crate, Susan. 2008. Gone the Bull of Winter? Grappling with the Cultural Implications of and Anthropology’s Role(s) in Global Climate Change. Current Anthropology 49:569-595.

Crate, Susan and Mark Nuttall, eds. 2009. Anthropology and Climate Change: from Encounters to Actions. California: Left Coast Press.

Cruikshank, Julie. 2005. Do Glaciers Listen? Local Knowledge, Colonial Encounters, and Social Imagination. Toronto: University of British Columbia Press.

Douglas, Mary. 1992. Risk and Blame. London: Routledge

Grodzins-Gold, Ann. 1998. Sin and Rain: Moral Ecology in Rural North India. In Lance Nelson ed. Purifying the Earthly Body of God. New York: State University of New York Press.

Hsu, Elizabeth and Chris Low eds. 2007: Wind, Life, Health: Anthropological and Historical Perspectives. Special issue. Journal of the Royal Anthropological Institute 13:S1-S181.

Ingold, T. (2010), Footprints through the weather-world: walking, breathing, knowing. Journal of the Royal Anthropological Institute, 16: S121–S139.

James, Wendy. 1972. The politics of rain control among the Uduk. In Ian Cunnison and Wendy James eds. Essays on Sudan ethnography presented to Sir Edward Evans-Pritchard. London: C. Hurst.

Jerstad, Heid. 2014. Damp bodies and smoky firewood: material weather and livelihood in rural Himachal Pradesh. Forum for development studies 41(3):399-414.

Krauss, Werner. 2009. Localizing Climate Change: A Multi-sited Approach. In Marc-Anthony Falzon and Clair Hall eds. Multi-Sited. Ethnography. Theory, Praxis and Locality in Contemporary Research 149-165. Ashgate.

Lahsen, Myanna. 2009. A science-policy interface in the Global South: The politics of carbon sinks and science in Brazil. Climatic Change 97:339–372.

Paolisso, Michael. 2003. Chesapeake Bay watermen, weather and blue crabs: cultural models and fishery policies. In Sarah Strauss and Benjamin Orlove eds. Weather, Climate, Culture. Oxford: Berg.

Rudiak-Gould, Peter. 2013. Climate change and tradition in a small island state: the rising tide. Routledge.

Simonetti, Christian. 2015. The stratification of time. Time and Society .

Strauss, Sarah and Orlove, Benjamin eds. 2003. Weather, climate, culture. Oxford: Berg

Tsing, Anna. 2013. Dancing the Mushroom Forest. PAN: Philosophy, Activism, Nature vol 10.

Tsing, Anna. 2005. Friction. Princeton University Press.

Brasil e mais 169 países assinam acordo sobre mudança climática (Estadão)

Cláudia Trevisan e Altamira Silva Junior – 22 de abril de 201

Dilma: 'O caminho que teremos de percorrer agora será ainda mais desafiador: transformar nossas ambiciosas aspirações em resultados concretos'

Dilma: ‘O caminho que teremos de percorrer agora será ainda mais desafiador: transformar nossas ambiciosas aspirações em resultados concretos’

Representantes de 170 países assinaram nesta sexta-feira, 22, o Acordo de Paris sobre mudança climática, batendo o recorde da história da Organização das Nações Unidas (ONU) de adesão a um tratado internacional em um único dia. Mas todos ouviram o alerta do secretário-geral da entidade, Ban Ki-Moon, de que as boas intenções terão pouco impacto se a convenção não for ratificada pelos países o mais breve possível. Sem isso, o tratado não entrará em vigor.

“Estamos em uma corrida contra o tempo”, disse Ban no discurso de abertura da cerimônia, no plenário da ONU em Nova York. A urgência foi enfatizada por vários chefes de Estado, incluindo os presidentes do Brasil, Dilma Rousseff, e da França, François Hollande.

Dilma assegurou “a pronta entrada em vigor” da convenção, mas essa decisão depende do Congresso. “O caminho que teremos de percorrer agora será ainda mais desafiador: transformar nossas ambiciosas aspirações em resultados concretos”, disse a presidente em seu discurso. E repetiu os compromissos assumidos pelo Brasil durante a negociação do tratado, entre os quais a promessa de reduzir em 37% a emissão de gases poluentes até 2025, na comparação com os patamares registrados em 2005.

Frustração. Carlos Rittl, secretário executivo do Observatório do Clima, disse que Dilma frustrou as expectativas de entidades ambientais que esperavam uma sinalização clara de que o Brasil assumirá metas mais ambiciosas em 2018, quando haverá uma avaliação dos resultados do acordo. “O Brasil precisa reconhecer que deve fazer mais que o prometido no ano passado”, disse. “Todos devem, porque estamos na trajetória de 3ºC de aquecimento.”

Aprovado por representantes de 195 nações em dezembro, o tratado prevê uma série de compromissos nacionais com o objetivo de limitar o aumento da temperatura do planeta a 2ºC até o fim do século, em relação ao patamar anterior ao período industrial. Para que entre em vigor, o Acordo de Paris precisa ser ratificado por pelo menos 55 países que representem ao menos 55% das emissões de gases do efeito estufa.

“A era do consumo sem consequências chegou ao fim. Nós temos de intensificar os esforços para ‘descarbonizar’ nossas economias”, ressaltou o secretário-geral das Nações Unidas. Além do caráter simbólico, a cerimônia desta sexta tinha o objetivo de mobilizar os líderes mundiais em torno da ratificação do acordo, de forma que entre em vigor no próximo ano e não em 2020, como inicialmente previsto.

Primeiro a discursar, o presidente da França lembrou que Paris vivia uma situação trágica em dezembro, sob o impacto dos atentados terroristas que haviam provocado a morte de 130 pessoas no mês anterior. Ainda assim, ressaltou, foi possível fechar o acordo histórico sobre mudança climática.

Impactos visíveis no mar (Pesquisa Fapesp)

Poluentes chegam a 200 km ao norte e ao sul da foz do rio Doce, atingem unidades de conservação, alteram equilíbrio ecológico e se acumulam no assoalho marinho

CARLOS FIORAVANTI | ED. 242 | ABRIL 2016

Poluição à vista: os resíduos que vazaram do reservatório de Mariana formam mancha acastanhada na foz do rio DocePoluição à vista: os resíduos que vazaram do reservatório de Mariana formam mancha acastanhada na foz do rio Doce.

Em janeiro deste ano, ao sobrevoarem o litoral do Espírito Santo e do sul da Bahia, biólogos, oceanógrafos e técnicos de órgãos ambientais do governo federal reconheceram os borrões escuros na superfície do mar formados pelo acúmulo de resíduos metálicos que vazaram do reservatório da mineradora Samarco em Mariana, Minas Gerais, em novembro de 2015. A mancha de resíduos, também chamada de pluma, aproximava-se do arquipélago de Abrolhos, uma das principais reservas de vida silvestre marinha da costa brasileira.

Os borrões não eram apenas os indesejados resquícios da extração de minério de ferro de Minas Gerais, mas uma de suas consequências, como se verificou logo depois. Em meio às manchas verde-escuro havia colônias de algas e outros organismos marinhos microscópicos – o fitoplâncton – com dezenas de quilômetros de extensão, muito maiores que as observadas nos anos anteriores, de acordo com as análises de pesquisadores da Universidade Federal do Espírito Santo (Ufes).

Outra peculiaridade é que os organismos cresciam e se multiplicavam rapidamente, em decorrência do excesso de ferro dos rejeitos da mineradora de Mariana que se espalham pelo mar a partir da foz do rio Doce, onde chegaram no final de novembro. Desde então, levados continuamente ao mar pelo rio, os resíduos formam uma mancha móvel que oscila ao longo de 200 quilômetros (km) ao norte e ao sul da foz do rio Doce, que alterou o equilíbrio marinho, como indicado pela massa de fitoplâncton, e atingiu pelo menos três unidades de conservação de organismos marinhos.

“As manchas de fitoplâncton são comuns no verão, mas não desse modo”, explica Alex Bastos, professor de oceanografia da Ufes, no final de fevereiro. Análises preliminares indicaram que as colônias de algas são constituídas por organismos que se formam e morrem em poucos dias, mais rapidamente que o habitual. A decomposição acelerada dos organismos consome oxigênio da água do mar, com consequências imprevisíveis sobre as comunidades de organismos marinhos.

Além disso, a diversidade de espécies havia sido reduzida quase à metade. Camilo Dias Júnior, com sua equipe de oceanografia da Ufes, encontrou no máximo 40 espécies de fitoplâncton por amostra analisada; antes da chegada dos resíduos os pesquisadores reconheciam de 50 a 70 espécies. A hipótese dos pesquisadores e técnicos é de que já poderia ter ocorrido uma seleção de variedades mais adaptadas ao excesso de ferro trazido com a descarga dos resíduos no mar.

Nos sobrevoos do litoral do Espírito Santo e da Bahia, Claudio Dupas, coordenador do Núcleo de Geoprocessamento e Monitoramento Ambiental da Superintendência do Instituto Brasileiro do Meio Ambiente e dos Recursos Naturais Renováveis (Ibama) em São Paulo, observou muitos barcos de pesca próximos às manchas de fitoplâncton na foz do rio Doce. Atraídos pela abundância de alimento, o grande número de peixes chamou a atenção dos pescadores.

Em Governador Valadares, MG: a lama ocupou o rio Doce em novembro, prejudicando o abastecimento de água para os moradores da cidade

Com base nas análises preliminares da qualidade de água e na observação do cenário, a equipe do Ibama elaborou um relatório técnico alertando sobre alterações na qualidade da água, prejudicada com a descarga de resíduos no mar. Com base no documento e no princípio da precaução – para evitar que a população seja prejudicada pelo consumo de peixes contaminados –, no dia 22 de fevereiro um juiz federal de Vitória proibiu por tempo indeterminado a pesca na região da foz do rio Doce. “Assim que saiu a decisão do juiz, o superintendente do Ibama em Vitória, Guanadir Gonçalves, pediu-me para fazer um mapa com a delimitação da área de proibição, que foi para a internet e para os celulares dos fiscais em campo no mesmo dia”, diz Dupas.

Desde janeiro os movimentos da mancha de resíduos podem ser acompanhados por meio de mapas gerados pelo Ibama a partir de imagens de satélites no site governancapelodoce.com.br, mantido pela Samarco. Já o site siscom.ibama.gov.br/mariana contém imagens de satélite de alta resolução de antes e depois do incidente, da barragem à foz. Os mapas indicam que os resíduos já chegaram a 50 km ao sul de Vitória, capital do Espírito Santo, e atingiram três unidades de conservação do ambiente marinho, o Refúgio de Vida Silvestre de Santa Cruz, a Área de Proteção Ambiental (APA) Costa das Algas e uma das principais áreas de desova da tartaruga-cabeçuda (Caretta caretta), uma faixa de 37 km de praias conhecida como Reserva Biológica Comboios. “Ainda não é possível avaliar o impacto sobre o ambiente, a vida dos organismos marinhos e dos moradores da região”, diz Dupas.

Desde que vazou da barragem de Fundão, em 5 de novembro, até chegar ao mar, a enorme massa de resíduos da extração de minério de ferro causou uma transformação profunda. Destruiu casas e matas às margens do rio Doce, provocando a morte de 18 pessoas e de toneladas de peixes e outros organismos aquáticos. A bióloga Flávia Bottino participou das expedições do Grupo Independente para Análise do Impacto Ambiental (Giaia) ao longo do rio Doce em novembro e observou uma intensa turbidez da água, que dificultava a penetração da luz e a sobrevivência dos organismos. Os biólogos encontraram camarões de água doce que sobreviveram ao desastre, mas os organismos bentônicos, que viviam no fundo do rio, tinham sido soterrados.

Limites incertos 
A alta concentração de partículas sólidas que absorvem calor pode ter causado o aumento da temperatura da água para cerca de 30º Celsius. “A água do rio estava quente”, ela notou. As análises das amostras de água coletadas em dezembro ao longo de um trecho de cerca de 800 km do rio, realizadas nas unidades das universidades de São Paulo (USP) em Ribeirão Preto, Federal de São Carlos (UFSCar) em São Carlos e Sorocaba, Estadual Paulista (Unesp) em São Vicente, e na de Brasília (UnB), indicaram concentrações elevadas de manganês, ferro, arsênio e chumbo. As chuvas podem agravar a situação ao lavar as margens dos rios, cobertas de resíduos, e transportá-los ao mar.

Por meio de coletas realizadas com o navio Vital de Oliveira Moura, da Marinha, a equipe da Ufes verificou que 25 km a leste da foz do Rio Doce os resíduos formam uma camada de 1 a 2 centímetros sobre a lama do fundo do mar, a 25 metros de profundidade. “Está havendo um acúmulo rápido do rejeito no assoalho marinho”, diz Bastos, da Ufes, com base em coletas realizadas desde novembro, logo após o rompimento da barragem (ver Pesquisa FAPESP no 239). “Nem nas maiores cheias o acúmulo de sedimentos no rio no fundo do mar foi tão alto.”

042-047_Poluentes_242No início de fevereiro, em uma reunião dos pesquisadores da Ufes com representantes do Ibama, Instituto Estadual do Meio Ambiente (Iema) e Instituto Chico Mendes de Conservação da Biodiversidade (ICMBio), Bastos comentou que a concentração de ferro no fundo do mar havia aumentado 20 vezes, em comparação com os níveis de antes do acidente, a de alumínio 10 vezes e a de cromo e manganês, cinco. Outro professor da Ufes, Renato Rodrigues Neto, observou que a vazão do rio passou de 300 metros cúbicos por segundo (m³/s), antes do rompimento da barragem, para cerca de 4.000 m³/s, aumentando a quantidade de lama com resíduos metálicos despejada no mar.

As imagens de satélite indicam que os resíduos metálicos podem ter chegado até o arquipélago de Abrolhos no início de janeiro, embora, ressalta Dupas, ainda não seja possível diferenciar os sedimentos vindos do rio Doce, a cerca de 200 km de distância, dos do rio Caravelas, que deságua na região. Segundo ele, os resultados das análises em andamento devem ser anunciados em abril.

Vários estudos em outras áreas marinhas têm indicado que os resíduos industriais podem ir muito além dos lugares onde foram produzidos, misturar-se com os sedimentos do fundo do mar, aflorando se revolvidos por redes de pesca, ou ser absorvidos por organismos marinhos. Uma equipe do Instituto Oceanográfico (IO) da USP identificou metais pesados (chumbo, cobre e zinco) e compostos orgânicos derivados de petróleo produzidos na zona industrial de Santos e do polo industrial de Cubatão, a 15 km do mar, misturados com a lama do assoalho marinho a uma profundidade de 100 metros e a uma distância de 200 km da costa. Não se pensava que a poluição gerada em terra pudesse chegar tão longe.

Condições ambientais 
As conclusões ajudam a pensar o que poderia se passar no litoral do Espírito Santo e dos estados vizinhos, à medida que a lama da mineradora se espalha. “Os eventos, a rigor, não têm conexão à primeira vista”, disse Michel Mahiques, professor de oceanografia do IO-USP que coordenou os estudos em Santos. O vazamento da Samarco em Mariana foi um fenômeno agudo, com uma descarga intensa de resíduos, enquanto Santos e outros, como a baía da Guanabara, são casos crônicos, de décadas de liberação contínua de poluentes. “O fato comum”, ele diz, “é que existem porções do fundo marinho nas quais as condições ambientais permitem a deposição de materiais gerados pela atividade humana, ainda que a grandes distâncias”.

Em um estudo anterior no litoral de Santos, seu grupo identificou isótopos de césio 137 originários de explosões atômicas ou de usinas nucleares, nas quais esse tipo de material é gerado. “O césio foi transportado pela atmosfera e aderiu a partículas muito pequenas do fundo do mar”, conta. “Podemos chamar esses casos de teleconexões, em que um evento em um determinado ponto do planeta pode afetar regiões muito distantes.” Segundo ele, os casos clássicos são os acidentes das usinas nucleares de Chernobyl em 1986 e de Fukushima em 2011.

Vila de Mariana devastada pela lama da barragem de Fundão: efeito a mais de 800 km de distância na terra, no rio e no mar

“Precisamos lançar outro olhar para o potencial de acumulação de material no meio marinho”, comenta Mahiques. Seus estudos indicaram que os poluentes se acumulam principalmente nos cinturões de lama, faixas em geral com 3 a 4 km de largura e dezenas de quilômetros de extensão, na chamada plataforma continental, sobre estruturas antigas de relevo. “Há um efeito a distância. Os sedimentos permanecem em pontos bem distantes da origem. Duzentos quilômetros foi o limite a que chegamos, mas ainda não sabemos se poderiam ir mais longe.” Mahiques argumenta que dois conceitos básicos sobre o funcionamento da plataforma continental deveriam ser revistos. O primeiro é que a quantidade de materiais do continente que chega ao mar seria pequena. O segundo é que os ambientes costeiros retêm a sujeira. “A quantidade não é pequena, nem os estuários são um filtro perfeito dos resíduos gerados no continente.”

Os pesquisadores analisaram 21 amostras de sedimentos coletadas em 2005 e outras, mais recentes, reunidas por meio do navio oceanográfico Alpha Crucis. Os resultados indicaram que os níveis de chumbo, zinco e cobre a 100 metros de profundidade a mais de 100 km da costa eram próximos aos encontrados na baía de Santos, embora mais baixos que os limites mais altos do estuário santista, um ambiente próximo à terra que mistura água de rios e do mar. No estuário, a concentração de chumbo no sedimento marinho variava de 9 miligramas por quilograma (mg/kg) em áreas não contaminadas a 59 mg/kg em amostras do fundo do porto, indicando um aumento de cinco a 10 vezes em comparação com os valores anteriores ao processo de industrialização. Os autores desse trabalho afirmaram que os poluentes industriais misturados com a lama no fundo do mar poderiam facilmente voltar à circulação, como resultado de movimentos intensos da água ou de atividade humana como a dragagem para a ampliação de portos ou a pesca com redes pesadas que revolvem o fundo do mar.

Estudos anteriores de pesquisadores do IO-USP já haviam mostrado que a descarga contínua de esgotos domésticos e de poluentes industriais na baía de Santos era provavelmente uma das causas da reduzida diversidade de organismos marinhos na região, em comparação com áreas menos poluídas.

Em paralelo, uma equipe da Unesp em São Vicente encontrou níveis acima dos permitidos em lei de quatro metais pesados – cádmio, cobre, chumbo e mercúrio – em amostras de água, sedimento e em caranguejos-uçá dos manguezais dos municípios de Cubatão, Bertioga, Iguape, São Vicente e Cananeia. Nas regiões com maior concentração desses metais, os caranguejos apresentavam uma proporção maior de células com alterações genéticas associadas à ocorrência de malformações (verPesquisa FAPESP no 225). Estudo de uma equipe da Universidade Federal do Rio Grande publicado em novembro de 2015 associou a contaminação por metal como possível causa da fibropapilomatose, uma doença específica de tartarugas marinhas, caracterizada pela formação de tumores benignos sobre a pele, em tartarugas-verde (Chelonia mydas) de Ubatuba, SP, já que os animais examinados apresentavam um nível acima do normal de cobre, ferro e chumbo, em comparação com animais saudáveis.

“Quando pensarmos em legislação e políticas públicas, para fazer uma projeção do impacto de eventuais acidentes ambientais, temos de olhar mais longe e rever o conceito de área de influência, já que o efeito pode ser muito maior do que o imaginado”, disse Mahiques. Bastos, da Ufes, observou que os danos ambientais podem ser intensos em consequência de pequenas alterações na concentração de metais na água do mar, mesmo que os limites ainda estejam abaixo dos máximos estabelecidos pela legislação ambiental.

Artigos científicos
FIGUEIRA, R.C.L. et alDistribution of 137Cs, 238Pu and 239 + 240Pu in sediments of the southeastern Brazilian shelf – SW Atlantic marginScience of the Total Environment. v. 357, p. 146-59. 2006.
MAHIQUES, M.M. et alMud depocentres on the continental shelf: a neglected sink for anthropogenic contaminants from the coastal zone. EnvironmentalEarth Sciences. v. 75, n. 1, p. 44-55. 2016.
SILVA, C.C. da et alMetal contamination as a possible etiology of fibropapillomatosis in juvenile female green sea turtles Chelonia mydas from the southern Atlantic OceanAquatic Toxicology. v. 170, p. 42-51. 2016.

By 2050 Asia at high risk of severe water shortages: MIT study (Reuters)

Thu Apr 14, 2016 11:30am EDT

CAMBRIDGE, MASS 

A new study points to the risk that China and India will be facing severe water shortages due to a perfect storm of economic growth, climate change, and demands of fast growing populations by mid century. 

Within 35 years, the countries where roughly half the world’s population lives may be facing what scientists are calling a “high risk of severe water stress”. That translates into billions of people having access to a lot less water than they do today, according to a new study from MIT.

“There is about a one in three chance that if we take no action to mitigate climate or to do anything to curtail any of the factors that go into this water stress metric, there is a one in three chance that you will reach this unsustainable situation by the middle of the century,” said Adam Schlosser, a senior research scientist who co-authored the paper published in the journal PLOS ONE.

“It’s very important to show that all things being equal, all things not changing, if we continue with what we are doing now we are running along a very dangerous pathway,” he added.

The scientists simulated hundreds of scenarios looking into the future and found that on average, the water basins that feed economic growth in China and India will have less water than they do today. At the same time, they say pressure on water resources will continue to grow as populations increase, creating an unsustainable scenario where supply loses out to demand.

“We are looking at a region where nations are really at a very rapid developing stage or they are at the precipice of a very rapid development stage and so you really can’t ignore the growth effect, you just can’t, particularly when it comes to resources,” said Schlosser.

But overshadowing everything else, they say, is climate change. While some models show that the effects of climate change could potentially benefit water resources in Asia, the majority point in the opposite direction.

Schlosser and his colleagues believe it will only exacerbate an already gloomy outlook for the future.

Regulators Warn 5 Top Banks They Are Still Too Big to Fail (New York Times)

‘LIVING WILLS’ AT A GLANCE

The Fed and the F.D.I.C. found that the plans of five banks were “not credible.”

  • Failed

  • JPMorgan Chase
  • Bank of America
  • Wells Fargo
  • Bank of New York Mellon
  • State Street
  • Mostly Satisfied

  • Citigroup
  • Split Decision

  • Goldman Sachs
  • Morgan Stanley

The five banks that received rejections have until Oct. 1 to fix their plans.

After those adjustments, if the Fed and the F.D.I.C. are still dissatisfied with the living wills, they may impose restrictions on the banks’ activities or require the banks to raise their capital levels, which in practice means using less borrowed money to finance their business.

And if, after two years, the regulators still find the plans deficient, they may require the banks to sell assets and businesses, with the aim of making them less complex and simpler to unwind in a bankruptcy.

Also on Wednesday, JPMorgan announced a decline in both profit and revenue for the first quarter. Other large banks will report quarterly results this week.

“Obviously we were disappointed,” Marianne Lake, chief financial officer of JPMorgan, said on Wednesday morning.

The results are a particular blow for JPMorgan because it often boasts about the strength of its operations and its ability to weather any crisis. Just last week, Jamie Dimon, the chief executive, bragged in his annual letterthat the bank “had enough loss-absorbing resources to bear all the losses,” under the Fed’s annual stress-test situations, of the 31 largest banks in the country.

But the Fed and F.D.I.C. said on Wednesday that JPMorgan appeared to be unprepared for a crisis in a number of areas. The regulators said, for instance, that the bank did not have adequate plans to move money from its operations overseas if something went wrong in the markets.

The letter also said that JPMorgan did not have a good plan to wind down its outstanding derivative contracts if other banks stopped trading with it.

Ms. Lake said “there’s going to be significant work to meet the expectations of regulators.” But she also expressed confidence that the bank could do so without significantly changing how it does business.

Investors appeared to agree that the verdicts from regulators did not endanger the banks’ current business models. Shares of all of the big banks rose on Wednesday.

Wells Fargo, which is generally considered the safest of the large banks, was the target of unexpected criticism from the Fed and F.D.I.C.

The agencies criticized Wells Fargo’s governance and legal structure, and faulted it for “material errors,” which, the regulators said, raised questions about whether the bank has a “robust process to ensure quality control and accuracy.”

In a statement, Wells Fargo said it was disappointed and added, “We understand the importance of these findings, and we will address them as we update our plan.”

The banking industry has complained that the process of submitting living wills is complex and hard to complete and it has suggested changes.

“A useful process reform might be to do living wills every two or three years, instead of annually,” said Tony Fratto, a partner at Hamilton Place Strategies, a public relations firm that works with the banks. “The time required for banks to produce them and regulators to react to them is clearly too tight.”

But Martin J. Gruenberg, the chairman of the F.D.I.C., said on Wednesday that regulators were “committed to carrying out the statutory mandate that systemically important financial institutions demonstrate a clear path to an orderly failure under bankruptcy at no cost to taxpayers.”

“Today’s action is a significant step toward achieving that goal,” he added.

The Stark Realities of Baked-In Catastrophes (Collapse of Industrial Civilization)

02 Apr 2016

Joe-Webb-Greetings-From-California

In a civilization gone mad with delusions of grandeur, we’re left with tatters of human sociability held together by rancid mythologies.

Despite human fossil fuel burning recently reported to be “flat”, CO2 levels have been on a tear for the last six months, reaching new worrying levels which have some wondering whether permafrost melt may be contributing to the unusually high spike if no decline happens soon. The giant holes in Siberia serve as an ominous sign. Considering that the current El Niño is contributing only 10% to what we are now seeing, runaway global warming may be accelerating worldwide. But don’t worry, Warren Buffett says climate change is no more of a problem than the Y2K bug and will be profitable through increased premiums and inflation.

Ever dire studies continue to reaffirm worst case scenarios, making clear to anyone paying attention that Earth in the next century will be unrecognizable from its current state. Basic planetary geography and atmospheric conditions will be altered through warming oceans and rising sea levels which are now increasing faster than at any time in the past 2800 years. On average, sea levels were between 50 and 82 feet higher the last time CO2 levels were at 400ppm. Glaciologist Jason Box expects ice melt from the West Antarctic to become the biggest contributor to sea level rise in the coming decades due to a feedback loop not in the climate models. CO2 levels have been increasing around 3ppm per year, a twentyfold increase since pre-industrial times when the highest recorded increase was 0.15 ppm per year. We’ve long since passed the tipping point of melting Arctic summer sea ice; 300-350 ppm of CO2 was the threshold for many parts of the climate. These changes are irreversible on a timescale of human civilizations. Even if all human industrial activity magically ceased today, the footprint man has already left will be felt for eons.

In our warming world, the hydrologic cycle is changing and creating extreme weather; crop-destroying droughts and floods are becoming more frequent. The Jet Stream is transforming into something different, becoming wavier with higher ridges and troughs prone to stagnating in the same region. As global temperatures rise over time, hotter air will be trapped under these layers of high pressure from a mangled Jet Stream, cooking everything to death. Rising winter temperatures are beginning to destroy the “winter chill” needed for many fruit and nut trees to properly blossom and produce maximally. Climate change is also disrupting flower pollination and pushing fish toward North/South poles, robbing poorer countries at Equator of crucial food resources. In a new study, marine scientists are surprised to find a disturbing trend in the increasing numbers of a specific type of phytoplankton, coccolithophores, which have been “typically more abundant during Earth’s warm interglacial and high CO2 periods.”

tumblr_nyyguqJIIG1u6ur2mo1_500

Homo sapiens have only been on the planet for the equivalent of a few seconds in geologic time but have managed to overwhelm and foul up all of earth’s natural processes and interdependencies, leaving a distinct layer in the sedimentary record. There is nothing modern humans do that is truly sustainable. Here are a few glaring examples:

No amount of reafforestation or growing of new trees will ultimately off-set continuing CO2 emissions due to environmental constraints on plant growth and the large amounts of remaining fossil fuel reserves,” Mackey says. “Unfortunately there is no option but to cut fossil fuel emissions deeply as about a third of the CO2 stays in the atmosphere for 2 to 20 millennia.

ambiente-01

Relying on machines for answers to the existential problems of a species run amok with planet-destroying tools and weaponry is rather ironic and tragic. We’re locked-up inside a complexity trap of our own making. The human propensity for tool-building coupled with our discovery of fossil fuels has created a set of living arrangements in which we are now enslaved to those machines and tools. The globalized capitalist economy externalizes its destruction and atrocities, keeping the masses in a state of ignorance and denial. Our corporate overlords are not conscientious citizens, but mindless organizations whose sole purpose is to grow profits no matter the external damage done to society and the environment. Between the economic oil hitmen who ensure that profits flow smoothly and GOP politicians who openly espouse their science illiteracy, a hospitable climate for future humans seems remote. Hopeful delusions have given way to the stark reality of our predicament as scholars like Noam Chomsky who originally started his career fighting for a modicum of social justice have now set the bar at just the chance of human survival. Despite the best efforts of scientists, environmentalists, and activists, the wealthy countries most able to do something won’t “get it” until famine, disease, and war come to their country. All is being left for the almighty ‘free market’ to sort out at the same time that climate change, a conflict multiplier, ramps up.

imageedit_3_7415100861

The sixth mass extinction gathers steam and climate inertia works to catch up to the catastrophic ecological collapse already baked-in. All the while, modern man engages in the spectacle of tribal politics(building walls, exuding military strength, recapturing past glories of their nation) and presidential candidates discuss the size of their penis.

For those who come to understand modern man’s predicament, it can either be the ultimate mind fuck or an epiphany that helps a person appreciate the fragility of life, the urgency of living in the here and now, and the grand cosmic joke of a global, hi-tech civilization that arose from the burning of ancient fossil remains only to have those fumes become a deadly curse, extinguishing any trace of our lofty accomplishments…

The fossil record, Plotnick points out, is much more durable than any human record.

As humanity has evolved, our methods of recording information have become ever more ephemeral,” he said. “Clay tablets last longer than books. And who today can read an 8-inch floppy?” he shrugged. “If we put everything on electronic media, will those records exist in a million years? The fossils will.
– Link

Mudanças climáticas provocarão prejuízo de US$ 2,5 trilhões (O Globo)

05/04/2016, por O Globo

Colheita de cana de açúcar: rombo acontecerá mesmo se os países cumprirem as metas voluntárias apresentadas na conferência climática de Paris, em dezembro de 2015 – Paulo Fridman/Bloomberg/18-9-2014

RIO — As mudanças climáticas podem afetar investimentos equivalentes a US$ 2,5 trilhões da economia mundial até 2100, segundo um estudo publicado ontem na revista “Nature Climate Change”. O prejuízo seria resultado do aumento da temperatura em 2,5 graus Celsius até o fim do século, em relação aos níveis pré-industriais. Esta quantia é equivalente à metade do valor atual das empresas de combustíveis fósseis. Se os termômetros avançarem além de 2 graus Celsius — valor máximo admitido pelos climatologistas —, a economia mundial sofreria um rombo de US$ 1,7 trilhão.

Entre os meios de destruição mais comuns ligados às mudanças climáticas estão o aumento do nível do mar — que afeta principalmente setores da economia atuantes na zona costeira —, além de secas e tempestades, capazes de interromper atividades de diferentes ramos do mercado.

A pesquisa concentrou-se principalmente em investimentos ligados a petróleo, carvão e gás, recursos que serão perdidos se os países insistirem na adoção de combustíveis fósseis, em de vez de optar por energias sustentáveis.

De acordo com o Instituto de Pesquisa Grantham sobre Mudanças Climáticas, que elaborou o estudo, seus cálculos são a primeira estimativa do impacto causado pelo aquecimento global sobre ativos financeiros.

As projeções, realizadas com o uso de modelos matemáticos, foram baseados em um valor estimado de US$ 143,3 trilhões em ativos não bancários globais em 2013, valor determinado por economistas.

Considerando as atuais emissões de gases-estufa, os climatologistas indicam que o planeta está a caminho de um aquecimento global equivalente ou superior a 4 graus Celsius. Se as nações cumprirem as metas que apresentaram na Conferência do Clima em Paris, no fim do ano passado, o aumento da temperatura global chegará a 3 graus Celsius.

As mudanças climáticas devem ser encaradas com preocupação para setores e investidores que exercem a atividade pensando a longo prazo, como os fundos de pensão e reguladores financeiros.

Diretor do programa de finanças sustentáveis da Universidade de Oxford, no Reino Unido, Ben Caldecott ressalta que os impactos financeiros das mudanças climáticas são um risco de grande escala.

— Os investidores podem fazer muito para diferenciar entre as empresas mais ou menos expostas e, assim, conseguirem ajudar a reduzir os riscos para a economia global, apoiando ações ambientais sobre as mudanças climáticas.

MAIS GRAVE QUE POLIOMIELITE

Ontem, um relatório divulgado na Casa Branca alertou que as mudanças climáticas representam uma grave ameaça para a saúde pública — em muitos aspectos, pior do que a poliomielite — e atacará especialmente gestantes, crianças, pessoas de baixa renda, negros, asiáticos e hispânicos.

O documento “Os impactos das mudanças climáticas na saúde humana nos EUA: uma avaliação científica”, adverte sobre os riscos arrebatadores para a saúde pública do aumento da temperatura nas próximas décadas, que também levaria a mais mortes e doenças por insolação, insuficiência respiratória e doenças como o vírus do Nilo Ocidental.

Leading Climate Scientists: ‘We Have A Global Emergency,’ Must Slash CO2 ASAP (Think Progress)

 MAR 22, 2016 2:38 PM

CREDIT: AP/DENNIS COOK

James Hansen and 18 leading climate experts have published a peer-reviewed version of their 2015 discussion paper on the dangers posed by unrestricted carbon pollution. The study adds to the growing body of evidence that the current global target or defense line embraced by the world — 2°C (3.6°F) total global warming — “could be dangerous” to humanity.

That 2°C warming should be avoided at all costs is not news to people who pay attention to climate science, though it may be news to people who only follow the popular media. The warning is, after all, very similar to the one found in an embarrassingly underreported report last year from 70 leading climate experts, who had been asked by the world’s leading nations to review the adequacy of the 2°C target.

Specifically, the new Hansen et al study — titled “Ice melt, sea level rise and superstorms: evidence from paleoclimate data, climate modeling, and modern observations that 2 C global warming could be dangerous” — warns that even stabilizing at 2°C warming might well lead to devastating glacial melt, multimeter sea level rise and other related catastrophic impacts. The study is significant not just because it is peer-reviewed, but because the collective knowledge about climate science in general and glaciology in particular among the co-authors is quite impressive.

Besides sea level rise, rapid glacial ice melt has many potentially disastrous consequences, including a slowdown and eventual shutdown of the key North Atlantic Ocean circulation and, relatedly, an increase in super-extreme weather. Indeed, that slowdown appears to have begun, and, equally worrisome, it appears to be supercharging both precipitation, storm surge, and superstorms along the U.S. East Coast (like Sandy and Jonas), as explained here.

It must be noted, however, that the title of the peer-reviewed paper is decidedly weaker than the discussion paper’s “Ice melt, sea level rise and superstorms: evidence from paleoclimate data, climate modeling, and modern observations that 2°C global warming is highly dangerous.” The switch to “could be dangerous” is reminiscent of the switch (in the opposite direction) from the inaugural 1965 warning required for cigarette packages, “Caution: Cigarette Smoking May Be Hazardous to Your Health” to the 1969 required label “Warning: The Surgeon General Has Determined that Cigarette Smoking Is Dangerous to Your Health.”

And yes I’m using the analogy to suggest readers should not be sanguine about the risks we face at 2°C warning. Based on both observations and analysis, the science is clearly moving in the direction that 2°C warming is not “safe” for humanity. But as Hansen himself acknowledged Monday on the press call, the record we now have of accelerating ice loss in both Greenland and West Antarctica is “too short to infer accurately” whether the current exponential trend will continue through the rest of the century.

Hansen himself explains the paper’s key conclusions and the science underlying them in a new video:


The fact that 2°C total warming is extremely likely to lock us in to sea level rise of 10 feet or more has been obvious for a while now. The National Science Foundation (NSF) itself issued a news release back in 2012 with the large-type headline, “Global Sea Level Likely to Rise as Much as 70 Feet in Future Generations.” The lead author explained, “The natural state of the Earth with present carbon dioxide levels is one with sea levels about 70 feet higher than now.” Heck, a 2009 paper in Science found the same thing.

What has changed is our understanding of just how fast sea levels could rise. In 2014 and 2015, a number of major studies revealed that large parts of the Antarctic and Greenland ice sheets are unstable and headed toward irreversible collapse — and some parts may have already passed the point of no return. Another 2015 study found that global sea level rise since 1990 has been speeding up even faster than we knew.

The key question is how fast sea levels can rise this century and beyond. In my piece last year on Hansen’s discussion draft, I examined the reasons the Intergovernmental Panel on Climate Change (IPCC) and scientific community have historically low-balled the plausible worst-case for possible sea level rise by 2100. I won’t repeat that all here.

The crux of the Hansen et al. forecast can be found in this chart on ice loss from the world’s biggest ice sheet:

Antarctic ice mass change

Antarctic ice mass change from GRACE satallite data (red) and surface mass balance method (MBM, blue). Via Hansen et al.

Hansen et al. ask the question: if the ice loss continues growing exponentially how much ice loss (and hence how much sea level rise) will there be by century’s end? If, for instance, the ice loss rate doubles every 10 years for the rest of the century (light green), then we would see multi-meter sea level rise before 2100? On the other hand, it is pretty clear just from looking at the chart that there isn’t enough data to make a certain projection for the next eight decades.

The authors write, “our conclusions suggest that a target of limiting global warming to 2°C … does not provide safety.” On the one hand, they note, “we cannot be certain that multi-meter sea level rise will occur if we allow global warming of 2 C.” But, on the other hand, they point out:

There is a possibility, a real danger, that we will hand young people and future generations a climate system that is practically out of their control.
We conclude that the message our climate science delivers to society, policymakers, and the public alike is this: we have a global emergency. Fossil fuel CO2 emissions should be reduced as rapidly as practical.

I have talked to many climate scientists who quibble with specific elements of this paper, in particular whether the kind of continued acceleration of ice sheet loss is physically plausible. But I don’t find any who disagree with the bold-faced conclusions.

Since there are a growing number of experts who consider that 10 feet of sea level rise this century is a possibility, it would be unwise to ignore the warning. That said, on our current emissions path we already appear to be headed toward the ballpark of four to six feet of sea level rise in 2100 — with seas rising up to one foot per decade after that. That should be more than enough of a “beyond adaptation” catastrophe to warrant strong action ASAP.

The world needs to understand the plausible worst-case scenario for climate change by 2100 and beyond — something that the media and the IPCC have failed to deliver. And the world needs to understand the “business as usual” set of multiple catastrophic dangers of 4°C if we don’t reverse course now. And the world needs to understand the dangers of even 2°C warming.

So kudos to all of these scientists for ringing the alarm bell: James Hansen, Makiko Sato, Paul Hearty, Reto Ruedy, Maxwell Kelley, Valerie Masson-Delmotte, Gary Russell, George Tselioudis, Junji Cao, Eric Rignot, Isabella Velicogna, Blair Tormey, Bailey Donovan, Evgeniya Kandiano, Karina von Schuckmann, Pushker Kharecha, Allegra N. Legrande, Michael Bauer, and Kwok-Wai Lo.