Arquivo da tag: Previsão

NASA, NOAA find 2014 warmest year in modern record (Science Daily)

Date: January 16, 2015

Source: NASA

Summary: The year 2014 ranks as Earth’s warmest since 1880, according to two separate analyses by NASA and National Oceanic and Atmospheric Administration (NOAA) scientists. The 10 warmest years in the instrumental record, with the exception of 1998, have now occurred since 2000. This trend continues a long-term warming of the planet, according to an analysis of surface temperature measurements.

This color-coded map displays global temperature anomaly data from 2014. Credit: NASA’s Goddard Space Flight Center

The year 2014 ranks as Earth’s warmest since 1880, according to two separate analyses by NASA and National Oceanic and Atmospheric Administration (NOAA) scientists.

The 10 warmest years in the instrumental record, with the exception of 1998, have now occurred since 2000. This trend continues a long-term warming of the planet, according to an analysis of surface temperature measurements by scientists at NASA’s Goddard Institute of Space Studies (GISS) in New York.

In an independent analysis of the raw data, also released Friday, NOAA scientists also found 2014 to be the warmest on record.

“NASA is at the forefront of the scientific investigation of the dynamics of the Earth’s climate on a global scale,” said John Grunsfeld, associate administrator for the Science Mission Directorate at NASA Headquarters in Washington. “The observed long-term warming trend and the ranking of 2014 as the warmest year on record reinforces the importance for NASA to study Earth as a complete system, and particularly to understand the role and impacts of human activity.”

Since 1880, Earth’s average surface temperature has warmed by about 1.4 degrees Fahrenheit (0.8 degrees Celsius), a trend that is largely driven by the increase in carbon dioxide and other human emissions into the planet’s atmosphere. The majority of that warming has occurred in the past three decades.

“This is the latest in a series of warm years, in a series of warm decades. While the ranking of individual years can be affected by chaotic weather patterns, the long-term trends are attributable to drivers of climate change that right now are dominated by human emissions of greenhouse gases,” said GISS Director Gavin Schmidt.

While 2014 temperatures continue the planet’s long-term warming trend, scientists still expect to see year-to-year fluctuations in average global temperature caused by phenomena such as El Niño or La Niña. These phenomena warm or cool the tropical Pacific and are thought to have played a role in the flattening of the long-term warming trend over the past 15 years. However, 2014’s record warmth occurred during an El Niño-neutral year.

“NOAA provides decision makers with timely and trusted science-based information about our changing world,” said Richard Spinrad, NOAA chief scientist. “As we monitor changes in our climate, demand for the environmental intelligence NOAA provides is only growing. It’s critical that we continue to work with our partners, like NASA, to observe these changes and to provide the information communities need to build resiliency.”

Regional differences in temperature are more strongly affected by weather dynamics than the global mean. For example, in the U.S. in 2014, parts of the Midwest and East Coast were unusually cool, while Alaska and three western states — California, Arizona and Nevada — experienced their warmest year on record, according to NOAA.

The GISS analysis incorporates surface temperature measurements from 6,300 weather stations, ship- and buoy-based observations of sea surface temperatures, and temperature measurements from Antarctic research stations. This raw data is analyzed using an algorithm that takes into account the varied spacing of temperature stations around the globe and urban heating effects that could skew the calculation. The result is an estimate of the global average temperature difference from a baseline period of 1951 to 1980.

NOAA scientists used much of the same raw temperature data, but a different baseline period. They also employ their own methods to estimate global temperatures.

GISS is a NASA laboratory managed by the Earth Sciences Division of the agency’s Goddard Space Flight Center, in Greenbelt, Maryland. The laboratory is affiliated with Columbia University’s Earth Institute and School of Engineering and Applied Science in New York.

NASA monitors Earth’s vital signs from land, air and space with a fleet of satellites, as well as airborne and ground-based observation campaigns. NASA develops new ways to observe and study Earth’s interconnected natural systems with long-term data records and computer analysis tools to better see how our planet is changing. The agency shares this unique knowledge with the global community and works with institutions in the United States and around the world that contribute to understanding and protecting our home planet.

The data set of 2014 surface temperature measurements is available at:

http://data.giss.nasa.gov/gistemp/

The methodology used to make the temperature calculation is available at:

http://data.giss.nasa.gov/gistemp/sources_v3/

For more information about NASA’s Earth science activities, visit:

http://www.nasa.gov/earthrightnow

2014: Putting The Hottest Year Ever in Perspective (Climate Nexus)

Last updated: January 16, 2015

Climate Change Connections and Why It Matters

Introduction

2014 was 0.69°C (1.24°F) above the 20th century average of 14.1°C, making it the hottest year on record since NOAA’s National Climatic Data Center began taking measurements in 1880. The record surpassed the previous hottest year record, shared by 2005 and 2010, by 0.04°C (0.07°F). As the Earth heats up, new temperature records are increasingly common, but 2014’s record-breaking global temperature—which represents the average of land and ocean surface temperatures—is especially remarkable given that 2014 saw little influence from El Niño warming and was an ENSO-neutral year. Here is some important context on how the 2014 temperature record reaffirms long-term, human-caused global warming trends; how recent warming is tied to extreme weather patterns; and how analysts use global temperature datasets to assess the state of the climate. Top points to note include:

Table of Contents

U.S. 2014 Temperature Trends

ENSO

Record Ocean Heat

U.S. Extreme Weather

Global Extreme Weather

Temperature Datasets

  • In 2014, the U.S. saw unprecedented levels of simultaneous extreme heat in the West and cooler than average temperatures in the East, with both trends linked to global warming.
  • 2014’s heat record is alarming in the absence of a full El Niño-Southern Oscillation (ENSO) and provides yet more evidence that that human-caused warming is now the dominant force driving changes in global temperature trends.
  • Global warming is not only on the rise but is fueling extreme weather and unprecedented patterns of extreme temperature anomalies.
  • Sea surface temperatures in particular are reaching record highs, driving extreme atmospheric patterns that cause heavy rainfall and floods in some countries and droughts in others.
  • Three of the four major groups that track combined ocean and land surface global temperatures—NOAA, NASA, and the JMA— have confirmed that 2014 was the hottest year on record, even with biases that underestimate warming in the ocean and Arctic.

Record Heat Supports Long-Term Warming Trend

Climate change linked to unusual temperature trends in the U.S.

2014 saw five new monthly heat records in the U.S. and was the 18th year in a row where the nationwide annual temperature average was hotter than usual. Though parts of the U.S. experienced cooler than average temperatures (a trend linked to global climate change), Alaska, Arizona, California, and Nevada each had their warmest year on record. Alarmingly, California’s annual average temperature was 2.3°C (4.1°F) above the 20th century average, shattering the old record of 1.3°C (2.3°F) by 1°C.

Average annual temperature in California and the U.S.

Source: NOAA, SFGate

Human-caused warming in 2014 trumped the ENSO signal.

February 1985 was the last month where global temperature fell below the 20th century monthly average, making December 2014 the 358th consecutive month where global land and ocean surface temperature was above average. Each of the last three decades has been much warmer than the decade before. In the 1990s, every year was warmer than the average of the previous decade, and the 2000s were warmer still. Now, according to NOAA, thirteen out of fifteen of the hottest years on record occurred since 2000, and the two exceptions (1997 and 1998) were strong El Niño years. In 2014, six out of 12 months tied or topped previous monthly global temperature records.

The combination of human-caused warming and year-to-year natural variation has generally determined which years set new temperature records. Prior to 2014, 2010 and 2005 tied for the hottest year on record, both of which were El Niño years. This makes sense because, in addition to long-term warming due to an increase in atmospheric greenhouse gases, the ENSO can bump global temperatures up or down for one to several years at a time. During El Niño events, some of the heat that gets stored in the oceans spreads out and gets released back into the atmosphere, causing large-scale atmospheric circulation changes and an increase in global temperature. La Niña periods, on the other hand, are characterized by cooler than average temperatures.

What makes 2014 especially remarkable is that it set a new global temperature record during an ENSO-neutral year. From January-February 2014, sea surface temperatures were mostly below average across the eastern equatorial Pacific. By the fall, temperatures were above average, leading to speculation about the onset of an El Niño event. Scientists in the U.S. have three criteria, each of which must be met to officially declare the start of an El Niño. Conditions in the fall of 2014 met the first two criteria (that monthly sea surface temperature anomalies exceed 0.5°C and last across several seasons), but not the final criterion (observance of an atmospheric response associated with more rain over the central Pacific and less rain over Indonesia).

Global annual average temperature anomalies (relative to the 1961-1990 average) for 1950-2013 based on an average of the three data sets from NASA, NOAA and the UK Met Office. Coloring indicates whether a year was classified as an El Niño year (red), an ENSO neutral year (grey) or a La Niña year (blue).

Source: Climate Central, WMO

This means 2014 was the hottest year on record without the added boost from a full-fledged El Niño event, and it will have been even warmer than recent years with moderate ENSO contributions (2010 and 2005). Moreover, this implies that the amount of warming due to human activity is enough to trump the natural year-to-year variation associated with the ENSO cycle. With NOAA holding there is a 50-60 percent chance of a noteworthy El Niño event developing in early 2015, there’s a good chance 2015 will be even hotter, making for two record-setting years in a row. What’s more, as more heat is pumped into the ocean, climate models project a doubling in the frequency of extreme El Niño events in the future.

Record ocean surface temperatures driving 2014’s heat demonstrate the ocean’s role as an important heat sink and are linked to unusual atmospheric patterns.

Global average sea surface temperature (which is a conservative and incomplete cross-section of the ocean) has shown an alarming trend in 2014. From May through November, each month set a new record for global sea surface temperature anomaly (or departure from average), with June also setting a new record for the highest departure from average for any month. The record was short-lived, however, as June’s temperatures were quickly surpassed first in August and then again in September. A study analyzing the record ocean surface warming in 2014 finds that unusually warm surface temperatures in the North Pacific were largely responsible. While it is still too soon to know for sure, this could indicate the start of a new trend where the massive amount of heat being absorbed by the ocean is making its way to the surface, and getting reflected in surface temperatures.

Oceanic warming is especially worrisome because it has broad and complex impacts on the global climate system. Most immediately, the ocean is connected to the atmosphere—the two systems work together to move heat and freshwater across latitudes to maintain a balanced climate. This is known as ocean-atmospheric coupling. Climate scientists are actively researching how changes in ocean and atmospheric heat content impact circulation patterns, in particular how changes in circulation affect the weather patterns that steer storms. For example, one recent analysis found that ocean warming might cause atmospheric precipitation bands to shift toward the poles, causing an increase in the intensity and frequency of extreme precipitation events at middle and high latitudes as well as a reduction in the same near the equator. Already, we are starting to experience patterns consistent with this kind of analysis.

The amount of heat accumulating in the ocean is vital for diagnosing the Earth’s energy imbalance. Studies estimate that over 90 percent of the heat reaching the Earth is absorbed by the ocean and that over the past several decades, global warming has caused an increase in the heat content of both the upper and deep oceans.

Recent observational data has indicated a slowing in the rate of ocean surface warming relative to other climate variables, which scientists have pinned to cool-surface La Niña episodes in the equatorial Pacific. However, it is important to remember that different regions of the ocean heat up differently, and global observational data often underreports changes in regions that are difficult to measure (such as around the poles or in the deep oceans). The deep oceans in particular are responsible for absorbing much of the excess heat. Deep ocean circulation patterns carry sun-warmed tropical waters into the higher latitudes where they sink and flow back towards the Equator, acting as a kind of buffer to climate change by slowing the rate of surface warming. In addition, research shows that three major ocean basins—the Equatorial Pacific, North Atlantic, and Southern Ocean—are important areas of ocean heat uptake and that observational data often fails to capture the full extent of actual warming in these regions. Despite the limitations associated with measuring changes in ocean heat content, however, we are still seeing record-breaking heat in the oceans.


Warmer World Linked To More Extreme Weather

Unusual jet stream patterns, linked to warming in the Arctic and warmer sea surface temperatures in the Pacific, drove extreme drought in the western U.S. and chills in the East.

Temperatures in the U.S. throughout 2014 were exceptional, marked by simultaneous record heat in the West and cooler than average temperatures in the East. While it may seem strange for global warming to sometimes be accompanied by colder winters, recent studies hold that warming in the Arctic and in the western Pacific Ocean has led to changes in the jet stream, which can result in volatile weather patterns and unusually persistent periods of extreme weather in the mid-northern latitudes. The avenues through which warming influences the jet stream represent a new and still emerging facet of climate science.

Throughout 2013 and 2014, the jet stream frequently dipped from the Arctic to the south, creating a persistent dipole—or two opposed atmospheric pressure systems—with the Western U.S. receiving warm, high-pressure air from the Pacific, and the Eastern U.S. receiving Arctic air carried by the sunken jet stream.

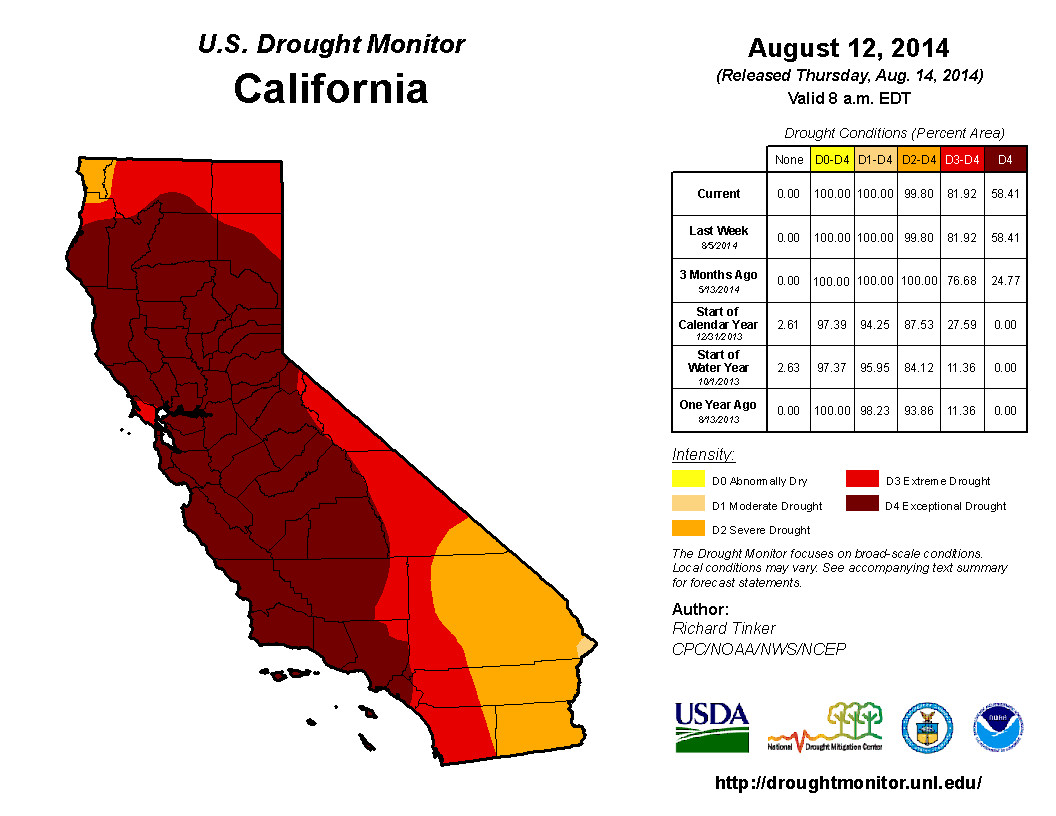
Arguably the most severe outgrowth of this recent trend in the U.S. has been the historic 2012-2014 California drought (which forecasters predict will continue into 2015). The state began 2014 with its lowest Sierra snowpack recording—12 percent—in more than 50 years of record keeping. In August, California set a new U.S. Drought Monitor record with 58.4 percent of the state in the worst drought category, known as “exceptional drought.” The dry conditions along the West Coast also fueled a severe wildfire season. On August 2, California Governor Jerry Brown declared a state of emergency due to the ongoing drought, fires and deteriorating air quality throughout the state. Meanwhile, Oregon and Washington topped the nation in total number of acres burned, with Washington experiencing its largest wildfire ever recorded.

The horizontal line marks the precipitation level of the 2000 – 2004 drought, the worst of the past 800 years up to 2012. Droughts of this intensity are predicted to be the new normal by 2030, and will be considered an outlier of extreme wetness by 2100

Source: Schwalm et al. 2012

By contrast, the Central and Eastern U.S. experienced unusually persistent cold temperatures throughout 2014. The winter of 2013-2014 was among the coldest on record for the Great Lakes, and Minnesota, Wisconsin, Michigan, Illinois, and Indiana each had winter temperatures that ranked among the ten coldest on record. Ice coverage over the Great Lakes peaked at 92.2 percent on March 6, the second highest measurement on record. The summer was also cooler than average for the region, which led into an unseasonably frigid fall.

Several U.S. locations experienced their coldest Novembers on record due to a procession of cold fronts tapping air from the Arctic. At the start, the Arctic outbreak was largely the product of the extra-tropical remnant of Typhoon Nuri from the Pacific. The system was the most powerful storm to ever move over the Bering Sea, gaining strength from warmer than average ocean and atmospheric conditions. Due to its strength, the storm caused the jet stream to sink southward bringing Arctic conditions to the United States. As a result, North America snow cover reached a record extent for mid-November—15.35 million square kilometers—crushing the old record from 1985 by over two million square kilometers. On November 16, temperatures were warmer in Alaska (significantly in some cases) than in many Central and Eastern U.S. states. Arctic temperatures ran up to 40 degrees above average (with Fairbanks, Alaska blowing away old temperature records by almost two degrees), while the Central and Eastern U.S. experienced record snowfall and temperatures up to 40 degrees below average.

The weather forecast across the United States from November 16 through November 20

Source: Thinkprogress; National Weather Service

Taken together, 2014 has witnessed a record-setting split in the U.S. between regions of simultaneous hot and cold temperatures. According to Scott Robeson, a climate scientist at Indiana University Bloomington, these hot and cold extremes are important. Robeson recently authored a studyon warm and cold anomalies in the northern hemisphere and found, “Average temperatures don’t tell us everything we need to know about climate change. Arguably, these cold extremes and warm extremes are the most important factors for human society.” Robeson notes that temperatures in the Northern Hemisphere are considerably more volatile than in the South, where there is less land mass to add complexity to weather systems. The extreme weather observed in 2014 in the U.S. has many layers of complexity, with ocean and Arctic temperatures influencing circulation patterns, and a growing body of scientificevidence suggests global warming may be the common denominator.

Internationally, 2014 saw record heat and drought in some countries, but cold spells and flooding in others. As in the U.S., many of these trends are associated with unusual ocean-atmospheric circulation patterns with likely connections to climate change.

Perturbations in the jet stream have wide ranging climate impacts that vary depending on geographical region. One recent analysis finds a connection between a wavy jet stream pattern—with greater dips from north to south—and increases in the probabilities of heat waves in western North America and central Asia; cold outbreaks in eastern North America; droughts in central North America, Europe and central Asia; and wet spells in western Asia.

Just as most of the weather in the western U.S. is below the jet stream and connected to the Pacific, most of the weather in Europe rides in under the jet stream from the Atlantic. While the jet stream has been unusually far north in the Pacific, bringing high temperatures and drought to the western U.S., the jet stream has been unusually far south across the Atlantic. As a result, the UK was hit by an exceptional run of winter storms and an intense polar vortex at the start of 2014, with rainfall amounts, storm intensities, wave heights, and other extreme weather trends at or near record levels. Related damages from December 23, 2013 – March 1, 2014 added up to $1.5 billion. Global warming has doubled the risk of extreme conditions, as warmer temperatures and melting ice in the Arctic cause the jet stream to push cold air southwards.

In January and February, an exceptional dry spell hit Southeast Asia, with the worst impacts—including water shortages, wildfires, crop failure, and increased incidence of infectious disease—felt in Singapore, Malaysia, Indonesia, and Thailand. Singapore suffered its longest dry spell on record between January 13 and February 8, which caused extensive damage to rice crops and fish stocks at several offshore farms. Dengue hotspots in Malaysia experienced a four-fold increase in infections to about 14,000 compared with the same period last year.

Continuous, heavy rainfall in May resulted in some of the worst flooding ever recorded in Southeast Europe, mainly Serbia, Bosnia and Herzegovina (BiH), and Croatia. Three months’ worth of rain fell in only three days, making it the heaviest rainfall in BiH since records began in 1894. On May 15, the Serbian Government declared a state of emergency for its entire territory. The storm caused $4.5 billion in damage.

May also saw the Eastern Pacific’s strongest May hurricane on record, Hurricane Amanda, which peaked as a top-end Category 4 hurricane with 155 mph winds. The impressive hurricane was linked to record sea surface temperatures, which measured 0.59°C above the 20th century average of 16.3°C, the highest temperature anomaly on record for May. In July in the Western Pacific, Typhoon Rammasun became the strongest typhoon to hit China’s Hainan Province in 21 years, surprising forecasters as it gained more strength than anticipated. Like Amanda, wind speeds topped out around 155 mph. The typhoon remained very strong as it made landfall, leading to extreme rainfall and flooding in China that caused $7.2 billion in damage. Global warming is expected to increase the rainfall from tropical cyclones.

In Australia, 2014 was the third hottest year on record (with 2013 being the hottest) and was characterized by frequent periods of abnormally warm weather that contributed to huge bushfires in Victoria and South Australia. According to Dr. Karl Braganza, manager of the Bureau of Meteorology’s climate monitoring section, Australia is seeing “reoccurring heat waves, long durations of heat but very little cold weather.” A report by Australia’s Climate Council finds that the frequency and severity of bushfires is getting worse in the southern state of New South Wales each year due to “record-breaking heat and hotter weather over the long term.”

Following the wettest January to August on record, the UK experienced its driest September since records began in 1910, receiving 19.4mm of rain, or 20 percent of the expected average. Monthly temperatures in the UK were also significantly above average. One recent study finds that human-caused global warming has increased the chances of extremely hot summers in parts of Europe tenfold. The UK Met Office is currently researching how jet stream variations and changes to atmospheric circulation may be increasing the risk of patterns that slow the movement of weather systems, allowing heat waves to develop and intensify.


Understanding the Global Surface Temperature Datasets

Three of the major global temperature datasets that combine both ocean and atmospheric temperatures have declared 2014 the hottest year on record.

The 10 warmest years on record according to the NOAA and NASA datasets.

Source: NOAANASA

The four most highly cited combined SST and land temperature datasets are NOAA’s MLOST, NASA’s GISTEMP, the UK’s HadCRUT, and the JMA’s CLIMAT. While HadCRUT has yet to confirm, NOAA, NASA and the JMA—using independent data and analysis—have decalred 2014 the hottest year on record. The Japanese Meteorological Agency (JMA) was one of the first agencies to report 2014’s heat record in a preliminary analysis and found that 2014’s global temperature was 0.63°C above average. NOAA’s data holds that 2014’s temperature was 0.69°C above average, and NASA that it was 0.68°C above average.

Satellites that measure temperatures in the lower atmosphere, or troposphere, did not rank 2014 as a record year, but the troposphere is only one region where excess heat gets stored.

Because satellite datasets measure the atmosphere, and not the climate system as a whole, it is inaccurate to compare satellite temperature averages with combined land and SST averages. Combined land and SST datasets are based on instrumental readings taken on site in the ocean and atmosphere, while satellite records focus on the troposphere and infer temperatures at various levels using measurements of radiance (the intensity of radiation passing through a point in a given direction). Both types of datasets improve our understanding of the rate at which the Earth is warming and how the climate system as a whole distributes heat. But because the two types of datasets vary in terms of their scope, it is perfectly possible for the atmospheric temperature average, as measured by satellites, not to set a new record, while the global combined land and SST average does.

This was the case in 2014. The two most widely cited satellite records are the University of Alabama in Huntsville (UAH) and the privately owned Remote Sensing Systems (RSS) datasets. According to the RSS data, 2014’s annual average temperature in the lower troposphere was the sixth warmest on record, or 0.26°C above the long-term average. The UAH data has not yet been confirmed, but will likely reaffirm the RSS finding. This is to be expected, however, in a year where record ocean heat was the dominant driver of observed warming.

Temperature analyses provide an important health gauge for the planet.

The instrumental temperature record—based on readings from ships and buoys that measure sea-surface temperature (SST) as well as land-based weather stations—has provided vital information about the Earth’s climate over the last century and beyond. To reconstruct global temperatures, each agency divides the Earth’s surface into latitude-longitude grid boxes that are used to integrate in situ (“on site”) temperature measurements from around the globe.

The three most highly cited combined SST and land temperature datasets are NOAA’s MLOST, NASA’s GISTEMP, and the UK’s HadCRUT. All three datasets report global average temperature as an anomaly, or departure from average, relative to a reference period. This is because absolute temperatures can vary (depending on factors like elevation), whereas anomalies allow for more meaningful comparisons between locations and accurate calculations of temperature trends. HadCRUT uses the most recent reference period to calculate anomalies, 1961-1990, followed by GISTEMP’s 1951-1980 period. MLOST, on the other hand, uses the 20th century, 1901-2000, as its reference period to establish a longer-term average.

Global Land and Ocean Temperature Anomalies, January-December

Source: NOAA

While the concept of these datasets is fairly simple, their construction is challenging due to difficulties in obtaining data; documenting and accounting for changes in instrumentation and observing practices; addressing changes in station location and local land use; understanding random measurement errors; and deciding where and how to fill in missing data in space and time. Each group has approached the above challenges somewhat differently. The final datasets differ in their spatial coverage, spatial resolution, starting year, and degree of interpolation (a method of constructing missing data points based on surrounding, discrete points). For this reason, NOAA, NASA, and UK Met Office global temperature anomalies vary subtly.

Global temperature data often underestimates the amount of warming due to coverage bias.

Analyzing temperature observations at a global scale often comes at the cost of not including important spatial detail. This challenge—known as coverage bias—is something all three of the major global temperature datasets struggle with and attempt to reconcile.

NOAA’s Merged Land-Ocean Surface Temperature Analysis (MLOST) uses land surface air temperatures taken from the Global Historical Climatology Network (GHCN) dataset and ocean temperatures from the Extended Reconstructed Sea Surface Temperature (ERSST) dataset, and combines these into a comprehensive global surface temperature dataset. The comprehensive dataset spans from 1880 to the present at monthly resolution on a 5×5 degree latitude-longitude grid. MLOST uses interpolation, but areas without enough data—mainly at the poles, over Africa, and at the center of the Atlantic and Pacific Oceans—are masked in the data analysis to prevent any overreliance on reconstructions that are based on too little data.

NASA Goddard’s Global Surface Temperature Analysis (GISTEMP) also uses GHCN data from 1880 to the present, but GISTEMP has some important differences from NOAA’s MLOST. While GISTEMP has a more focused spatial resolution, with a 2×2 grid, and better coverage at the poles due to the inclusion of data from Antarctic “READER” stations, it only provides data in terms of temperature anomalies. All three of the major global datasets report global temperatures as anomalies to make comparison and computation easier, but GISTEMP is unique in that it works solely with anomaly data from the outset. NOAA and HadCRUT have absolute temperature data from which they derive regional anomalies. As for HadCRUT, it is unique in that it incorporates many additional sources beyond GHCN and is the only global analysis that does not use interpolation. It also has more spatial coverage gaps than MLOST and GISTEMP and a tendency to significantly underreport warming, primarily due to a lack of temperature data at the Arctic, which is warming much fasterthan other regions.

“The Shining Sun,” DeviantArt user edsousa

Seca em São Paulo – 16 de janeiro de 2015

Chuvas devem continuar abaixo da média em 2015, diz Cemaden (G1)

Ano deve ser influenciado por eventos extremos de 2014, diz especialista

Se o ano passado foi um período de condições climáticas extremas no Brasil, entre elas a seca em diversas regiões, a situação em 2015 pode piorar. Esta é a avaliação feita pelo Centro Nacional de Monitoramento e Alertas de Desastres Naturais (Cemaden) em Cachoeira Paulista (SP), que já prevê chuvas abaixo da média novamente.

De acordo com o meteorologista do Cemaden, Marcelo Seluchi, neste verão choveu pouco mais da metade do normal para o período. O órgão é uma das extensões do Instituto Nacional de Pesquisas Espaciais (Inpe) para estudos e alertas de desastres naturais. “Comparado com o ano passado, a situação de 2015 pode piorar nas metrópoles em várias regiões do Brasil e no Vale do Paraíba”, afirma.

Leia mais: http://g1.globo.com/sp/vale-do-paraiba-regiao/noticia/2015/01/chuvas-devem-continuar-abaixo-da-media-em-2015-diz-cemaden.html

(Portal G1)

*   *   *

Cantareira pode secar em julho, prevê centro de monitoramento (O Globo)

Governador Alckmin diz que foi mal interpretado ao falar sobre racionamento

O Sistema Cantareira, responsável por abastecer 6,5 milhões de pessoas na Grande São Paulo, pode secar em julho, caso o consumo de água na Região Metropolitana continue o mesmo e a chuva mantenha o ritmo observado nos últimos meses. A projeção foi feita pelo Centro Nacional de Monitoramento e Alertas de Desastres Naturais (Cemaden), ligado ao Ministério da Ciência e Tecnologia.

Leia mais: http://oglobo.globo.com/brasil/cantareira-pode-secar-em-julho-preve-centro-de-monitoramento-15066400

(O Globo)

Mais informações sobre o assunto: Presidente da Cedae prevê uso inédito do volume morto de Paraibuna ainda este semestre – http://oglobo.globo.com/rio/presidente-da-cedae-preve-uso-inedito-do-volume-morto-de-paraibuna-ainda-este-semestre-15066522

(O Globo)

*   *   *

Combinação de seca e calor extremo agrava crise do Cantareira (Estadão)

Dados oficiais mostram que nos primeiros 15 dias do ano o sistema recebeu 35% menos água do que a média de janeiro passado, enquanto as temperaturas máximas na capital batem recordes

Apontada pelo governo Geraldo Alckmin (PSDB) como a causa da crise hídrica paulista no início de 2014, a combinação de seca severa nos mananciais e calor extremo na capital está ainda mais crítica em 2015. Dados oficiais mostram que nos primeiros 15 dias do ano o Sistema Cantareira recebeu 35% menos água do que a média de janeiro passado, enquanto as temperaturas máximas na cidade estão batendo o recorde registrado no mesmo período do ano anterior.

O conteúdo na íntegra está disponível em: http://sao-paulo.estadao.com.br/noticias/geral,combinacao-de-seca-e-calor-extremo-agrava-crise-do-cantareira,1620492

(Fabio Leite/O Estado de S. Paulo)

Mais informações sobre o assunto: Na Folha de S.Paulo – Cantareira tem ainda menos chuva em 2015 (http://www1.folha.uol.com.br/fsp/cotidiano/204210-cantareira-tem-ainda-menos-chuva-em-2015.shtml)

*   *   *

Nível de oceanos subiu em ritmo 30% maior do que se previa (Folha de S.Paulo)

Novo estudo indica que nível do mar subiu apenas 1,2 mm entre 1900 e 1990; avaliações antigas diziam que elevação foi de 1,8mm

Do início do século 20 até a década passada, o nível dos oceanos subiu em ritmo 30% maior do que se imaginava, de acordo com um estudo realizado por pesquisadores da Universidade de Harvard (Estados Unidos).

O conteúdo na íntegra está disponível em: http://ciencia.estadao.com.br/noticias/geral,nivel-de-oceanos-subiu-em-ritmo-30-maior-do-que-se-previa,1620001

(Fábio de Castro – O Estado de S. Paulo)

Mais informações sobre o assunto: 

O Globo – Nível dos mares tem aumentado mais rápido (http://oglobo.globo.com/sociedade/ciencia/nivel-dos-mares-tem-aumentado-mais-rapido-15054794)

Banco Mundial diz que seca no nordeste brasileiro pode piorar (Rádio ONU)

09/12/2014 – 09h39

por Edgard Júnior, da Rádio ONU

seca Banco Mundial diz que seca no nordeste brasileiro pode piorar

Afirmação foi feita pela assessora sênior para a América Latina e o Caribe da instituição financeira; Karin Kemper afirmou também que aumento do nível dos mares pode ter impacto no Rio de Janeiro.

A assessora regional sênior do Banco Mundial para a América Latina e o Caribe, Karin Kemper, disse, em entrevista à Rádio ONU, que se a temperatura global continuar aumentando, a seca no nordeste do Brasil pode piorar.

“Sabemos que o nordeste sempre sofreu com as secas, mas poderia ter uma frequência mais intensa ou poderia ter secas mais prolongadas. Sabemos que isso tem efeitos econômicos tanto para a população do interior, mas também podemos imaginar que, por exemplo, as cidades grandes do nordeste podem sofrer mais impactos por insegurança hídrica.”

Investimentos

Citando o relatório lançado pelo Banco Mundial na semana passada, Kemper disse ainda que os impactos do aumento da temperatura serão maiores sobre as populações mais pobres, mais vulneráveis, mulheres, crianças, como também grupos indígenas.

A assessora para a América Latina e o Caribe alertou que investimentos que poderiam ser feitos em outros setores vão acabar sendo destinados para combater os efeitos climáticos.

“Se houver um aumento do nível dos mares, por exemplo, o cálculo que temos no relatório para o Rio de Janeiro varia de uma alta de, no mínimo, 62 cm até 1 metro, no máximo. Isso significa que se precisa fazer investimentos nas cidades costeiras. Esse dinheiro poderia ser utilizado em outras coisas como em hospitais, escolas e outros setores de desenvolvimento.”

O relatório do Banco Mundial disse que um novo padrão climático global pode reduzir em 70% a produção de soja no Brasil e a de trigo em 60%.

O documento mostra dois cenários futuros prevendo as consequências de aumentos médios da temperatura global de 2 e 4 graus centígrados, até 2050. Os especialistas calculam que os danos causados por enchentes costeiras devem chegar a US$ 22 bilhões, o equivalente a mais de R$ 56 bilhões.

* Publicado originalmente no site Rádio ONU.

(Rádio ONU)

New insights into predicting future droughts in California: Natural cycles, sea surface temperatures found to be main drivers in ongoing event (Science Daily)

Date: December 8, 2014

Source: National Oceanic and Atmospheric Administration

Summary: Natural oceanic and atmospheric patterns are the primary drivers behind California’s ongoing drought. A high pressure ridge off the West Coast (typical of historic droughts) prevailed for three winters, blocking important wet season storms, with ocean surface temperature patterns making such a ridge much more likely.


Folsom Lake. Top photo taken in 2011, bottom taken in 2014. Credit: CA Dept. of Water Resources

According to a new NOAA-sponsored study, natural oceanic and atmospheric patterns are the primary drivers behind California’s ongoing drought. A high pressure ridge off the West Coast (typical of historic droughts) prevailed for three winters, blocking important wet season storms, with ocean surface temperature patterns making such a ridge much more likely. Typically, the winter season in California provides the state with a majority of its annual snow and rainfall that replenish water supplies for communities and ecosystems.

Further studies on these oceanic conditions and their effect on California’s climate may lead to advances in drought early warning that can help water managers and major industries better prepare for lengthy dry spells in the future.

“It’s important to note that California’s drought, while extreme, is not an uncommon occurrence for the state. In fact, multi-year droughts appear regularly in the state’s climate record, and it’s a safe bet that a similar event will happen again. Thus, preparedness is key,” said Richard Seager, report lead author and professor with Columbia University’s Lamont Doherty Earth Observatory.

This report builds on earlier studies, published in September in the Bulletin of the American Meteorological Society, which found no conclusive evidence linking human-caused climate change and the California drought. The current study notes that the atmospheric ridge over the North Pacific, which has resulted in decreased rain and snowfall since 2011, is almost opposite to what models project to result from human-induced climate change. The report illustrates that mid-winter precipitation is actually projected to increase due to human-induced climate change over most of the state, though warming temperatures may sap much of those benefits for water resources overall, while only spring precipitation is projected to decrease.

The report makes clear that to provide improved drought forecasts for California, scientists will need to fully understand the links between sea surface temperature variations and winter precipitation over the state, discover how these ocean variations are generated, and better characterize their predictability.

This report contributes to a growing field of science-climate attribution-where teams of scientists aim to identify the sources of observed climate and weather patterns.

“There is immense value in examining the causes of this drought from multiple scientific viewpoints,” said Marty Hoerling, report co-author and researcher with NOAA’s Earth System Research Laboratory. “It’s paramount that we use our collective ability to provide communities and businesses with the environmental intelligence they need to make decisions concerning water resources, which are becoming increasingly strained.”

To view the report, visit: http://cpo.noaa.gov/MAPP/californiadroughtreport.

Early warning signals of abrupt climate change (Science Daily)

Date: December 8, 2014

Source: University of Exeter

Summary: A new study has found early warning signals of a reorganization of the Atlantic ocean’s circulation which could have a profound impact on the global climate system.


Drought (stock image). Credit: © carloscastilla / Fotolia

A new study by researchers at the University of Exeter has found early warning signals of a reorganisation of the Atlantic ocean’s circulation which could have a profound impact on the global climate system.

The research, published today in the journal Nature Communications, used a simulation from a highly complex model to analyse the Atlantic Meridional Overturning Circulation (AMOC), an important component of the Earth’s climate system.

It showed that early warning signals are present up to 250 years before it collapses, suggesting that scientists could monitor the real world overturning circulation for the same signals.

The AMOC is like a conveyor belt in the ocean, driven by the salinity and temperature of the water. The system transports heat energy from the tropics and Southern Hemisphere to the North Atlantic, where it is transferred to the atmosphere.

Experiments suggest that if the AMOC is ‘switched off’ by extra freshwater entering the North Atlantic, surface air temperature in the North Atlantic region would cool by around 1-3°C, with enhanced cooling of up to 8°C in the worst affected regions.

The collapse would also encourage drought in the Sahel — the area just south of the Sahara desert — and dynamic changes in sea level of up to 80cm along the coasts of Europe and North America.

“We found that natural fluctuations in the circulation were getting longer-lived as the collapse was approached, a phenomenon known as critical slowing down,” said lead author Chris Boulton.

“We don’t know how close we are to a collapse of the circulation, but a real world early warning could help us prevent it, or at least prepare for the consequences” adds co-author Professor Tim Lenton.

The study is the most realistic simulation of the climate system in which this type of early warning signal has been tested.

“The best early warning signals in the model world are in places where major efforts are going into monitoring the circulation in the real world — so these efforts could have unexpected added value’ adds Professor Lenton.


Journal Reference:

  1. Chris A. Boulton, Lesley C. Allison, Timothy M. Lenton. Early warning signals of Atlantic Meridional Overturning Circulation collapse in a fully coupled climate modelNature Communications, 2014; 5: 5752 DOI: 10.1038/ncomms6752

January-October 2014 temperatures highest on record (Science Daily)

Date: November 29, 2014

Source: World Meteorological Organization

Summary: The global average temperature over land and ocean surfaces for January to October 2014 was the highest on record, according to the U.S. National Oceanic and Atmospheric Administration. It said October was the hottest since records began in 1880.

The global average temperature over land and ocean surfaces for January to October 2014 was the highest on record, according to NOAA. October was the hottest since records began in 1880. Credit: NOAA

The global average temperature over land and ocean surfaces for January to October 2014 was the highest on record, according to the U.S. National Oceanic and Atmospheric Administration (NOAA). It said October was the hottest since records began in 1880.

NOAA said the combined global land and ocean average surface temperature for the January-October period was 0.68°C (1.22°F) above the 20th century average of 14.1°C (57.4°F). For October, it was 0.74°C (1.33°F) above the 20th century average of 14.0°C (57.1°F).

The high October temperature was driven by warmth across the globe over both the land and ocean surfaces and was fairly evenly distributed between the Northern and Southern Hemispheres. The Southern Hemisphere had its hottest October on record and the Northern Hemisphere its third warmest.

October marked the third consecutive month and fifth of the past six with a record high global temperature for its respective month (July was fourth highest).

The Tokyo Climate Center, which is a WMO Regional Climate Centre, also reported that October was the hottest on record. The record was also confirmed by data from NASA’s Goddard Institute for Space Studies.

WMO uses a combination of datasets to compile its annual Statement on the Status of the Global Climate. Additional information is drawn from the ERA-Interim reanalysis-based data set maintained by the European Centre for Medium-Range Weather Forecasts.

Further information: http://www.ncdc.noaa.gov/sotc/global/2014/10

Concluído primeiro recenseamento de nuvens do Brasil (Fapesp)

01 de dezembro de 2014

Por Karina Toledo

Agência FAPESP – Para conseguir prever com precisão eventos extremos, como tempestades, ou simular cenários de impactos das mudanças climáticas, é preciso avançar no conhecimento dos processos físicos que ocorrem no interior das nuvens e descobrir a variação de fatores como o tamanho das gotas de chuva, a proporção das camadas de água e de gelo e o funcionamento das descargas elétricas.

Com esse objetivo, uma série de campanhas para coleta de dados foi realizada entre 2010 e 2014 em seis cidades brasileiras – Alcântara (MA), Fortaleza (CE), Belém (PA), São José dos Campos (SP), Santa Maria (RS) e Manaus (AM) – no âmbito de um Projeto Temático FAPESP coordenado por Luiz Augusto Toledo Machado, do Instituto Nacional de Pesquisas Espaciais (Inpe). Essas campanhas contaram com a participação de pesquisadores da Universidade de São Paulo (USP) e de diversas faculdades de Meteorologia no Brasil, que sediaram os experimentos.

Os principais resultados da iniciativa, conhecida como “Projeto Chuva”, foram descritos em um artigo de capa do Bulletin of the American Meteorological Society, revista de grande impacto na área de meteorologia.

Segundo Machado, as regiões escolhidas para a pesquisa de campo representam os diferentes regimes de precipitação existentes no Brasil. “É importante fazer essa caracterização regional para que os modelos matemáticos possam fazer previsões em alta resolução, ou seja, em escala de poucos quilômetros”, disse o pesquisador.

Um conjunto comum de instrumentos – que inclui radares de nuvens de dupla polarização – foi usado nos diferentes sítios de forma que as medidas pudessem ser comparadas e parametrizadas para modelagem.

O radar de dupla polarização, em conjunto com outros instrumentos, envia ondas horizontais e verticais que, por reflexão, indicam o formato dos cristais de gelo e das gotas de chuva, ajudando a elucidar a composição das nuvens e os mecanismos de formação e intensificação das descargas elétricas durante as tempestades. Também foram coletados dados como temperatura, umidade e composição de aerossóis.

Além disso, experimentos adicionais distintos foram realizados em cada uma das seis cidades. No caso de Alcântara, onde a coleta de dados ocorreu em março de 2010, o experimento teve como foco o desenvolvimento de algoritmos de estimativa de precipitação para o satélite internacional Global Precipitation Measurement (GPM) – lançado em fevereiro de 2014 pela Nasa (a agência espacial americana) e pela Agência Japonesa de Exploração Aeroespacial (Jaxa).

“Naquela região, o grande desafio é conseguir estimar a precipitação das chamadas nuvens quentes, que não têm cristais de gelo em seu interior. Elas são comuns na região do semiárido nordestino”, explicou Machado.

Por não abrigarem gelo, a chuva dessas nuvens passa despercebida pelos sensores de micro-ondas que equipam os satélites usados normalmente para medir a precipitação, resultando em dados imprecisos.

As medições de nuvens quentes feitas por radar em Alcântara, comparadas com as medições feitas por satélite, indicaram que os valores de volume de água estavam subestimados em mais de 50%.

Em Fortaleza, onde a coleta foi feita em abril de 2011, foi testado em parceria com a Defesa Civil um sistema de previsão de tempestades em tempo real e de acesso aberto chamado Sistema de Observação de Tempo Severo (SOS Chuva).

“Usamos os dados que estavam sendo coletados pelos radares e os colocamos em tempo real dentro de um sistema de informações geográficas. Dessa forma, é possível fazer previsões para as próximas duas horas. E saber onde chove forte no momento, onde tem relâmpago e como a situação vai se modificar em 20 ou 30 minutos. Também acrescentamos um mapa de alagamento, que permite prever as regiões que podem ficar alagadas caso a água suba um metro, por exemplo”, contou Machado.

A experiência foi tão bem-sucedida, contou o pesquisador, que a equipe decidiu repeti-la nas campanhas realizadas posteriormente. “O SOS Chuva contribui para diminuir a vulnerabilidade da população a eventos extremos do clima, pois oferece informações não apenas para os agentes da Defesa Civil como também para os cidadãos”, disse.

Em junho de 2011 foi realizada a campanha de coleta de dados em Belém, onde os pesquisadores usaram uma rede de instrumentos de GPS para estimar a quantidade de água na atmosfera. Os resultados devem ser publicados em breve. Também foram lançados balões meteorológicos capazes de voar durante 10 horas e coletar dados da atmosfera. “O objetivo era entender o fluxo de vapor d’água que vem do Oceano Atlântico que forma a chuva na Amazônia”, contou Machado.

Entre novembro de 2011 e março de 2012, foi realizada a campanha de São José dos Campos, cujo foco era estudar os relâmpagos e a eletricidade atmosférica. Para isso, foi utilizado um conjunto de redes de detecção de descargas elétricas em parceria com a Agência de Pesquisas Oceânicas e Atmosféricas (NOAA), dos Estados Unidos, e a Agência Europeia de Satélites Meteorológicos (Eumetsat).

“Foram coletados dados para desenvolver os algoritmos dos sensores de descarga elétrica dos satélites geoestacionários de terceira geração, que ainda serão lançados pela NOAA e pela Eumetsat nesta década. Outro objetivo era entender como a nuvem vai se modificando antes que ocorra a primeira descarga elétrica, de forma a prever a ocorrência de raios”, contou Machado.

Em Santa Maria, entre novembro e dezembro de 2012, foram testados, em parceria com pesquisadores argentinos, modelos matemáticos de previsão de eventos extremos. Segundo Machado, a região que abrange o sul do Brasil e o norte da Argentina que ocorrem as tempestades mais severas do mundo.

“Os resultados mostraram que os modelos ainda não são precisos o suficiente para prever com eficácia a ocorrência desses eventos extremos. Em 2017, faremos um novo experimento semelhante, chamado Relâmpago, no norte da Argentina”, contou Machado.

GOAmazon

As duas operações intensivas de coleta de dados realizadas em Manaus – a primeira entre fevereiro e março de 2014 e a segunda entre setembro e outubro do mesmo ano – ainda não haviam ocorrido quando o artigo foi submetido à publicação.

A campanha foi feita no âmbito do projeto Green Ocean Amazon e contou com dois aviões voando em diferentes alturas para acompanhar a pluma de poluição emitida pela região metropolitana de Manaus. O objetivo era avaliar a interação entre os poluentes e os compostos emitidos pela floresta, bem como seu impacto nas propriedades de nuvens (leia mais em http://agencia.fapesp.br/avioes_sobrevoam_a_amazonia_por_quase_200_horas_para_medir_impacto_da_poluicao/20150/). Os dados ainda estão em fase de análise.

Ao comentar as principais diferenças encontradas nas diversas regiões brasileiras, Machado destaca que as regiões Sul e Sudeste são as que apresentam gotas de chuva de tamanhos maiores e uma camada mista, na qual há água no estado líquido e sólido, mais desenvolvida. Essa é, segundo o pesquisador, a principal razão da maior incidência de descargas elétricas nesses locais.

Já as nuvens da Amazônia apresentam a camada de gelo no topo – acima de 20 quilômetros de altura – mais bem desenvolvida que a de outras regiões. As regiões litorâneas, como Alcântara e Fortaleza, apresentam em maior quantidade as chamadas nuvens quentes, nas quais quase não há descargas elétricas.

“Foi o primeiro recenseamento de nuvens feito no Brasil. Essas informações servirão de base para testar e desenvolver modelos capazes de descrever em detalhes a formação de nuvens, com alta resolução espacial e temporal”, concluiu o pesquisador.

O Brasil secou (Super Interessante)

A falta d’água se alastrou pelo país, sintoma das mudanças climáticas e do desmatamento na Amazônia, cada vez mais debilitada. Nos aproximamos de um futuro desértico — e a culpa é toda nossa

por Camila Almeida

Novembro 2014

Em 2014, não choveu. Pelo menos não quanto deveria. Os índices de chuvas apresentam déficit, os reservatórios minguaram a percentuais críticos, a nascente do Rio São Francisco secou pela primeira vez na história. Esses eventos extremos estavam previstos pelos estudiosos das mudanças climáticas, causadas quase exclusivamente pela atividade humana, especialmente pela queima de combustíveis fósseis. Mas outro fator está agravando esse quadro: o desmatamento. A Amazônia é a responsável por manter úmido todo o continente, e sua depredação influencia diretamente no clima.

A floresta funciona como uma fábrica de chuvas. Por cima das nossas cabeças, há imensos rios seguindo seu curso, levando nuvens carregadas por onde passam. São os rios voadores, que começaram a ser estudados em 2006, numa parceria entre o aviador francês Gérard Moss e o engenheiro agrônomo Antonio Donato Nobre, do Instituto Nacional de Pesquisas Espaciais (INPE). Sobrevoando a Amazônia, eles descobriram todo o seu potencial de bombeamento de água e traçaram o curso que os rios voadores seguem pelo País. Esta capacidade da floresta de exportar umidade é um dos cinco segredos da floresta, poeticamente explicados no relatório O Futuro Climático da Amazônia, publicado recentemente por Nobre.

Nossa água vem da Amazônia
Entenda o processo de transpiração da floresta e a formação das nuvens sobre ela. Ao lado, conheça o percurso dos rios voadores e como eles levam chuvas por todo o continente.

O fluxo dos rios voadores é mais intenso no verão, estação em que chove na maior parte do País. Isso acontece graças à inclinação da Terra nesta época do ano, que favorece a entrada dos ventos marítimos na América do Sul. Mas há mais uma vantagem geográfica que garante esse circuito: a Cordilheira dos Andes, localizada a oeste da floresta. O imenso paredão faz com que os ventos não passem direto e deixem o resto do Brasil sem umidade. De acordo
com o físico Philip Fearnside, do Instituto Nacional de Pesquisas da Amazônia (INPA), é no
começo do ano que os rios voadores reabastecem as fontes de água e reservatórios brasileiros. Ao se chocarem contra a Serra da Mantiqueira e da Canastra, no Sudeste, enchem a nascente de vários rios importantes, como o São Francisco. “Esta região é a caixa d’água do Brasil”, avalia Fearnside. “Se não chover na época em que tem que chover, os reservatórios
não serão recarregados ao longo do ano”, completa. Esse tem sido o drama em 2014.

Desmatamento que vai, volta 

Poder contar com a maior floresta tropical do mundo, inclusive em relação aos recursos hídricos, é um privilégio. Pouquíssimo valorizado. Nos últimos 40 anos, derrubamos 42 bilhões de árvores. Além disso, devido às queimadas, existe mais de 1 milhão de km² de floresta morta, degradada. O que não se imaginava é que uma revanche em forma de seca chegaria tão rápido. “Hoje, estamos vivendo a reciprocidade da inconsequência”, atesta Nobre. Há mais de 20 anos, estudos alertavam para esse perigo. Em 1991, o climatologista Carlos Nobre, irmão de Antonio e também do INPE, comandou uma simulação para avaliar os impactos no clima da mudança do uso da terra. Constataram que, se a floresta fosse substituída por plantações ou pastagens, a temperatura média da superfície aumentaria cerca de 2,5 ºC, a evapotranspiração das plantas diminuiria 30% e as chuvas cairiam 20%. Também se previa uma ampliação das estações secas na área amazônica. Hoje, com quase metade da floresta original danificada, tais efeitos parecem ter vindo à tona.
“O desmatamento zero é para ontem. Chegamos a níveis climáticos críticos. Precisamos começar a replantar o que já perdemos”, aponta Antonio Nobre. Apesar da urgência, as perspectivas não são animadoras. Só na região amazônica, há mais de 40 projetos do Programa de Aceleração do Crescimento do Governo Federal só no quesito geração de energia. São usinas, barragens e outras medidas que causam inundações e corte de árvores e que afetam diretamente populações indígenas. Os projetos de estradas também são preocupantes. A recuperação da Rodovia Manaus-Porto Velho (BR-319), abandonada desde a década de 1980 por falta de manuntenção, também consta no PAC. De acordo com Philip Fearnside, o projeto é um risco para a Amazônia. “Uma estrada valoriza demais a terra, e especulação gera desmatamento e favorece a grilagem”, explica. O mesmo acontece com a Rodovia Santarém-Cuiabá (BR-163), com mais de 1.700 km de extensão.

“A estrada vai ser recuperada para facilitar o transporte da soja produzida no Mato Grosso”, aponta Fearnside, sobre uma das áreas amazônicas que mais sofrem com o agronegócio. “A terra valoriza tanto que pecuaristas estão vendendo suas terras para produtores de soja do Sul. Por sua vez, isso tem aumentado muito o desmatamento no Pará, com a liberação de terrenos para a criação de gado desses pecuaristas”, critica o especialista. Ele também destaca o fortalecimento da bancada ruralista no Congresso, após as eleições deste ano.

Desmatamento e degradação:

Clima em crise

Neste verão, os rios voadores não avançaram sobre o Sudeste; tampouco as frentes frias. A ilha de calor instalada sobre a região, característica de uma urbanização extrema, cria bloqueios que afastam as chuvas. Por isso, a água esborrou na borda dessa bolha quente, gerando chuvas acima da média no Sul e países vizinhos. Hoje, há registros de seca em todos os Estados brasileiros. Em alguns deles, a seca é “excepcional”, ainda mais grave do que a “extrema”. O quadro já era grave no ano passado, quando o Nordeste viveu a pior seca dos últimos 50 anos, inserindo o Brasil no mapa de eventos climáticos extremos, da Organização Mundial de Meteorologia.

De acordo com o físico especialista em ciências atmosféricas Alexandre Araújo Costa, da Universidade Estadual do Ceará, o agravamento de secas e das cheias está relacionado ao aumento da temperatura na atmosfera. Aquecida, ela se expande, fazendo com que seja necessário reunir mais vapor d’água para formar nuvens. “Esse processo demanda mais tempo, portanto tende a prolongar os períodos de estiagem. Por outro lado, as nuvens se formam a partir de uma quantidade maior de vapor d’água, fazendo com que os eventos de precipitações se tornem mais intensos. Um planeta mais quente é um planeta de extremos”, explica.

Para a filósofa e ecologista Déborah Danowski, que lançou recentemente o livro Há mundo por vir? Ensaio sobre os medos e os fins, com seu marido e antropólogo Eduardo Viveiros de Castro, entramos num caminho sem volta. “A crise climática não pode mais ser evitada. Se cortássemos agora as emissões de CO₂, a Terra ainda iria se aquecer aproximadamente 1 ºC. Isso porque já jogamos no ar uma quantidade tão grande, que muito dele ainda nem foi absorvido”, aponta. O que não quer dizer que não haja muito o que fazer. Para ela, o primeiro passo é repensar os modelos econômicos de crescimento e consumo. “O que nos cabe é tentar mitigar as causas que levam ao aprofundamento das mudanças climáticas e, ao mesmo tempo, nos adaptar à vida em um mundo mais difícil ecologicamente.”

Estamos todos ilhados
Seja pelo excesso de calor ou pelas enchentes. Mais filosoficamente: não temos saída para o clima. Os eventos extremos parecem estar se tornando uma realidade no Brasil.

Aquecimento global pode minar luta contra a pobreza, alerta Banco Mundial (Carta Capital)

7/11/2014 – 11h38

por Redação da Deutsche Welle

agricola Aquecimento global pode minar luta contra a pobreza, alerta Banco Mundial

Em novo relatório sobre mudanças climáticas, instituição prevê grave impacto na agricultura. No Brasil, a produção de soja pode ser reduzida em 70% até 2050

As mudanças climáticas podem levar a retrocessos nos esforços para derrotar a pobreza extrema em todo o mundo, advertiu o Banco Mundial neste domingo 23, ao divulgar um relatório sobre os impactos do aquecimento global.

No documento, intitulado Reduzam o calor: enfrentando a nova normalidade climática (em tradução livre), o banco afirma que elevações bruscas de temperatura devem reduzir profundamente a produtividade nas lavouras e o abastecimento de água em muitas áreas.

O relatório, que foca em impactos regionais específicos do aquecimento global, prevê efeitos no Brasil. Um aumento de até 2 °C na temperatura média em relação aos tempos pré-industriais levaria a uma redução da produção agrícola do país – de até 70% para a soja e 50% para o trigo em 2050, diz o documento.

O Banco Mundial estima que, em 2050, a temperatura média seja 1,5 °C mais alta do que a registrada na era pré-industrial, com base no impacto das emissões de gases de efeito estufa do passado e atualmente.

“Sem uma ação forte e rápida, o aquecimento poderia exceder 1,5 °C ou 2 °C, e o impacto decorrente poderia piorar significativamente a pobreza intra e intergeracional em várias regiões do mundo”, diz o relatório.

Quanto ao nível do mar, o documento afirma que este continuará subindo por séculos, visto que as grandes capas de gelo da Groenlândia e da Antártica vêm derretendo lentamente. Se as temperaturas se mantiverem nos níveis atuais, os mares subirão 2,3 metros nos próximos 2 mil anos, aponta o estudo.

Entre outros efeitos citados, cidades andinas estariam ameaçadas pelo derretimento de geleiras, e comunidades do Caribe e da costa ocidental da Índia poderiam ver diminuir seus suprimentos de peixes. Na Macedônia, o cultivo de milho, trigo e uva seria reduzido em 50 %.

Ações urgentes

Sem ações coordenadas, o perigo é que o aumento da temperatura média global chegue a 4 °C até o fim do século, um cenário descrito pelo Banco Mundial como “um mundo assustador de aumento de riscos e instabilidade global”.

“Acabar com a pobreza, aumentar a prosperidade global e reduzir a desigualdade no mundo, o que já é difícil, vai ser muito mais difícil com um aquecimento de 2 °C, disse o presidente do Banco Mundial, Jim Yong Kim. “Mas com [um aumento de] 4 °C, há sérias dúvidas de que essas metas possam ser alcançadas.”

Os piores efeitos do aquecimento global poderiam ser evitados através da redução das emissões de gases de efeito estufa, reitera o relatório.

Representantes de quase 200 países se reunirão em breve para a próxima Conferência Mundial do Clima. Realizado no Peru entre os dias 1º e 12 de dezembro, o evento tem como objetivo a definição das bases de um acordo global de limitações de emissões de gases do efeito estufa. Espera-se que o acordo seja firmado em Paris em 2015.

NM/afp/rtr

* Publicado originalmente pela Deutsche Welle e retirado do site Carta Capital.

(Carta Capital)

West Antarctic melt rate has tripled in last decade (Science Daily)

Date: December 2, 2014

Source: University of California – Irvine

Summary: A comprehensive, 21-year analysis of the fastest-melting region of Antarctica has found that the melt rate of glaciers there has tripled during the last decade.

UCI and NASA glaciologists, including Isabella Velicogna and Tyler Sutterley, have discovered that the melt rate of glaciers in West Antarctica has tripled, with the loss of a Mt. Everest’s worth of water weight every two years. Credit: Michael Studinger / NASA

A comprehensive, 21-year analysis of the fastest-melting region of Antarctica has found that the melt rate of glaciers there has tripled during the last decade.

The glaciers in the Amundsen Sea Embayment in West Antarctica are hemorrhaging ice faster than any other part of Antarctica and are the most significant Antarctic contributors to sea level rise. This study is the first to evaluate and reconcile observations from four different measurement techniques to produce an authoritative estimate of the amount and the rate of loss over the last two decades.

“The mass loss of these glaciers is increasing at an amazing rate,” said scientist Isabella Velicogna, jointly of the UC Irvine and NASA’s Jet Propulsion Laboratory. Velicogna is a coauthor of a paper on the results, which has been accepted for Dec. 5 publication in the journal Geophysical Research Letters.

Lead author Tyler Sutterley, a UCI doctoral candidate, and his team did the analysis to verify that the melting in this part of Antarctica is shifting into high gear. “Previous studies had suggested that this region is starting to change very dramatically since the 1990s, and we wanted to see how all the different techniques compared,” Sutterley said. “The remarkable agreement among the techniques gave us confidence that we are getting this right.”

The researchers reconciled measurements of the mass balance of glaciers flowing into the Amundsen Sea Embayment. Mass balance is a measure of how much ice the glaciers gain and lose over time from accumulating or melting snow, discharges of ice as icebergs, and other causes. Measurements from all four techniques were available from 2003 to 2009. Combined, the four data sets span the years 1992 to 2013.

The glaciers in the embayment lost mass throughout the entire period. The researchers calculated two separate quantities: the total amount of loss, and the changes in the rate of loss.

The total amount of loss averaged 83 gigatons per year (91.5 billion U.S. tons). By comparison, Mt. Everest weighs about 161 gigatons, meaning the Antarctic glaciers lost a Mt.-Everest’s-worth amount of water weight every two years over the last 21 years.

The rate of loss accelerated an average of 6.1 gigatons (6.7 billion U.S. tons) per year since 1992.

From 2003 to 2009, when all four observational techniques overlapped, the melt rate increased an average of 16.3 gigatons per year — almost three times the rate of increase for the full 21-year period. The total amount of loss was close to the average at 84 gigatons.

The four sets of observations include NASA’s Gravity Recovery and Climate Experiment (GRACE) satellites, laser altimetry from NASA’s Operation IceBridge airborne campaign and earlier ICESat satellite, radar altimetry from the European Space Agency’s Envisat satellite, and mass budget analyses using radars and the University of Utrecht’s Regional Atmospheric Climate Model.

The scientists noted that glacier and ice sheet behavior worldwide is by far the greatest uncertainty in predicting future sea level. “We have an excellent observing network now. It’s critical that we maintain this network to continue monitoring the changes,” Velicogna said, “because the changes are proceeding very fast.”


Journal Reference:

  1. Tyler C. Sutterley, Isabella Velicogna, Eric Rignot, Jeremie Mouginot, Thomas Flament, Michiel R. van den Broeke, Jan M. van Wessem, Carleen H. Reijmer. Mass loss of the Amundsen Sea Embayment of West Antarctica from four independent techniquesGeophysical Research Letters, 2014; DOI: 10.1002/2014GL061940

As previsões de Isaac Asimov para 2014, 50 anos atrás (Pragmatismo Político)

03/JAN/2014 ÀS 18:42

Escritor e professor Isaac Asimov fez, há 50 anos, surpreendentes previsões de como seria o mundo em 2014

isaac asimov previsões 2014

Professor Isaac Asimov fez impressionantes previsões para 2014… há 50 anos (Reprodução)

Em 1964, durante a Feira Mundial de Nova York, o New York Times convidou o escritor de ficção científica e professor de bioquímica Isaac Asimov a fazer previsões de como seria o mundo 50 anos depois, ou seja, este ano. Asimov escreveu mais de 500 trabalhos, entre romances, contos, teses e artigos e sempre se caracterizou por fazer projeções acuradas sobre o futuro. As previsões do escritor, que morreu em 1991, são surpreendentes.

Cozinha

Asimov prevê que os equipamentos de culinária pouparão a humanidade de fazer trabalhos tediosos. “As cozinhas estão equipadas para fazer “auto-refeições”. “Almoços e jantares serão feitos com comidas semi-preparadas, que poderão ser conservadas em freezer. Em 2014, as cozinhas terão equipamentos capazes de preparar uma refeição individual em alguns poucos segundos”. Só faltou mesmo ele usar a palavra “microondas”.

Computadores

O escritor previu um mundo repleto de computadores capazes de fazer as mais complexas tarefas. “Em 2014, haverá mini computadores instalados em robôs”, escreve ele, no que parece ser uma alusão aos chips. E garantiu que será possível fazer traduções com uma dessas máquinas, como se previsse a existência do Google Translator.

Comunicação

As ligações telefônicas terão imagem e voz, garantiu Asimov em seu texto. “As telas serão usadas não apenas para ver pessoas, mas também para estudar documentos e fotos e ler livros”. E prevê que satélites em órbita tornarão possível fazer conexões telefônicas para qualquer lugar da Terra e até mesmo “saber o clima na Antártica”. Mas em Terra haverá outras soluções. “A conexão terá que ser feita em tubos de plástico, para evitar a interferência atmosférica”, escreve ele, como se já conhecesse a fibra ótica.

Cinema

Asimov previu que em 2014 o cinema seria apresentando em 3-D, mas garantiu que algumas coisas nunca mudariam: “Continuarão a existir filas de três horas para ver o filme”.

Energia

Ele previu que já existiriam algumas usinas experimentais produzindo energia com a fusão nuclear. Errou. Mas acertou quando vaticinou a existência de baterias recarregáveis para alimentar muitos aparelhos elétricos de nossa vida cotidiana. Mais ainda: “Uma vez usadas, as baterias só poderão ser recolhidas por agentes autorizados pelos fabricantes” — o que deveria acontecer, mas nem sempre acontece.

Veículos

Asimov erra feio nas suas previsões relacionadas ao transporte.

Ele acreditou que carros e caminhões pudessem circular sem encostar no chão ou água, deslizando a uma altura de “um ou dois metros”. E que não haveria mais necessidade de construir pontes, “já que os carros seriam capazes de circular sobre as águas, mas serão desencorajados a fazer isso pelas autoridades”.

Marte

Para o escritor, em 2014 o homem já terá chegado a Marte com espaçonaves não tripuladas, embora “já estivesse sendo planejada uma expedição com pessoas e até a formação de uma colônia marciana”. O que nos faz lembrar da proposta pública de uma viagem a Marte só de ida, feita recentemente, para formar a primeira colônia no planeta.

Televisão

Asimov cita a provável existência de “televisões de parede”, como se pudesse prever as telas planas, mas acredita que os aparelhos serão substituídos por cubos capazes de fazer transmissões em 3-D, visíveis de qualquer ângulo.

População

O escritor previu que a população mundial seria de 6,5 bilhões em 2014 (já passou dos 7 bilhões) e que áreas desérticas e geladas seriam ocupadas por cidades — o que não é exatamente errado. Mas preconizou, também, a má divisão de renda: “Uma grande parte da humanidade não terá acesso à tecnologia existente e, embora melhor do que hoje, estará muito defasada em relação às populações mais privilegiados do mundo. Nesse sentido, andaremos para trás”, escreve ele.

Comida

“Em 2014 será comum a ‘carne falsa’, feita com vegetais, e que não será exatamente ruim, mas haverá muita resistência a essa inovação”, escreve Asimov, referindo-se provavelmente aos hambúrgueres de soja.

Expectativa de vida

O escritor preconizou problemas devido à super população do planeta, atribuindo-a aos avanços da medicina: “O uso de aparelhos capazes de substituir o coração e outros órgãos vai elevar a expectativa de vida, em algumas partes do planeta, a 85 anos de idade”. A média mundial subiu de 52 anos em 1964 para 70 anos em 2012. Em alguns países, como Japão, Suíça e Austrália, já está em 82 anos.

Escola

“As escolas do futuro”, escreve Asimov, “apresentarão aulas em circuitos fechados de TV e todos os alunos aprenderão os fundamentos da tecnologia dos computadores”. O que ele não previu foi a possibilidade de os alunos ensinarem os professores quando se trata de uso de computadores — como, aliás, ocorre em algumas escolas públicas brasileiras.

Trabalho

Asimov previu uma população entediada, como sinal de uma doença que “se alastra a cada ano, aumentando de intensidade, o que terá consequência mentais, emocionais e sociais”. Depressão? “Ouso dizer”, prossegue ele, “que a psiquiatria será a especialidade médica mais importante em 2014. Aqueles poucos que puderem se envolver em trabalhos mais criativos formarão a elite da humanidade”.

Brasil registra um grande terremoto a cada 50 anos (O Globo)

Cálculo é de novo centro de pesquisa, que vai detectar tremores em 80 pontos do país

Quatro instituições unem-se esta sexta-feira para formar o Serviço Sismológico Nacional. Os centros de pesquisa calculam que o país registra um terremoto de magnitude maior do que 6 graus na escala Richter a cada 50 anos, aproximadamente — o último foi em 1955, no noroeste de Mato Grosso, com índice de 6,2 graus. O tremor foi sentido em Cuiabá, a 370 km de distância.

As universidades de São Paulo (USP), de Brasília (UnB) e a Federal do Rio Grande do Norte (UFRN) trabalharão sob a coordenação do Observatório Nacional. O grupo mantém cerca de 80 estações sismológicas no país e registros iniciados em 1767. A mais recente foi inaugurada no mês passado, na Ilha de Trindade, a cerca de 1,2 mil quilômetros ao leste de Vitória, no Espírito Santo.

Leia mais sobre esse assunto em http://oglobo.globo.com/sociedade/ciencia/brasil-registra-um-grande-terremoto-cada-50-anos-14681727#ixzz3KMSImin8

(Renato Grandelle / O Globo)

Modeling the past to understand the future of a stronger El Niño (Science Daily)

Date:

November 26, 2014

Source:

University of Wisconsin-Madison

Summary:

El Nino is not a contemporary phenomenon; it’s long been the Earth’s dominant source of year-to-year climate fluctuation. But as the climate warms and the feedbacks that drive the cycle change, researchers want to know how El Nino will respond.

141126132628-large

Using state-of-the-art computer models maintained at the National Center for Atmospheric Research, researchers determined that El Niño has intensified over the last 6,000 years. This pier and cafe are in Ocean Beach, California. Credit: Jon Sullivan

It was fishermen off the coast of Peru who first recognized the anomaly, hundreds of years ago. Every so often, their usually cold, nutrient-rich water would turn warm and the fish they depended on would disappear. Then there was the ceaseless rain.

They called it “El Nino,” The Boy — or Christmas Boy — because of its timing near the holiday each time it returned, every three to seven years.

El Nino is not a contemporary phenomenon; it’s long been Earth’s dominant source of year-to-year climate fluctuation. But as the climate warms and the feedbacks that drive the cycle change, researchers want to know how El Nino will respond. A team of researchers led by the University of Wisconsin’s Zhengyu Liu published the latest findings in this quest Nov. 27, 2014 in Nature.

“We can’t see the future; the only thing we can do is examine the past,” says Liu, a professor in the Department of Atmospheric and Oceanic Sciences. “The question people are interested in now is whether it’s going to be stronger or weaker, and this requires us to first check if our model can simulate its past history.”

The study examines what has influenced El Nino over the last 21,000 years in order to understand its future and to prepare for the consequences. It is valuable knowledge for scientists, land managers, policymakers and many others, as people across the globe focus on adapting to a changing climate.

Using state-of-the-art computer models maintained at the National Center for Atmospheric Research in Colorado, the researchers — also from Peking University in China, the University of Hawaii at Manoa, and Georgia Institute of Technology — determined that El Nino has intensified over the last 6,000 years.

The findings corroborate data from previous studies, which relied on observations like historical sediments off the Central American coast and changes in fossilized coral. During warm, rainy El Nino years, the coastal sediments consist of larger mixed deposits of lighter color, and the coral provides a unique signature, akin to rings on a tree.

“There have been some observations that El Nino has been changing,” says Liu, also a professor in the Nelson Institute for Environmental Studies Center for Climatic Research. “Previous studies seem to indicate El Nino has increased over the last 5,000 to 7,000 years.”

But unlike previous studies, the new model provides a continuous look at the long history of El Nino, rather than a snapshot in time.

It examines the large-scale influences that have impacted the strength of El Nino over the last 21,000 years, such as atmospheric carbon dioxide, ice sheet melting and changes to Earth’s orbit.

El Nino is driven by an intricate tango between the ocean and Earth’s atmosphere. In non-El Nino years, trade winds over the tropical Pacific Ocean drive the seas westward, from the coast of Central America toward Indonesia, adding a thick, warm layer to the surface of the western part of the ocean while cooler water rises to the surface in the east. This brings rain to the west and dry conditions to the east.

During El Nino, the trade winds relax and the sea surface temperature differences between the Western and Eastern Pacific Ocean are diminished. This alters the heat distribution in both the water and the air in each region, forcing a cascade of global climate-related changes.

“It has an impact on Madison winter temperatures — when Peru is warm, it’s warm here,” says Liu. “It has global impact. If there are changes in the future, will it change the pattern?”

Before the start of the Holocene — which began roughly 12,000 years ago — pulses of melting water during deglaciation most strongly influenced El Nino, the study found. But since that time, changes in Earth’s orbit have played the greatest role in intensifying it.

Like an uptick in tempo, the feedbacks between ocean and atmosphere — such as how wind and seas interact — have grown stronger.

However, even with the best data available, some features of the simulated El Nino — especially prior to 6,000 years ago — can’t be tested unambiguously, Liu says. The current observational data feeding the model is sparse and the resolution too low to pick up subtle shifts in El Nino over the millennia.

The study findings indicate better observational data is needed to refine the science, like more coral samples and sediment measurements from different locations in the Central Pacific. Like all science, better understanding what drives El Nino and how it might change is a process, and one that will continue to evolve over time.

“It’s really an open door; we need more data to get a more significant model,” he says. “With this study, we are providing the first benchmark for the next five, 10, 20 years into the future.”

Story Source:

The above story is based on materials provided by University of Wisconsin-Madison. The original article was written by Kelly April Tyrrell. Note: Materials may be edited for content and length.

Journal Reference:

  1. Zhengyu Liu, Zhengyao Lu, Xinyu Wen, B. L. Otto-Bliesner, A. Timmermann, K. M. Cobb. Evolution and forcing mechanisms of El Niño over the past 21,000 years. Nature, 2014; 515 (7528): 550 DOI: 10.1038/nature13963

Crise da água: “A situação é alarmante, estamos em perigo. Vai virar calamidade” (SpressoSP)

alckmin-falta-de-agua


Funcionário da Sabesp e diretor do Sintaema alerta para a contínua queda dos reservatórios e recomenda, ao governo de São Paulo e Sabesp, medida imediata para tentar evitar o colapso. “Declarar um racionamento que falte água para pobre e rico, ao invés de fazer um rodízio nas periferias”

Por Igor Carvalho

Nesta segunda-feira (24), o Sistema Cantareira amanheceu com 9,4% de sua capacidade. Já são dez dias de quedas sucessivas, que colocam o abastecimento de São Paulo em risco. Anderson Guahy, técnico em gestão da Sabesp e diretor de formação do Sindicato dos Trabalhadores em Água, Esgoto e Meio Ambiente de São Paulo (Sintaema), demonstrou preocupação sobre a crise hídrica paulista e alerta a população.

“A situação é alarmante, estamos em perigo. Vai virar calamidade, se não forem tomadas medidas imediatas pelo alto comando da Sabesp e pelo governo de São Paulo”, alerta o técnico.

Guahy explicou que os constantes cortes no fornecimento de água nas regiões periféricas é de conhecimento da Sabesp e poderia ser evitado. “A Sabesp tem que declarar um racionamento que falte água para pobre e rico, ao invés de fazer um rodízio nas periferias”

Uma previsão para o fim dos recursos hídricos no Cantareira ainda é “precipitado”, explica o técnico da Sabesp. “O nível de utilização vem caindo muito, mas não é o único fator, se fizer muito calor, por exemplo, a água pode evaporar mais rápido.”

Temperaturas do verão vão superar as de 2014, diz instituto (O Globo)

JC, 5070, 24 de novembro de 2014

Aumento seria de até 2 graus Celsius; fenômeno El Niño pode provocar mais chuvas

Daqui a um mês começa a estação mais popular do Rio. E o verão de 2015 não deve dar trégua para quem detesta calor. De acordo com o Instituto Climatempo, o primeiro bimestre do ano que vem terá temperaturas ainda mais elevadas do que as registradas no ano passado. Em janeiro, a média será de 32ºC. Em fevereiro, 36ºC. Em 2014, a média não superou os 34ºC.

Leia mais sobre esse assunto em: http://oglobo.globo.com/sociedade/ciencia/temperaturas-do-verao-vao-superar-as-de-2014-diz-instituto-14635118#ixzz3K03TB9r8

(Renato Grandelle, com Agências Internacionais / O Globo)

O possível colapso do Cantareira (Estadão)

O possível colapso do Cantareira

22.11.2014 | 03:00

O Estado de S. Paulo

A Companhia de Saneamento Básico do Estado de São Paulo (Sabesp) e o governo estadual estão se comportando como médicos do século passado. Sabendo que a doença é séria, se recusam a discutir o futuro com o paciente. Fazem o que podem para curar o doente, mas o poupam da angústia de enfrentar a realidade. Hoje, os médicos são educados para contar a verdade. Isso causa angústia, mas ao menos não priva o doente da liberdade de decidir como e onde quer viver enquanto espera o desfecho.

O Sistema Cantareira está se aproximando rapidamente do colapso. Quando não for possível retirar mais água das represas, 6 milhões de pessoas ficarão literalmente sem uma gota de água. É a parte da população de São Paulo que só pode ser abastecida pelo Cantareira. Esta é uma possibilidade real, cuja probabilidade é difícil de calcular. É por isso que vou tentar descrever de maneira objetiva a realidade hoje, deixando para os leitores as especulações sobre o futuro. Todos as informações foram extraídas de documentos oficiais da Agencia Nacional de Águas (ANA), do Departamento de Águas e Energia Elétrica (DAEE) e da Sabesp.

Gráficos

O Sistema Cantareira é composto por três represas. As duas maiores, Jaguari/Jacareí e Atibainha, representam 92% do sistema. Quando cheia até a borda, a Represa Jaguari/Jacareí (acompanhe pelo quadro nesta página) atinge a conta 844 (ou seja, 844 metros acima do nível do mar), armazena 1,047 bilhão de m3 de água (um m3 são 1.000 litros) e cobre uma área de 50 km2 (cada km2 corresponde a 100 quarteirões). No último dia 18, ela estava na cota 815,5, tendo baixado 28,5 metros, e continha somente 140 milhões de m3 de água (13,3% do máximo). Sua superfície cobria somente uma área de 16 km2, deixando 34 km2 de terra e lama expostos (é o que você pode ver nas fotografias publicadas diariamente).

Neste dia, foi iniciada a retirada da segunda fração da reserva técnica – também chamada de volume morto -, o que vai reduzir o volume para 42 milhões de m3 (4% do máximo) e reduzir a área coberta por água para 8 km2. O barro vai cobrir 84% da área da represa (o quadro mostra os mesmos números para a Represa do Atibainha).

É muito difícil acreditar que seja possível extrair dessas represas uma reserva técnica 3. Se ela existir, será muito pequena. A reserva técnica 1, de 182,5 milhões de m3, já foi consumida. A reserva técnica 2, de 106 milhões de m3, já começou a ser retirada da Represa de Jaguari/Jacareí e praticamente já foi toda retirada da Represa do Atibainha.

Os dados mostram que ainda restam 232 milhões de m3 nessas duas represas, sendo possível retirar 99 milhões de m3. Grande parte do restante não será possível utilizar.

Quando o nível da água baixou para 820, a água deixou de fluir por gravidade para o túnel. Para evitar a interrupção do fornecimento, foi construído um dique em volta do túnel. Grandes bombas flutuantes transportam a água para o interior do dique, de onde ela flui pelo túnel. Dessa maneira, foi possível retirar a chamada reserva técnica 1. Quando a água da parte de fora do dique acabou, um segundo dique foi construído, isolando um grande braço da represa para permitir a retirada da reserva técnica 2. Nesse segundo dique foi instalado um outro grupo de bombas. Hoje, as bombas do segundo dique transportam a água para esse braço isolado da represa e a água chega no primeiro dique, onde é bombeada novamente para poder alcançar a entrada do túnel. Como os locais em que a Sabesp decidiu instalar esses dois grupos de bombas não têm energia elétrica, grandes geradores movidos a diesel foram transportados até a proximidade das bombas. Caminhões-tanque levam o diesel por estradas precárias para manter os geradores ligados 24 horas. É desse esquema improvisado que agora dependem os 6 milhões de pessoas que recebem água do Sistema Cantareira.

O sistema de bombas é capaz de retirar até 20 m3 por segundo da represa (20 pequenas caixas de água por segundo). Mas o problema é que, atualmente, só chegam às represas, trazidos pelos rios, 6 m3 por segundo de água. Assim, a cada segundo, 14 m3 a mais do que chega são retirados da represa. A rápida velocidade de perda das reservas significa que a, cada dia, a represa perde 1,2 milhão de m3 de água.

Mantido esse ritmo de perdas, é fácil calcular que a duração das reservas atuais é de 79 dias até o término da reserva técnica 2 e de 6 meses até que toda a água existente na represa se esgote.

Para que esse prazo seja estendido é necessário que a entrada de água na represa aumente. Se os atuais 6 m3 por segundo aumentarem para um número menor do que 20 m3 por segundo, a represa vai continuar a ser delapidada, mais lentamente. Se ela chegar a 20 m3 por segundo (o mesmo que as bombas retiram hoje), a represa vai parar de esvaziar. Mas são necessários mais de 20 m3 por segundo, um aumento constante de 4 vezes no fluxo atual dos rios, para que a represa volte a encher.

O problema é que isso não está ocorrendo nestes dois primeiros meses de chuva deste final de ano (outubro e novembro) e não ocorreu nenhuma vez nos meses de chuva do início de 2014 (janeiro, fevereiro, março e abril).

É claro que pode chover, e espero que chova muito, mas se o futuro próximo se comportar como o passado próximo, 6 milhões de pessoas ficarão sem água. E, infelizmente, é impossível abastecer 6 milhões com caminhões-pipa. Como e onde essas pessoas vão viver até que o Cantareira se recupere ou outras represas tomem seu lugar? É isso que eu gostaria de saber.

MAIS INFORMAÇÕES: BOLETIM ANA/DAEE DE MONITORAMENTO DO SISTEMA CANTAREIRA (18/11/2014). PROJEÇÃO DE DEMANDA DO SISTEMA CANTAREIRA, SABESP, 2014, E DADOS DE REFERÊNCIA ACERCA DA OUTORGA DO SISTEMA CANTAREIRA ANA/DAEE, 2013

Premonição multiplica pedido de folga de quem trabalha na Paulista (UOL)

Rodrigo Bertolotto

Do UOL, em São Paulo

19/11/201416h53 

Se você é supersticioso, usa muito rede social e trabalha na área da avenida Paulista, a próxima quarta-feira (26) é um bom dia para pedir uma folga ou para faltar ao serviço. Pelo menos, é isso o que está acontecendo com muita gente que trabalha no centro financeiro do Brasil.

“Esse vidente é de uma insanidade incrível. Ele podia, pelo menos, consultar um aeronauta para perceber que é impossível que isso aconteça porque as rotas de aviões não passam pela Paulista”, afirma o ex-piloto de avião José Carlos de Araújo, que trabalha na região.

O clima de temor começou com a previsão do vidente Juscelino Nóbrega da Luz, registrada em um cartório no centro da cidade. Na premonição documentada, um avião decolará do aeroporto de Congonhas com destino para Brasília e baterá contra um edifício, perto da esquina da avenida Paulista com a alameda Campinas.

Divulgação

Carta de síndico de um prédio na avenida Paulista que cita a previsão do vidente Juscelino Nóbrega da Luz

A previsão bombou nas redes sociais e nos bate-papos de rua e de elevador. Resultado: muitos empregados devem faltar e muitos comércios e escritórios devem fechar ou trabalhar com pouca gente no dia 26 de novembro. “Sou gerente e tenho de dar o exemplo, mas tenho um pouco de medo. Muitas meninas que trabalham comigo já confirmaram que não vem”, afirma Simone França, que gerencia uma clínica de estética no edifício Barão do Serro Azul.

O síndico desse edifício enviou aos condôminos do prédio comercial um alerta sobre o prognóstico de um acidente aéreo no local na manhã do dia 26 de novembro. O aviso sobre a premonição foi distribuído na terça-feira (18) por Severino Alves de Lima, 67. Ele disse que, mesmo não acreditando, escreveu o comunicado apenas para informar.

Tamanho é o burburinho que até a Aeronáutica já informou que nenhum avião decola de Congonhas para Brasília tem como rota sobrevoar a Paulista.

“Essas visões abalam o psicológico da gente. Eu não vou fazer entrega aqui na Paulista na quarta nem ferrando”, fala o motoboy Tiago Arruda, quando saia do edifício Barão do Serro Azul. O vidente teve a visão em 2005 e desde lá vem avisando os trabalhadores e moradores da região. Juscelino ganhou fama este ano por uma suposta previsão da morte em acidente aéreo do então presidenciável Eduardo Campos.

CLARIVIDENTE AFIRMA QUE AVIÃO CAIRÁ NA AVENIDA PAULISTA EM NOVEMBRO DE 2014

http://player.mais.uol.com.br/embed_v2.swf?mediaId=14987648&ver=1

*   *   *

Número de voo da TAM é alterado após previsão de tragédia em SP (Folha de S.Paulo)

DE SÃO PAULO

20/11/2014 16h53

O número do voo da TAM previsto para sair próxima quarta-feira (26) de São Paulo para Brasília foi alterado após um síndico alertar para a previsão de queda de um avião na capital paulista.

De acordo com o vidente Juscelino Nóbrega da Luz, o avião que faria o voo JJ3720 atingiria um edifício comercial no cruzamento da Paulista com a alameda Campinas, próximo ao hotel Maksoud Plaza. Todas as passagens já foram vendidas pela companhia.

O número do voo, entretanto, foi alterado para JJ4732 apenas no dia em que está previsto o acidente. A TAM informou que a alteração foi feita porque a empresa “considerou o alerta e permanecerá atenta às operações no período citado”. A empresa disse ainda que “realiza manutenções preventivas com regularidade em toda a sua frota” e as “operações aéreas da empresa estão certificadas pelas principais autoridades aeronáuticas do mundo.”

O vidente diz que sonhou com o acidente em 2005 e desde então tem alertado o condomínio sobre suas premonições.

Rubens Cavallari/Folhapress
Condomínio que, segundo vidente, deve ser atingido por avião no próximo dia 26

No comunicado, o síndico de outro prédio nas proximidades Severino Lima diz que o fez para “ficar com a consciência tranquila”, decidindo avisar sobre a possibilidade de um avião atingir um prédio no cruzamento da Paulista com a alameda Campinas.

Lima diz que espera que as previsões não se concretizem e que não quis ser alarmista. Questionado se estaria no prédio no dia 26, ele diz que sim. “Não sou crédulo nem incrédulo. As pessoas que têm esse dom acertam e erram. Na minha convicção, não deve acontecer nada, mas mesmo assim decidi informar.”

Reprodução

Coal Rush in India Could Tip Balance on Climate Change (N.Y.Times)

A mine in Jharkhand State. India’s coal rush could push the world past the brink of irreversible climate change, scientists say. CreditKuni Takahashi for The New York Times 

DHANBAD, India — Decades of strip mining have left this town in the heart of India’s coal fields a fiery moonscape, with mountains of black slag, sulfurous air and sickened residents.

But rather than reclaim these hills or rethink their exploitation, the government is digging deeper in a coal rush that could push the world into irreversible climate change and make India’s cities, already among the world’s most polluted, even more unlivable, scientists say.

“If India goes deeper and deeper into coal, we’re all doomed,” said Veerabhadran Ramanathan, director of the Center for Atmospheric Sciences at the Scripps Institution of Oceanography and one of the world’s top climate scientists. “And no place will suffer more than India.”

India’s coal mining plans may represent the biggest obstacle to a global climate pact to be negotiated at a conference in Paris next year. While the United States and China announced a landmark agreement that includes new targets for carbon emissions, and Europe has pledged to reduce greenhouse gas emissions by 40 percent, India, the world’s third-largest emitter, has shown no appetite for such a pledge.

“India’s development imperatives cannot be sacrificed at the altar of potential climate changes many years in the future,” India’s power minister, Piyush Goyal, said at a recent conference in New Delhi in response to a question. “The West will have to recognize we have the needs of the poor.”

Mr. Goyal has promised to double India’s use of domestic coal from 565 million tons last year to more than a billion tons by 2019, and he is trying to sell coal-mining licenses as swiftly as possible after years of delay. The government has signaled that it may denationalize commercial coal mining to accelerate extraction.

“India is the biggest challenge in global climate negotiations, not China,” said Durwood Zaelke, president of the Institute for Governance & Sustainable Development.

Prime Minister Narendra Modi has also vowed to build a vast array of solar power stations, and projects are already springing up in India’s sun-scorched west.

But India’s coal rush could push the world past the brink of irreversible climate change, with India among the worst affected, scientists say.

Indian cities are already the world’s most polluted, with Delhi’s air almost three times more toxic than Beijing’s by one crucial measure. An estimated 37 million Indians could be displaced by rising seas by 2050, far more than in any other country. India’s megacities are among the world’s hottest, with springtime temperatures in Delhi reaching 120 degrees. Traffic, which will only increase with new mining activity, is already the world’s most deadly. And half of Indians are farmers who rely on water from melting Himalayan glaciers and an increasingly fitful monsoons.

India’s coal is mostly of poor quality with a high ash content that makes it roughly twice as polluting as coal from the West. And while China gets 90 percent of its coal from underground mines, 90 percent of India’s coal is from strip mines, which are far more environmentally costly. In a country three times more densely populated than China, India’s mines and power plants directly affect millions of residents. Mercury poisoning has cursed generations of villagers in places like Bagesati, in Uttar Pradesh, with contorted bodies, decaying teeth and mental disorders.

The city of Dhanbad resembles a postapocalyptic movie set, with villages surrounded by barren slag heaps half-obscured by acrid smoke spewing from a century-old fire slowly burning through buried coal seams. Mining and fire cause subsidence that swallows homes, with inhabitants’ bodies sometimes never found.

Suffering widespread respiratory and skin disorders, residents accuse the government of allowing fires to burn and allowing pollution to poison them as a way of pushing people off land needed for India’s coal rush.

“The government wants more coal, but they are throwing their own people away to get it,” said Ashok Agarwal of the Save Jharia Coal Field Committee, a citizens’ group.

T. K. Lahiry, chairman of Bharat Coking Coal, a government-owned company that controls much of the Jharia region, denied neglecting fires and pollution but readily agreed that tens of thousands of residents must be displaced for India to realize its coal needs. Evictions are done too slowly, he said.

 Hauling coal by bicycle in Jharkhand in eastern India. The country plans to double its use of domestic coal by 2019 as part of efforts to reduce poverty. CreditKuni Takahashi for The New York Times 

“We need to shift these people to corporate villages far from the coal fields,” Mr. Lahiry said during an interview in his large office.

With land scarce, Bharat Coking is digging deeper at mines it already controls. On a tour of one huge strip mine, officials said they had recently purchased two mammoth Russian mining shovels to more than triple annual production to 10 million tons. The shovels are clawing coal from a 420-foot-deep pit, with huge trucks piling slag in flat-topped mountains. The deeper the mine goes, the more polluting the coal produced.

India has the world’s fifth-largest reserves of coal but little domestic oil or natural gas production. The country went on a coal-fired power plant building spree over the last five years, increasing capacity by 73 percent. But coal mining grew just 6 percent, leading to expensive coal imports, idle plants and widespread blackouts. Nearly 300 million Indians do not have access to electricity, and millions more get it only sporadically.

“India is going to use coal because that’s what it has,” said Chandra Bhushan, deputy director of the Delhi-based Center for Science and Environment, a prominent environmental group. “Its strategy is ‘all of the above,’ just like in the U.S.”

Each Indian consumes on average 7 percent of the energy used by an American, and Indian officials dismiss critics from wealthy countries.

“I don’t want to use the word ‘pontificate’ when talking about these people, but it would be reasonable to expect more fairness in the discussion and a recognition of India’s need to reach the development of the West,” Mr. Goyal said with a tight smile.

One reason for the widespread domestic support for India’s coal rush is the lack of awareness of just how bad the air has already become, scientists say. Smog levels that would lead to highway shutdowns and near-panic in Beijing go largely unnoticed in Delhi. Pediatric respiratory clinics are overrun, but parents largely shrug when asked about the cause of their children’s suffering. Face masks and air purifiers, ubiquitous among China’s elite, are rare here. And there are signs Indian air is rapidly worsening.

“People need to wake up to just how awful the air already is,” said Rajendra K. Pachauri, chairman of the Intergovernmental Panel on Climate Change, the world’s leading intergovernmental organization for the assessment of climate change.

India’s great hope to save both itself and the world from possible environmental dystopia can be found in the scrub grass outside the village of Neemuch, in India’s western state of Madhya Pradesh. Welspun Energy has constructed what for the moment is Asia’s largest solar plant, a $148 million silent farm of photovoltaic panels on 800 acres of barren soil.

Welspun harvests some of the most focused solar radiation in the world. Dust is so intense that workers must wash each panel every two weeks.

Under Mr. Modi, India is expected to soon underwrite a vast solar building program, and Welspun alone has plans to produce within two years more than 10 times the renewable energy it gets from its facility in Neemuch.

The benefits of solar and the environmental costs of coal are so profound that India has no other choice but to rely more on renewables, said Dr. Pachauri.

“India cannot go down China’s pathway, because the consequences for the public welfare are too horrendous,” he said.

Nível do mar avança e deve aumentar os custos no cais (A Tribuna)

Quinta-feira, 13 de Novembro de 2014 – 14h19

Leopoldo Figueiredo

O aumento do nível do mar previsto para as próximas décadas aumentará os custos do Porto de Santos, pontualmente seus gastos com dragagem e a manutenção de sua faixa de cais. Tais impactos reforçam a tese de que a expansão do complexo marítimo deve ocorrer fora da área do estuário, na região da costa, alternativa que já está em análise pela Companhia Docas do Estado de São Paulo (Codesp),a administradora do porto.

A análise foi apresentada pelo professor universitário e pesquisador Paolo Alfredini na manhã de quarta-feira (12), durante sua palestra Adaptação das operações náuticas portuárias às mudanças climáticas em curso, parte da programação da 6ª edição do Seminário e Workshop em Engenharia Oceânica (Semengo), realizada em Rio Grande (RS).

Organizado a cada dois anos pela Universidade Federal de Rio Grande (RS) e considerado um dos principais eventos do setor, o Semengo tem como tema desta edição Engenharia Costeira e Portuária. Para debater os avanços e desafios nessas duas áreas, participam pesquisadores, consultores e empresários de São Paulo, Rio de Janeiro, Rio Grande do Sul e de países como Portugal e Canadá.

N/A

Gastos com dragagem e a manutenção da faixa de cais estão entre os investimentos previstos

SITUAÇÃO CRÍTICA

Doutor em Engenharia Civil e professor da Escola Politécnica da Universidade de São Paulo (USP) e da Universidade Católica de Santos (UniSantos), Alfredini disse que o nível do mar na costa brasileira, inclusive na região de Santos, está aumentando. E a situação é ainda mais crítica. De acordo com o pesquisador, a taxa desse crescimento é cada vez maior.

Levantamento realizado por ele e pela professora Emília Arasaki aponta que o nível médio do mar subiu 25,4 centímetros por século no período de 1952 a 2007. Mas se forem analisados os 37 últimos anos (de 1970 a 2007),essa taxa sobe para 39,1 centímetros por século.

“Percebemos que o nível do mar já vinha aumentando, mas se nos concentrarmos nos últimos anos, esse aumento é ainda maior. Conforme os registros bibliográficos, a partir dos anos 70, essa velocidade tem aumentando no mundo todo”, afirmou o engenheiro.

Para as áreas urbanas da Baixada Santista, isso significa que cada vez mais, nas próximas décadas, o mar deve avançar sobre suas “terras baixas”, afetando áreas residenciais e ruas e avenidas próximas à costa (como no caso do bairro da Ponta da Praia).

No Porto de Santos, o aumento do nível do mar acaba por aumentar o transporte de sedimentos pelas correntes e pela costa, intensificando o assoreamento (a deposição de areia, entre outros materiais, em um leito, tornando-o mais raso) do estuário santista e da região da barra (onde os navios ficam fundeados, à espera de uma vaga ou do momento de atracar).

Para contrabalançar esse fenômeno e manter a profundidade, será necessário reforçar a dragagem na região, ou seja, um custo a mais para o complexo marítimo.

MANUTENÇÃO

Outro reflexo destacado por Alfredini é o maior gasto com as obras de manutenção da infraestrutura portuária, pontualmente com a faixa de cais. Isso ocorrerá pois um maior nível do mar amplia a altura das ondas e consequentemente sua energia – de acordo com o professor, a energia de uma onda é proporcional ao quadrado de sua altura. Nesse cenário, ondas mais altas vão se chocar com uma força ainda maior contra o cais, tendo mais chances de danificá-lo e reduzindo sua vida útil.

“E custo com manutenção é custo para a vida toda”, enfatizou. Segundo o pesquisador, recentemente o Governo Federal decidiu acompanhar os efeitos do aumento do nível do mar na costa brasileira. Os dados apresentados ontem integram um trabalho que Paolo Alfredini realiza para a Secretaria de Assuntos Estratégicos da Presidência da República.

SANTOSVLAKTE É A SAÍDA PARA EXPANSÃO

Ao comentar o aumento do assoreamento do canal do Porto e a necessidade cada vez maior de dragá-lo, o pesquisador Paolo Alfredini lembrou que “a dragagem de Santos está em um nível crítico, tanto que é cada vez mais difícil e trabalhoso manter a cota de ao menos 15 metros de profundidade”.

Por isso, para ele, a expansão do complexo marítimo deve ocorrer fora da área do estuário. Alfredini explica que a profundidade natural do canal (se nunca tivesse sido dragado) seria de 8 ou 9 metros. Em seus 122 anos de história como porto organizado, o complexo ampliou essa medida, chegando hoje a valores entre 13 e 15 metros em toda a sua extensão.

Ecada vez que há um aprofundamento, sua manutenção envolve maiores esforços. Para o engenheiro, esse fato e os reflexos previstos com o aumento do nível do mar mostram que a expansão do complexo marítimo deve ocorrer fora da área do estuário. E citou que a Codesp já estuda ampliar o porto com a construção de terminais offshore. “Nesse sentido, Santos terá de seguir o caminho de Roterdã e Le Havre e crescer para o mar”, afirmou, referindo-se aos projetos de Maasvlaktee Port 2000.

No primeiro, o Porto de Roterdã, na Holanda, aterrou uma área do Mar do Norte para a construção de novas instalações. No segundo, a Autoridade Portuária de Le Havre, na França, utilizou espaços aterrados na foz do Rio Sena.

Conforme reportagem exclusiva publicada em A Tribuna em 14 de setembro passado, a Codesp estuda ampliar as instalações do complexo santista com a implantação de terminais na costa. Essa pesquisa, iniciada no último ano e que está em seu estágio inicial, é desenvolvida em parceria com o Instituto de Oceanografia da USP. Devido à semelhança com a iniciativa holandesa, o projeto foi batizado como Santosvlakte.

The IPCC is stern on climate change – but it still underestimates the situation (The Guardian)

UN body’s warning on carbon emissions is hard to ignore, but breaking the power of the fossil fuel industry won’t be easy

The Guardian, Sunday 2 November 2014 10.59 GMT

Bangkok's skyline blanketed in a hazeBangkok’s skyline blanketed in a haze. The IPCC report says climate change has increased the risk of severe heatwaves and other extreme weather. Photograph: Adrees Latif/Reuters

At this point, the scientists who run the Intergovernmental Panel on Climate Change must feel like it’s time to trade their satellites, their carefully calibrated thermometers and spectrometers, their finely tuned computer models – all of them for a thesaurus. Surely, somewhere, there must be words that will prompt the world’s leaders to act.

This week, with the release of their new synthesis report, they are trying the words “severe, widespread, and irreversible” to describe the effects of climate change – which for scientists, conservative by nature, falls just short of announcing that climate change will produce a zombie apocalypse plus random beheadings plus Ebola. It’s hard to imagine how they will up the language in time for the next big global confab in Paris.

But even with all that, this new document – actually a synthesis of three big working group reports released over the last year – almost certainly underestimates the actual severity of the situation. As the Washington Post pointed out this week, past reports have always tried to err on the side of understatement; it’s a particular problem with sea level rise, since the current IPCC document does not even include the finding in May that the great Antarctic ice sheets have begun to melt. (The studies were published after the IPCC’s cutoff date.)

But when you get right down to it, who cares? The scientists have done their job; no sentient person, including Republican Senate candidates, can any longer believe in their heart of hearts that there’s not a problem here. The scientific method has triumphed: over a quarter of a century, researchers have reached astonishing consensus on a basic problem in chemistry and physics.

And the engineers have done just as well. The price of a solar panel has dropped by more than 90% over the last 25 years, and continues to plummet. In the few places they have actually been deployed at scale, the results are astonishing: there were days this summer when Germany generated 75% of its power from the wind and the sun.

That, of course, is not because Germany is so richly endowed with sunlight (it’s a rare person who books a North Sea beach holiday). It’s because the Germans have produced a remarkable quantity of political will, and put it to good use.

As opposed to the rest of the world, where the fossil fuel industry has produced an enormous amount of fear in the political class, and kept things from changing. Their vast piles of money have so far weighed more in the political balance than the vast piles of data accumulated by the scientists. In fact, the IPCC can calculate the size of the gap with great exactness. To get on the right track, they estimate, the world would have to cut fossil fuel investments annually between now and 2029, and use the money instead to push the pace of renewables.

That is a hard task, but not an impossible one. Indeed, the people’s movement symbolised by September’s mammoth climate march in New York, has begun to make an impact in dollars and cents. A new report this week shows that by delaying the Keystone pipeline in North America protesters have prevented at least $17bn (£10.6bn) in new investments in the tar sands of Canada – investments that would have produced carbon equivalent to 735 coal-fired power plants. That’s pretty good work.

Our political leaders could do much more, of course. If they put a serious price on carbon, we would move quickly out of the fossil fuel age and into the renewable future. But that won’t happen until we break the power of the fossil fuel industry. That’s why it’s very good news that divestment campaigners have been winning victories on one continent after another, as universities from Stanford to Sydney to Glasgow start selling their fossil fuel stocks in protest – hey, even the Rockefeller Brothers fund, heir to the greatest oil fortune ever, have joined in the fight.

Breaking the power of the fossil fuel industry won’t be easy, especially since it has to happen fast. It has to happen, in fact, before the carbon we’ve unleashed into the atmosphere breaks the planet. I’m not certain we’ll win this fight – but, thanks to the IPCC, no one will ever be able to say they weren’t warned.