A redução da pobreza é um dos eixos da agenda de desenvolvimento pós-2015. Crianças na favela de Kallayanpur, uma das favelas urbanas em Daca, Bangladesh. Foto: ONU/Kibae Park
ONG britânica divulga dados sobre a desigualdade social no mundo para tentar guiar as discussões do Fórum Econômico Mundial
Um estudo divulgado nesta segunda-feira 19 pela ONG britânica Oxfam afirma que, em 2016, as 37 milhões de pessoas que compõem o 1% mais rico da população mundial terão mais dinheiro do que os outros 99% juntos. O relatório tem o objetivo de influenciar as discussões a serem travadas no Fórum Econômico Mundial (FEM), que reúne os ricos e poderosos no resort suíço de Davos entre 21 e 24 de janeiro.
O estudo da Oxfam é baseado no relatório anual sobre a riqueza mundial que o banco Credit Suisse divulga anualmente desde 2010. Na versão mais recente, divulgada em outubro 2014, o Credit Suisse mostrou que o 1% mais rico (com bens de 800 mil dólares no mínimo) detinha 48,2% da riqueza mundial, enquanto os outros 99% ficavam com os 51,8%. No grupo dos 99%, também há uma significativa desigualdade: quase toda a riqueza está nas mãos dos 20% mais ricos, enquanto as outras pessoas dividem 5,5% do patrimônio.
No estudo divulgado nesta segunda, a Oxfam extrapolou os dados para o futuro e indica que em 2016 o 1% mais rico terá mais de 50% dos bens e patrimônios existentes no mundo. “Nós realmente queremos viver em um mundo no qual o 1% tem mais do que nós todos juntos?”, questionou Winnie Byanyima, diretora-executiva da Oxfam e co-presidente do Fórum Econômico Mundial. Em artigo publicado no site do FEM, Byanyima afirma que o fórum tem em 2015 o duplo desafio de conciliar a desigualdade social e as mudanças climáticas. “Tanto nos países ricos quanto nos pobres, essa desigualdade alimenta o conflito, corroendo as democracias e prejudicando o próprio crescimento”, afirma Byanyima.
A diretora da Oxfam lembra que há algum tempo os que se preocupavam com a desigualdade eram acusados de ter “inveja”, mas que apenas em 2014 algumas personalidades como o papa Francisco, o presidente dos Estados Unidos, Barack Obama, e a diretora do Fundo Monetário Internacional (FMI), Christine Lagarde, manifestaram preocupação com a desigualdade social. “O crescente consenso: se não controlada, a desigualdade econômica vai fazer regredir a luta contra a pobreza e ameaçará a estabilidade global”, afirma.
A Oxfam mostra que a riqueza do 1% é derivada de atividades em poucos setores, sendo os de finanças e seguros os principais e os de serviços médicos e indústria farmacêutica dois com grande crescimento em 2013 e 2014. A Oxfam lembra que as companhias mais ricas do mundo usam seu dinheiro, entre outras coisas, para influenciar os governos por meio de lobbies, favorecendo seus setores. No caso particular dos Estados Unidos, que concentra junto com a Europa a maior parte dos integrantes do 1% mais rico, o lobby é particularmente prolífico, afirma a Oxfam, para mexer no orçamento e nos impostos do país, destinando a poucos recursos que “deveriam ser direcionados em benefícios de toda a população”.
Para a Oxfam, a desigualdade social não deve ser tratada como algo inevitável. A ONG lista uma série de medidas para colocar a diferença entre ricos e pobres sob controle, como fazer os governos trabalharem para seus cidadãos e terem a redução da desigualdade como objetivo; a promoção dos direitos e a igualdade econômica das mulheres; o pagamento de salários mínimos e a contenção dos salários de executivos; e o objetivo de o mundo todo ter serviços gratuitos de saúde e educação.
Diante da crise da água em São Paulo, o coordenador geral da Rede Nossa São Paulo e do Programa Cidades Sustentáveis faz um apelo às autoridades e aos cidadãos para que assumam as devidas responsabilidades. Confira:
A cidade de São Paulo está diante de uma catástrofe social, econômica e ambiental sem precedentes. O nível do sistema Cantareira está em cerca de 6% e segue baixando por volta de 0,1% ao dia. O que significa que, em aproximadamente 60 dias, o sistema pode secar COMPLETAMENTE!
O presidente da Sabesp declarou que o sistema pode ZERAR em março ou, na melhor das hipóteses, em junho deste ano. E NÃO HÁ UM PLANO B em curto prazo. Isto significa que seis milhões de pessoas ficarão praticamente SEM UMA GOTA DE ÁGUA ou com enorme escassez. Não é que haverá apenas racionamento ou restrição. Poderá haver ZERO de água, NEM UMA GOTA.
Você já se deu conta do que isto significa em termos sociais, econômicos (milhares de estabelecimentos inviabilizados e enorme desemprego) e ambientais? Você já se deu conta de que no primeiro momento a catástrofe atingirá os mais vulneráveis (pobres, crianças e idosos) e depois todos nós?
O que nos espanta é a passividade da sociedade e das autoridades diante da iminência desta monumental catástrofe. Todas as medidas tomadas pelas autoridades e o comportamento da sociedade são absolutamente insuficientes para enfrentar este verdadeiro cataclismo.
Parece que estamos todos anestesiados e impotentes para agir, para reagir, para pressionar, para alertar, para se mobilizar em torno de propostas e, principalmente, em ações e planos de emergência de curto prazo e políticas e comportamentos que levem a uma drástica transformação da nossa relação com o meio ambiente e os recursos hídricos.
Há uma unanimidade de que esta é uma crise de LONGUÍSSIMA DURAÇÃO por termos deixado, permitido, que se chegasse a esta dramática situação. Agora, o que mais parece é que estamos acomodados e tranquilos num Titanic sem nos dar conta do iceberg que está se aproximando.
Nosso intuito, nosso apelo, nosso objetivo com este alarme é conclamar as autoridades, os formadores de opinião, as lideranças e os cidadãos a se conscientizarem urgentemente da gravíssima situação que vive a cidade, da dimensão da catástrofe que se aproxima a passos largos.
Precisamos parar de nos enganar. É fundamental que haja uma grande mobilização de todos para que se tomem ações e medidas à altura da dramática situação que vivemos. Deixar de lado rivalidades e interesses políticos, eleitorais, desavenças ideológicas. Não faltam conhecimentos, não faltam ideias, não faltam propostas (o Conselho da Cidade de São Paulo aprovou um grande conjunto delas). Mas faltam mobilização e liderança para enfrentar este imenso desafio.
Todos precisamos assumir nossa responsabilidade à altura do nosso poder, de nossa competência e de nossa consciência. O tempo está se esgotando a cada dia.
* Oded Grajew é empresário, coordenador da secretaria executiva da Rede Nossa São Paulo, presidente emérito do Instituto Ethos e idealizador do Fórum Social Mundial.
Updated below | Through three-plus decades of reporting, I’ve been seeking ways to better mesh humanity’s infinite aspirations with life on a finite planet. (Do this Google search — “infinite aspirations” “finite planet” Revkin – to get the idea. Also read the 2002 special issue of Science Times titled “Managing Planet Earth.”)
So I was naturally drawn to a research effort that surfaced in 2009 defining a “safe operating space for humanity” by estimating a set of nine “planetary boundaries” for vital-sign-style parameters like levels of greenhouse gases, flows of nitrogen and phosphorus and loss of biodiversity.
Photo
A diagram from a 2009 analysis of “planetary boundaries” showed humans were already hitting limits (red denotes danger zones).Credit Stockholm Resilience Center
The same was true for a related “Great Acceleration” dashboard showing humanity’s growth spurt (the graphs below), created by the International Geosphere-Biosphere Program.
Photo
A graphic illustrating how human social and economic trends, resource appetites and environmental impacts have surged since 1950.Credit International Geosphere-Biosphere Program
Who would want to drive a car without gauges tracking engine heat, speed and fuel levels? I use that artwork in all my talks.
In a prepared statement, a co-author of the acceleration analysis, Lisa Deutsch, a senior lecturer at the Stockholm Resilience Center, saw little that was encouraging:
Of all the socio-economic trends only construction of new large dams seems to show any sign of the bending of the curves – or a slowing of the Great Acceleration. Only one Earth System trend indicates a curve that may be the result of intentional human intervention – the success story of ozone depletion. The leveling off of marine fisheries capture since the 1980s is unfortunately not due to marine stewardship, but to overfishing.
The paper is behind a paywall, but the Stockholm Resilience Center, which has led this work, has summarized the results, including the authors’ conclusion that we’re in the danger zone on four of the nine boundaries: climate change, loss of biosphere integrity, land-system change and alteration of biogeochemical cycles (for the nutrients phosphorus and nitrogen).
Their work has been a valuable prod to the community of scientists and policy analysts aiming to smooth the human journey, resulting in strings of additional studies. Some followup work has supported the concept, and even broadened it, as with a 2011 proposal by Kate Raworth of the aid group Oxfam to add social-justice boundaries, as well: “A Safe and Just Space for Humanity – Can We Live Within the Doughnut?”
Photo
In 2011, Kate Raworth at the aid group Oxfam proposed a framework for safe and just human advancement illustrated as a doughnut-shaped zone.Credit Oxfam
But others have convincingly challenged many of the boundaries and also questioned their usefulness, given how both impacts of, and decisions about, human activities like fertilizing fields or tapping aquifers are inherently local — not planetary in scale. (You’ll hear from some critics below.)
I hope the public (and policy makers) will realize this is not a right-wrong, win-lose science debate. A complex planet dominated by a complicated young species will never be managed neatly. All of us, including environmental scientists, will continue to learn and adjust.
I was encouraged, for instance, to see the new iteration of the boundaries analysis take a much more refined view of danger zones, including more of an emphasis on the deep level of uncertainty in many areas:
Photo
A diagram from a paper defining “planetary boundaries” for human activities shows areas of greatest risk in red.Credit Science
The authors, led by Will Steffen of Australian National University and Johan Rockström of the Stockholm Resilience Center, have tried to refine how they approach risks related to disrupting ecosystems – not simply pointing to lost biological diversity but instead devising a measure of general “biosphere integrity.”
That measure, and the growing human influence on the climate through the buildup of long-lived greenhouse gases are the main source of concern, they wrote:
Two core boundaries – climate change and biosphere integrity – have been identified, each of which has the potential on its own to drive the Earth System into a new state should they be substantially and persistently transgressed.
But the bottom line has a very retro feel, adding up to the kind of ominous, but generalized warnings that many environmental scientists and other scholars began giving with the “Limits to Growth” analysis in 1972. Here’s a cornerstone passage from the paper, reprising a longstanding view that the environmental conditions of the Holocene – the equable span since the end of the last ice age – is ideal:
The precautionary principle suggests that human societies would be unwise to drive the Earth System substantially away from a Holocene-like condition. A continuing trajectory away from the Holocene could lead, with an uncomfortably high probability, to a very different state of the Earth System, one that is likely to be much less hospitable to the development of human societies.
I sent the Science paper to a batch of environmental researchers who have been constructive critics of the Boundaries work. Four of them wrote a group response, posted below, which includes this total rejection of the idea that the Holocene is somehow special:
[M]ost species evolved before the Holocene and the contemporary ecosystems that sustain humanity are agroecosystems, urban ecosystems and other human-altered ecosystems….
Steffen et al (2015) revise the “planetary boundaries framework” initially proposed in 2009 as the “safe limits” for human alteration of Earth processes (Rockstrom et al 2009). Limiting human harm to environments is a major challenge and we applaud all efforts to increase the public utility of global-change science. Yet the planetary boundaries (PB) framework – in its original form and as revised by Steffen et al – obscures rather than clarifies the environmental and sustainability challenges faced by humanity this century.
Steffen et al concede that “not all Earth system processes included in the PB have singular thresholds at the global/continental/ocean basin level.” Such processes include biosphere integrity (see Brook et al 2013), biogeochemical flows, freshwater use, and land-system change. “Nevertheless,” they continue, “it is important that boundaries be established for these processes.” Why? Where a global threshold is unknown or lacking, there is no scientifically robust way of specifying such a boundary – determining a limit along a continuum of environmental change becomes a matter of guesswork or speculation (see e.g. Bass 2009; Nordhaus et al 2012). For instance, the land-system boundary for temperate forest is set at 50% of forest cover remaining. There is no robust justification for why this boundary should not be 40%, or 70%, or some other level.
While the stated objective of the PB framework is to “guide human societies” away from a state of the Earth system that is “less hospitable to the development of human societies”, it offers little scientific evidence to support the connection between the global state of specific Earth system processes and human well-being. Instead, the Holocene environment (the most recent 10,000 years) is assumed to be ideal. Yet most species evolved before the Holocene and the contemporary ecosystems that sustain humanity are agroecosystems, urban ecosystems and other human-altered ecosystems that in themselves represent some of the most important global and local environmental changes that characterize the Anthropocene. Contrary to the authors’ claim that the Holocene is the “only state of the planet that we know for certain can support contemporary human societies,” the human-altered ecosystems of the Anthropocene represent the only state of the planet that we know for certain can support contemporary civilization.
Human alteration of environments produces multiple effects, some advantageous to societies, such as enhanced food production, and some detrimental, like environmental pollution with toxic chemicals, excess nutrients and carbon emissions from fossil fuels, and the loss of wildlife and their habitats. The key to better environmental outcomes is not in ending human alteration of environments but in anticipating and mitigating their negative consequences. These decisions and trade-offs should be guided by robust evidence, with global-change science investigating the connections and tradeoffs between the state of the environment and human well-being in the context of the local setting, rather than by framing and reframing environmental challenges in terms of untestable assumptions about the virtues of past environments.
Even without specifying exact global boundaries, global metrics can be highly misleading for policy. For example, with nitrogen, where the majority of human emissions come from synthetic fertilizers, the real-world challenge is to apply just the right amount of nitrogen to optimize crop yields while minimizing nitrogen losses that harm aquatic ecosystems. Reducing fertilizer application in Africa might seem beneficial globally, yet the result in this region would be even poorer crop yields without any notable reduction in nitrogen pollution; Africa’s fertilizer use is already suboptimal for crop yields. What can look like a good or a bad thing globally can prove exactly the opposite when viewed regionally and locally. What use is a global indicator for a local issue? As in real estate, location is everything.
Finally, and most importantly, the planetary boundaries are burdened not only with major uncertainties and weak scientific theory – they are also politically problematic. Real world environmental challenges like nitrogen pollution, freshwater consumption and land-use change are ultimately a matter of politics, in the sense that there are losers and winners, and solutions have to be negotiated among many stakeholders. The idea of a scientific expert group determining top-down global limits on these activities and processes ignores these inevitable trade-offs and seems to preclude democratic resolution of these questions. It has been argued that (Steffen et al 2011):
Ultimately, there will need to be an institution (or institutions) operating, with authority, above the level of individual countries to ensure that the planetary boundaries are respected. In effect, such an institution, acting on behalf of humanity as a whole, would be the ultimate arbiter of the myriad trade-offs that need to be managed as nations and groups of people jockey for economic and social advantage. It would, in essence, become the global referee on the planetary playing field.
Here the planetary boundaries framework reaches its logical conclusion with a political scenario that is as unlikely as it is unpalatable. There is no ultimate global authority to rule over humanity or the environment. Science has a tremendously important role to play in guiding environmental management, not as a decider, but as a resource for deliberative, evidence-based decision making by the public, policy makers, and interest groups on the challenges, trade-offs and possible courses of action in negotiating the environmental challenges of societal development (DeFries et al 2012). Proposing that science itself can define the global environmental limits of human development is simultaneously unrealistic, hubristic, and a strategy doomed to fail.
Update, 9:40 p.m.| Will Steffen, the lead author of the updated Planetary Boundaries analysis, sent this reply to Ellis and co-authors tonight:
Response to Ellis et al. on planetary boundaries
Of course we welcome constructive debate on and criticism of the planetary boundaries (PB) update paper. However, the comments of Ellis et al. appear to be more of a knee-jerk reaction to the original 2009 paper than a careful analysis of the present paper. In fact, one wonders if they have even read the paper, including the Supplementary Online Material (SOM) where much methodological detail is provided.
One criticism seems to be based on a rather bizarre conflation of a state of the Earth System with (i) the time when individual biological species evolved, and (ii) the nature and distribution of human-altered terrestrial ecosystems. This makes no sense from an Earth System science perspective. The state of the Earth System (a single system at the planetary level) also involves the oceans, the atmosphere, the cryosphere and very important processes like the surface energy balance and the flows and transformation of elements. It is the state of this single complex system, which provides the planetary life support system for humanity, that the PB framework is concerned with, not with fragmentary bits of it in isolation.
In particular, the PB framework is based on the fact – and I emphasise the word “fact” – that the relatively stable Holocene state of the Earth System (the past approximately 11,700 years) is the only state of the System that has allowed the development of agriculture, urban settlements and complex human societies. Some argue that humanity can now survive, and even thrive, in a rapidly destabilizing planetary environment, but that is a belief system based on supreme technological optimism, and is not a reasoned scientifically informed judgment. Also, Ellis et al. seem to conflate human alteration of terrestrial environments with human alteration of the fundamental state of the Earth System as a whole. These are two vastly different things.
The criticisms show further misunderstanding of the nature of complex systems like the Earth System and how they operate. For example, Ellis et al. claim that a process is not important unless it has a threshold. Even a cursory understanding of the carbon cycle, for example, shows that this is nonsense. Neither the terrestrial nor the marine carbon sinks have known large-scale thesholds yet they are exceedingly important for the functioning of the climate system, which does indeed have known large-scale thresholds such as the melting of the Greenland ice sheet. Sure, it is more challenging to define boundaries for processes that are very important for the resilience of the Earth System but don’t have large-scale thresholds, but it is not impossible. The zone of uncertainty tends to be larger for these boundaries, but as scientific understanding improves, this zone will narrow.
An important misrepresentation of our paper is the assertion that we are somehow suggesting that fertilizer application in Africa be reduced. Nothing could be further from the truth. In fact, if Ellis et al had taken the time to read the SOM, the excellent paper by Carpenter and Bennett (2011) on the P boundary, the equally excellent paper by de Vries et al. (2013) on the N boundary, and the paper by Steffen and Stafford Smith (2013) on the distribution and equity issues for many of the PBs, including N and P, they wouldn’t have made such a misrepresentation.
Finally, the Steffen et al. (2011) paper seems to have triggered yet another misrepresentation. The paragraph of the paper quoted by Ellis et al. is based on contributions from two of the authors who are experts in institutions and governance issues, and does not come from the natural science community. Nowhere in the paragraph quoted, nor in the Steffen et al. (2011) paper as a whole, is there the proposal for a “a scientific expert group determining top-down global limits…”. The paragraph reprinted by Ellis et al. doesn’t mention scientists at all. That is a complete misrepresentation of our work.
We reiterate that we very much welcome careful and constructive critiques of the PB update paper, preferably in the peer-reviewed literature. In fact, such critiques of the 2009 PB paper were very helpful in developing the 2015 paper. Knee-jerk reactions in the blogosphere make for interesting reading, but they are far less useful in advancing the science.
Update, Jan. 16, 2:09 p.m. | Johan Rockström and Katherine Richardson, authors of the boundaries analysis, sent these additional reactions to the Ellis et al. critique:
We are honored that Erle Ellis, Barry Brook, Linus Blomqvist and Ruth DeFries (Ellis et al.) show such strong interest in our Planetary Boundaries research. The 2015 science update draws upon the over 60 scientific articles that have been published specifically scrutinizing different aspects of the Planetary Boundaries framework (amongst them the contributions by all these four researchers), and the most recent advancements in Earth System science. This new paper scientifically addresses and clarifies all of the natural science related aspects of Ellis et al.’s critique. It can also be noted that Ellis et al.’s critique simply echoes the standpoints regarding Planetary Boundaries research that the same group (Blomqvist et al., 2012) brought forward in 2012. Now, as then, their criticisms seem largely to be based on misunderstandings and their own viewpoints:
(1) We have never argued that there are planetary scale tipping points for all Planetary Boundary processes. Furthermore, there does not need to be a tipping point for these processes and systems in order for them to function as key regulators of the stability of the Earth system. A good example here is the carbon sink in the biosphere (approximately 4.5 Gt/year) which has doubled over the past 50 years in response to human emissions of CO2 and, thus, provides a good example of Earth resilience at play;
(2) Establishing the Planetary Boundaries, i.e. identifying Earth System scale boundaries for environmental processes that regulate the stability of the planet, does not (of course) contradict or replace the need for local action, transparency and democratic processes. Our society has long accepted the need for local – and to some extent regional- environmental management. Scientific evidence has now accumulated that indicates a further need for management of some environmental challenges at the global level. Many years of multi-lateral climate negotiation indicate a recognized need for global management of the CO2 emissions that occur locally. Our Planetary Boundaries research identifies that there are also other processes critical to the functioning of the Earth System that are so impacted by human activities that they, too, demand management at the global level. Ours is a positive – not a doomsday – message. It will come as no surprise to any reader that there are environmental challenges associated with all of the 9 Earth System functions we examine. Through our research, we offer a framework that can be useful in developing management at a global level.
It is important to emphasize that Ellis et al. associate socio-political attributes to our work that do not exist. The Science paper published today (16th January 2015), is a natural science update and advancement of the planetary boundaries framework. It makes no attempt to enter the (very important) social science realm of equity, institutions or global governance. The implications attributed to the PB framework must, then, reflect Ellis et al.’s own normative values. Furthermore, Ellis et al. argue that the “key to better environmental outcomes is not ending human alteration” but “anticipating and mitigating the negative consequences” of human environmental perturbation. While Planetary Boundaries research does not dictate how societies should use the insights it provides, “anticipating negative consequences” is at the absolute core of our approach!
Regarding Earth system tipping points. As Will Steffen points out in his earlier response, it would have been scientifically more correct for Ellis et al. to refer not only to their own assessment of uncertainties regarding a potential biosphere tipping point but also to the response to their article by Terry Hughes et al. (2014). These researchers presented the current state of empirical evidence concerning changes in interactions and feedbacks and how they can (in several cases do!) trigger tipping points at ecosystem and biome scale, and that such non-linear dynamics at local to regional scale can add up to impacts at the Earth system scale.
A different worldview. The Ellis et al. critique appears not to be a scientific criticism per se but rather is based on their own interpretation of differences in worldview. They do not substantively put in question the stability of the Earth system as a basis for human development– see Will Steffen’s response. Thus, it appears that we and Ellis et al. are in agreement here. Of course species and ecosystems have evolved prior to the Holocene but only in the stable environment of the Holocene have humans been able to exploit the Earth system at scale (e.g., by inventing agriculture as a response to a stable hydro-climate in the Holocene).
Ellis et al. argue that the only constructive avenue is to “investigate the connections and trade-offs between the state of the environment and human well-being in the context of the local setting..:”. This is clearly not aligned with current scientific evidence. In the Anthropocene, there is robust evidence showing that we need to address global environmental change at the global level, as well as at the regional, national and local contexts, and in particular understanding cross-scale interactions between them.
On global governance. It seems hardly surprising, given the Ellis et al.’s misunderstanding of the Planetary Boundaries framework that their interpretation of the implications of operationalizing the framework rests also on misunderstandings. They claim the Planetary Boundaries framework translates to an “ultimate global authority to rule over humanity”. No one would argue that the current multi-lateral climate negotiations are an attempt to establish “ultimate global authority over humanity” and this is certainly never been suggested by the Planetary Boundaries research. In essence, the Planetary Boundary analysis simply identifies Earth System processes that – in the same manner as climate – regulate the stability of the Earth System, and if impacted too far by human activities potentially can disrupt the functioning of the Earth System. The Planetary Boundaries is, then, nothing more than a natural sciences contribution to an important societal discussion and which presents evidence which can support the definition of Planetary Boundaries to safeguard a stable and resilient Earth system. How this then translates to governance is another issue entirely and important social science contributions have addressed these (Galaz et al 2012). As our research shows, there is natural science evidence that global management of some environmental challenges is necessary. From the social science literature (Biermann et al., 2012) as well as from real world policy making, we see that such global scale regulation is possible to construct in a democratic manner and does establish a safe operating space, e.g. the Montreal protocol, a global agreement to address one of the identified planetary boundaries and which, to our knowledge, is never referred to as a “global authority ruling over humanity”. As noted above, the UNFCCC process is also fundamentally concerned with establishing the global “rules of the game” by which society can continue to develop within a climate planetary boundary. The Aichi targets (within the UN Convention on Biological Diversity) of setting aside marine and terrestrial areas for conservation are also good examples of the political translation of a science based concern over global loss of biodiversity. The coming SDG (Sustainable Development Goals) framework includes a proposed set of four goals (oceans, climate, biodiversity and freshwater), which is a de-facto example of applying planetary boundary thinking to create a global framework for safeguarding a stable environment on the planet for societies and communities across the world. We find it interesting – and encouraging – that societies and the world community are already developing management tools within several “planetary boundary domains”. In all cases, this is happening in good democratic order and building upon bottom-up processes and informed by science. This ought to be reassuring for Ellis et al. who portray implementation of Planetary Boundary thinking as a dark force of planetary rule.
* * *
[Reaction]
The Limits of Planetary Boundaries 2.0 (Brave New Climate)
Today a new paper appeared in the journal Science, called “Planetary boundaries: Guiding human development on a changing planet“, which attempts to refine and clarify the concept. It states that four of nine planetary boundaries have been crossed, re-imagines the biodiversity boundary as one of ‘biodiversity integrity’, and introduces the concept of ‘novel entities’. A popular summary in the Washington Post can be read here. On the invitation of New York Times “Dot Earth” reporter Andy Revkin, my colleagues and I have written a short response, which I reproduce below. The full Dot Earth article can be read here.
Steffen et al (2015) revise the “planetary boundaries framework” initially proposed in 2009 as the “safe limits” for human alteration of Earth processes(Rockstrom et al 2009). Limiting human harm to environments is a major challenge and we applaud all efforts to increase the public utility of global-change science. Yet the planetary boundaries (PB) framework – in its original form and as revised by Steffen et al – obscures rather than clarifies the environmental and sustainability challenges faced by humanity this century.
Steffen et al concede that “not all Earth system processes included in the PB have singular thresholds at the global/continental/ocean basin level.” Such processes include biosphere integrity (see Brook et al 2013), biogeochemical flows, freshwater use, and land-system change. “Nevertheless,” they continue, “it is important that boundaries be established for these processes.” Why? Where a global threshold is unknown or lacking, there is no scientifically robust way of specifying such a boundary – determining a limit along a continuum of environmental change becomes a matter of guesswork or speculation (see e.g. Bass 2009;Nordhaus et al 2012). For instance, the land-system boundary for temperate forest is set at 50% of forest cover remaining. There is no robust justification for why this boundary should not be 40%, or 70%, or some other level.
While the stated objective of the PB framework is to “guide human societies” away from a state of the Earth system that is “less hospitable to the development of human societies”, it offers little scientific evidence to support the connection between the global state of specific Earth system processes and human well-being. Instead, the Holocene environment (the most recent 10,000 years) is assumed to be ideal. Yet most species evolved before the Holocene and the contemporary ecosystems that sustain humanity are agroecosystems, urban ecosystems and other human-altered ecosystems that in themselves represent some of the most important global and local environmental changes that characterize the Anthropocene. Contrary to the authors’ claim that the Holocene is the “only state of the planet that we know for certain can support contemporary human societies,” the human-altered ecosystems of the Anthropocene represent the only state of the planet that we know for certain can support contemporary civilization.
Human alteration of environments produces multiple effects, some advantageous to societies, such as enhanced food production, and some detrimental, like environmental pollution with toxic chemicals, excess nutrients and carbon emissions from fossil fuels, and the loss of wildlife and their habitats. The key to better environmental outcomes is not in ending human alteration of environments but in anticipating and mitigating their negative consequences. These decisions and trade-offs should be guided by robust evidence, with global-change science investigating the connections and tradeoffs between the state of the environment and human well-being in the context of the local setting, rather than by framing and reframing environmental challenges in terms of untestable assumptions about the virtues of past environments.
Even without specifying exact global boundaries, global metrics can be highly misleading for policy. For example, with nitrogen, where the majority of human emissions come from synthetic fertilizers, the real-world challenge is to apply just the right amount of nitrogen to optimize crop yields while minimizing nitrogen losses that harm aquatic ecosystems. Reducing fertilizer application in Africa might seem beneficial globally, yet the result in this region would be even poorer crop yields without any notable reduction in nitrogen pollution; Africa’s fertilizer use is already suboptimal for crop yields. What can look like a good or a bad thing globally can prove exactly the opposite when viewed regionally and locally. What use is a global indicator for a local issue? As in real estate, location is everything.
Finally, and most importantly, the planetary boundaries are burdened not only with major uncertainties and weak scientific theory – they are also politically problematic. Real world environmental challenges like nitrogen pollution, freshwater consumption and land-use change are ultimately a matter of politics, in the sense that there are losers and winners, and solutions have to be negotiated among many stakeholders. The idea of a scientific expert group determining top-down global limits on these activities and processes ignores these inevitable trade-offs and seems to preclude democratic resolution of these questions. It has been argued that (Steffen et al 2011):
Ultimately, there will need to be an institution (or institutions) operating, with authority, above the level of individual countries to ensure that the planetary boundaries are respected. In effect, such an institution, acting on behalf of humanity as a whole, would be the ultimate arbiter of the myriad trade-offs that need to be managed as nations and groups of people jockey for economic and social advantage. It would, in essence, become the global referee on the planetary playing field.
Here the planetary boundaries framework reaches its logical conclusion with a political scenario that is as unlikely as it is unpalatable. There is no ultimate global authority to rule over humanity or the environment. Science has a tremendously important role to play in guiding environmental management, not as a decider, but as a resource for deliberative, evidence-based decision making by the public, policy makers, and interest groups on the challenges, trade-offs and possible courses of action in negotiating the environmental challenges of societal development (DeFries et al 2012). Proposing that science itself can define the global environmental limits of human development is simultaneously unrealistic, hubristic, and a strategy doomed to fail.
Widespread seafloor gas release from the seabed offshore the West Yamal Peninsula, suggests that permafrost has degraded more significantly than previously thought. Gas is released in an area of at least 7500 km2 in water depths >20 m.(1)
Tromsø, Norway: Centre for Arctic Gas Hydrate (CAGE): It was previously proposed that the permafrost in the Kara Sea, and other Arctic areas, extends to water depths up to 100 meters, creating a seal that gas cannot bypass. Portnov and colleagues have found that the West Yamal shelf is leaking, profoundly, at depths much shallower than that.
Significant amount of gas is leaking at depths between 20 and 50 meters. This suggests that a continuous permafrost seal is much smaller than proposed. Close to the shore the permafrost seal may be few hundred meters thick, but tapers off towards 20 meters water depth. And it is fragile.
Evolution of permafrost
Portnov used mathematical models to map the evolution of the permafrost, and thus calculated its degradation since the end of the last ice age. The evolution of permafrost gives indication to what may happen to it in the future.
Basically the permafrost is thawing from two sides. The interior of the Earth is warming the permafrost from the bottom up, called geothermal heat flux – an ongoing process. Thus, if the bottom ocean temperature is −0,5°C, the maximal possible permafrost thickness would likely take 9000 years to thaw. But if water temperature increases, the process would go much faster, because the thawing would also happen from the top down.
“If the temperature of the oceans increases by two degrees as suggested by some reports, it will accelerate the thawing to the extreme. A warming climate could lead to an explosive gas release from the shallow areas.”(2)
Impact study
Another study based on a coupled climate–carbon cycle model (GCM) assessed a 1000-fold (from <1 to 1000 ppmv) methane increase – within a single pulse, from methane hydrates (based on carbon amount estimates for the PETM, with ~2000 GtC), and concluded it would increase atmospheric temperatures above >6°C within 80 years. Further, carbon stored in the land biosphere would decrease by >25%, suggesting a critical situation for ecosystems and farming, especially in the tropics.(3)
Though, in reality it is reasonable to assume that larger methane spikes will be in the 1-2 digit Gt ball park, which are still considerable amounts. The PETM, 55 mil years ago, is marked by several larger spikes. Even if there aren’t larger spikes, the current deglaciation in the northern hemisphere will considerably contribute – increase the current atmospheric carbon budget. Hence, it is vital to reduce emissions now, to slow or even reverse processes before things get out of control.
As tempestades que têm desabado sobre a cidade de São Paulo desde o fim de dezembro derrubaram árvores e postes, mas não serviram para abastecer as represas do Cantareira, prolongando a crise da água. Cientistas, porém, afirmam que isso é compreensível e era até esperado.
O problema que leva à essa situação paradoxal passa por uma espécie de pane que acontece pelo segundo verão consecutivo no sistema que os meteorologistas chamam de ZCAS (Zona de Convergência do Atlântico Sul). Trata-se de uma banda de nuvens que se estende desde o oeste da Amazônia até Mato Grosso, Minas Gerais, São Paulo e segue até alto mar.
“O sistema, que favoreceria as chuvas na região central do Brasil como um todo, não está atuando como deveria”, diz Anna Bárbara de Melo, do CPTEC (Centro de Previsão de Tempo e Estudos Climáticos), ligado ao Instituto Nacional de Pesquisas Espaciais.
Em dezembro, a ZCAS entrou em ação, mas no lugar “errado”. “O sistema ocorreu, só que favorecendo a região sul da Bahia e o Tocantins”, diz a pesquisadora. “Todo o estado de Minas, em dezembro, teve menos precipitação que o normal, com exceção de algumas áreas no norte.”
Segundo o climatologista Tércio Ambrizzi, da USP, o fenômeno pode estar relacionado à mudança climática.
“O fato de a atmosfera estar mais aquecida tem gerado uma variabilidade climática maior, enfatizando os eventos extremos”, diz o climatologista. “Em 2010 e 2011, nós estávamos enfrentando as inundações e mortes ocorridas nos deslizamentos do Rio de Janeiro”, conta Ambrizzi.
“Naquele ano o Cantareira estava com mais de 100% da capacidade, vertendo água e prejudicando algumas cidades. Três anos depois, passamos para um extremo seco com chuvas abaixo da média.”
CAPITAL
Mas, se falta chuva na Cantareira, por que tanta água na capital?
Isso se explica por um outro fenômeno, tipicamente relacionado às chuvas de verão: as ilhas de calor.
Em grandes concentrações urbanas, sem vegetação, o pouco de umidade que existe sobre essas áreas tende a subir em função do calor, até atingir temperaturas mais baixas e se condensar. Isso cria nuvens com uma extensão horizontal relativamente pequena, mas uma extensão vertical grande, com bastante água. A chuva então cai numa região específica, com muita violência, explica Ambrizzi. Em geral, tais tempestades ocorrem no início da noite.
Essas fortes descargas, concentradas em horários limitados, não chegaram nem a trazer um volume médio histórico de água nem mesmo para a capital.
Na primeira metade de janeiro, a estação meteorológica do Mirante de Santana, na zona norte de São Paulo, registrou 71 mm de chuva acumulada, quando a média histórica era de 130 mm. No Cantareira, mais ao norte, a situação é pior, com apenas 60 mm de chuva tendo ocorrido até agora, menos da metade do que se esperava. O nível do reservatório caiu de 7,2% para 6,2%, numa época do ano em que costuma subir.
Algumas das chuvas de verão estimuladas pela mancha urbana de São Paulo poderiam até ter contribuído para elevar o nível de algumas represas do sistema Cantareira, mas aí surge o terceiro problema. Segundo hidrólogos, o solo da maior parte das represas já estava tão seco, castigado pelo sol, que boa parte da água foi simplesmente absorvida pela terra, sem causar nenhuma elevação no nível dos reservatórios.
Esse “efeito esponja”, diz Ambrizzi, pode ter anulado qualquer benefício que chuvas de verão tenham trazido para as represas do Cantareira mais próximas da capital.
Ulrich Beck. Photo by International Students’ Committee via Wikimedia Commons.
The death of Ulrich Beck on January 1, 2015 stilled one of sociology’s most important voices.
Beck has long been one of my favourite sociologists. That is because the world he describes in his book Risk Society reminds me very much of the world of Chinese popular religion that I studied in Taiwan.
There are two basic similarities. First, in the risk society as Beck describes it, public pomp and ceremony and ostentatious displays of wealth recede. Wealth is increasingly privatized, concealed in gated communities, its excesses hidden from public view. Second, social inequality not only increases but increasingly takes the form of differential exposure to many forms of invisible risks.
In the world that Beck describes, signs of wealth continue to exist. Coronations and royal births, celebrity weddings, CEO yachts, the massive homes of the rich and famous and their McMansion imitators are all visible evidence that wealth still counts.
But, says Beck, inequality’s deeper manifestations are now in differences in institutions that shelter the rich and expose the poor to risks that include not only economic fluctuations but also extreme weather and climate change, chemical and biological pollution, mutating and drug-resistant diseases. The hidden plots of terrorists and of those who combat them might also be added to this list.
People with problems attribute them to invisible causes. They turn for help to those who claim special powers to diagnose and prescribe.
When I visualize what Beck is talking about when he says that wealth is becoming invisible, I imagine an airport. In the main concourse there is little visible difference between those checking in at the First or Business Class counters and those checking in for the cattle car seats in Economy. All will pass the same array of Duty Free shops on their way to their planes.
But while the masses wait at the gates, the elite relax in comfortable, concealed spaces, plied with food, drink and WiFi, in lounges whose entrances are deliberately understated. This is not, however, the height of luxury.
Keiko Yamaki, a former airline stewardess turned applied anthropologist, observes in her study of airline service culture that the real elite, the super rich, no longer fly with commercial airlines. They prefer their private jets. Even those in First Class are more likely to be from the merely 1% instead of the 0.01%, who are now never seen checking in or boarding with the rest of us.
What, then, of invisible risks? The transactions that dominate the global economy are rarely, if ever, to be seen, negotiated in private and executed via encrypted digital networks. Financial institutions and the 1% who own them are protected from economic risk. The 99%, and especially those who live in the world’s poorest nations and slums are not.
The invisible threats of nuclear, chemical and biological waste are concentrated where the poor live. Drug-resistant diseases spread like wildfire through modern transportation systems, but the wealthy are protected by advanced technology and excellent health care. The poor are not.
At the end of the day, however, all must face misfortune and death, and here is where the similarity to Chinese popular religion comes in.
My business is failing. My daughter is acting crazy. My son was nearly killed in a motorcycle accident. He’s been married for three years and his wife still hasn’t had a baby. I feel sick all the time. I sometimes feel faint or pass out.
Why? The world of Chinese popular religion has answers. Impersonal factors, the alignment of your birth date with the current configuration of the stars, Yin and Yang and the Five Elements, may mean that this is a bad time for you.
Worse still, you may have offended one of the gods, ghosts or ancestors who inhabit the invisible Yin world that exists alongside the Yang world in which we live. The possibilities are endless. You need to find experts, mediums, magicians or priests, who can identify the source of your problem and prescribe remedies for it. You know that most who claim to be experts are charlatans but hope nonetheless to find the real thing.
Note how similar this is to the world that Beck describes, where the things that we fear most are said to be caused by invisible powers, the market, the virus, pollution or climate change, for example. Most of us don’t understand these things. We turn to experts for advice; but so many claim to be experts and say so many different things.
How do we find those who “really know”? The rich may have access to experts with with bigger reputations in finance, law, medicine, science or personal protection. But what does this really mean?
As I see it, all forms of consulting are magic. People with problems attribute them to invisible causes. They turn for help to those who claim special powers to diagnose and prescribe, and random chance alone will lead to identification of some who claim such powers as having “It,” that special something that produces desired results. Negative evidence will disappear in a context where most who claim special powers are known to be frauds.
The primary question for those looking for “It” is how to find the golden needle in a huge and constantly growing haystack. People turn to to their social networks for recommendations by trusted others, whose trust may, however, be grounded in nothing more than having found someone whose recommendations are, by sheer random chance, located in the tail of the normal curve where “success” is concentrated.
I read Beck’s Risk Society long before I read Nassim Taleb’s Fooled by Randomnessand The Black Swan. Taleb’s accounts of how traders who place lucky bets in the bond market are seen as geniuses with mystical insights into market mechanisms — at least until their funds collapse — seem to me to strongly support my theory of how all consulting works.
I read the words of “experts” who clamour for my attention and think of Taleb’s parable, the one in which a turkey has a perfectly consistent set of longitudinal data, stretching over nearly a year demonstrating the existence of a perfectly predictable world in which the sun will rise every morning and the farmer will feed the turkey. Then comes the day before Thanksgiving, and the farmer turns up with an axe.
Be warned: reading books like those by Beck and Taleb may reinforce skepticism of claims to scientific and other expertise. But think about it. Which world would you rather live in: One where careful scientists slowly develop hypotheses and look systematically for evidence to test them? Or a world in which our natural human tendency to magical thinking has no brake at all?
For his leading me to these thoughts, I do, indeed, mourn the death of Ulrich Beck.
What Baudrillard called the perfect crime has become the malaise of the global(ized) intellectual of the beginning of the 21’st century. The “perfect crime” in question is the murder of the real, carried out in such way as to create the conviction it never existed and that the traces of its erased existence were mere symptom of its implacable originary absence. The era of postmodernism has been one of oversaturation with signification as a reality in its own right and also as the only possible reality. In 1995, with the publication of The Perfect Crime, Baudrillard declared full realization of the danger he warned against as early as in 1976 in his book The Symbolic Exchange and Death. The latter book centered on the plea to affirm reality in its form of negativity, i.e., as death and the trauma of interrupted life. And he did not write of some static idea of the “Negative,” of “the constitutive lack” or “absence” as conceived by postmodernism and epistemological poststructuralism. The fact that, within the poststructuralist theoretical tradition, the real has been treated as the “inaccessible” and “the unthinkable” has caused “freezing” of the category (of the real) as immutable, univocal and bracketed out of discursiveness as an unspoken axiom.
The romantic fascination with the possibility of self-invention, the dream of being the demiurge of oneself and one’s own reality, has been nesting in most postmodern readings of the idea of utter linguistic constructedness of the self and it’s jouissance. The theoretical trend of what I would call “cyber-optimism” of the 90’ was informed by the old European myth of transcending physical limitations by way of liberating desires from the body. Through prosthetic mediation, one would “emancipate” desire and re-create oneself as the product and the reality of pure signification. This is a theoretical trend mostly inspired by the work of Donna Haraway. However, in my view, one which has failed to see the terrifying void gaping behind that utter intentionality of the human mind that Donna Haraway’s Simians, Cyborgs, and Women: The Reinvention of Nature (1991) and Primate Visions (1989) expose. She speaks of the Cyborg we all are, a creature of no origin, “the bastard of patriarchal militarism” as the revolutionary subject that should aim to destroy the narratives of hierarchy which humanism and its anthropocentric vision of nature produce. Haraway radically problematizes the dualistic hierarchy which subdues and exploits nature. The Cyborg, that “militant bastard” of humanism, faces the horror of auto-seclusion in its narcissistic and auto-referential universe of dreams and desires informed by the universe of his philosophical fathers.
The realization about the fundamentally discursively constructed humanity, including its entire history of idea, its universe and horizon of thinkability, creates the following aporia: the limits of construction reveal a certain “out-there” against which one is constructed. The “out-there” has been habitually relegated by the postmodernists to the realm of nonsense which deserves no theoretical consideration insofar as it could only assume the status of the unthinkable real. Nonetheless, Baudrillard appealed to think it as affirmed negativity, and the Lacanians attempted to think it as trauma or “constitutive lack.” In Bodies that Matter (1993), Butler assigned the status of the real to some of the laws of phantasmatic construction of the body and gender. These efforts of invoking the real within a theory which is marked as predominantly poststructuralist seem to have failed to offer a satisfactory response to the ever increasing theoretical and existential need to reclaim the real. Hence, the emergence in the second half of the first decade of the 21st century of strands of philosophical thought such as “speculative realism,” “object oriented ontology,” Badousian-Žižekian realist tendencies in political theory and, finally, François Laruelle’s non-standard philosophy or non-philosophy. There has been a notable tendency in the last couple of years to subsume all these lines of thinking under the single label of “speculative realism.” The notion of “speculative realism” has taken a life of its own against the fact that virtually all of the prominent representatives of the heterogeneous theoretical trends it pretends to refer to do not endorse or even reject the label (except for some representatives of object oriented ontology).
All these trends to which the identification of “speculative realism” is assigned to, in spite of their fundamental differences, have something in common: they identify limitations to thought or discursivity precisely in the alleged “limitlessness” of thought, proclaimed by most postmodernists. The main epistemic problem of postmodern philosophy identified by the “new realists” is what Quentin Meillassoux, in his book After Finitude (2008), called “correlationism.” At the heart of postmodern philosophy lies “correlationism,” a philosophical axiom based on the premise that thought can only “think itself,” that the real is inaccessible to knowledge and human subjectivity.
Laruelle’s non-philosophy radicalizes the problem by way of insisting that indeed all that thought can operate with is thinking itself, and that the hallucinatory world of representation is indeed the only means and topos for mediating the real, viz. for signifying it. Nonetheless, according to him and radically differently from any postmodernist stance, the real can be thought and ought to be thought. Laruelle argues one should produce thought in accordance with the syntax of the real, a thought affected by the real and which accounts for the effects of the real. The real is not a meaning, it is not a truth of anything and does not possess an epistemic structure since it is not mirrored by and does not mirror any accurate knowledge of its workings. Therefore, a thought established in accordance with the effects of the real is unilateral. In non-philosophy, this stance is called dualysis. Namely, the radically different status of the immanent (the real) and of the transcendental (thought) is affirmed, and by virtue of such affirmation the thinking subject attempts to describe some effects of sheer exteriority, i.e., the real. The interpretation of these effects makes use of “philosophical material,” but it does not succumb to philosophy but rather to the real as its authority in the last instance.
Such fundamentally heretical stance with respect to the history of philosophical ideas or to the idea of philosophy itself creates the possibility of being radically innovative as far as political possibilities are concerned, both in terms of theory and action. In The Cut of the Real, I attempt to explore the potentiality for radicalizing some core concepts of the legacy of feminist poststructuralist philosophy. By way of resorting to some of the methodological procedures proferred by the non-philosophy, but also by way of unraveling a radically realist heuristics in the thought of Judith Butler, Luce Irigaray and Drucilla Cornell, I attempt to create grounds for a language of politics “affected by immanence” (Laruelle).
Katerina Kolozova, PhD. is the director of the Institute in Social Sciences and Humanities-Skopje and a professor of philosophy, sociological theory and gender studies at the University American College-Skopje. She is also visiting professor at several universities in Former Yugoslavia and Bulgaria (the State University of Skopje, University of Sarajevo, University of Belgrade and University of Sofia as well as at the Faculty of Media and Communications of Belgrade). In 2009, Kolozova was a visiting scholar at the Department of Rhetoric (Program of Critical Theory) at the University of California-Berkeley. Kolozova is the author of Cut of the Real: Subjectivity in Poststructuralist Philosophy (2014), The Lived Revolution: Solidarity with the Body in Pain As the New Political Universal (2010), The Real and “I”: On the Limit and the Self (2006), The Crisis of the Subject with Judith Butler and Zarko Trajanoski (2002), and The Death and the Greeks: On Tragic Concepts of Death from Antiquity to Modernity (2000).
Summary: In the midst of the California rainy season, scientists are embarking on a field campaign designed to improve the understanding of the natural and human-caused phenomena that determine when and how the state gets its precipitation. They will do so by studying atmospheric rivers, meteorological events that include the famous rainmaker known as the Pineapple Express.
An atmospheric river reaches the San Francisco Bay Area, Dec. 11, 2014. Credit: University of Wisconsin
In the midst of the California rainy season, scientists are embarking on a field campaign designed to improve the understanding of the natural and human-caused phenomena that determine when and how the state gets its precipitation. They will do so by studying atmospheric rivers, meteorological events that include the famous rainmaker known as the Pineapple Express.
CalWater 2015 is an interagency, interdisciplinary field campaign starting January 14, 2015. CalWater 2015 will entail four research aircraft flying through major storms while a ship outfitted with additional instruments cruises below. The research team includes scientists from Scripps Institution of Oceanography at UC San Diego, the Department of Energy’s Pacific Northwest National Laboratory, NOAA, and NASA and uses resources from the DOE’s Atmospheric Radiation Measurement (ARM) Climate Research Facility — a national scientific user facility.
The study will help provide a better understanding of how California gets its rain and snow, how human activities are influencing precipitation, and how the new science provides potential to inform water management decisions relating to drought and flood.
“After several years in the making by an interdisciplinary science team, and through support from multiple agencies, the CalWater 2015 field campaign is set to observe the key conditions offshore and over California like has never been possible before,” said Scripps climate researcher Marty Ralph, a CalWater lead investigator. “These data will ultimately help develop better climate projections for water and will help test the potential of using existing reservoirs in new ways based on atmospheric river forecasts.”
Like land-based rivers, atmospheric rivers carry massive amounts of moisture long distances — in California’s case, from the tropics to the U.S. West Coast. When an atmospheric river hits the coast, it releases its moisture as precipitation. How much and whether it falls as rain or snow depends on aerosols — tiny particles made of dust, sea salt, volatile molecules, and pollution.
The researchers will examine the strength of atmospheric rivers, which produce up to 50 percent of California’s precipitation and can transport 10-20 times the flow of the Mississippi River. They will also explore how to predict when and where atmospheric rivers will hit land, as well as the role of ocean evaporation and how the ocean changes after a river passes.
“Climate and weather models have a hard time getting precipitation right,” said Ralph. “In fact, the big precipitation events that are so important for water supply and can cause flooding, mostly due to atmospheric rivers, are some of the most difficult to predict with useful accuracy. The severe California drought is essentially a result of a dearth of atmospheric rivers, while, conversely, the risk of Katrina-like damages for California due to severe ARs has also been quantified in previous research.”
For the next month or more, instrument teams will gather data from the NOAA research vessel Ronald H. Brown and two NOAA, one DOE, and one NASA research aircraft with a coordinated implementation strategy when weather forecasters see atmospheric rivers developing in the Pacific Ocean off the coast of California. NASA will also provide remote sensing data for the project.
“Improving our understanding of atmospheric rivers will help us produce better forecasts of where they will hit and when, and how much rain and snow they will deliver,” said Allen White, NOAA research meteorologist and CalWater 2015 mission scientist. “Better forecasts will give communities the environmental intelligence needed to respond to droughts and floods.”
Most research flights will originate at McClellan Airfield in Sacramento. Ground-based instruments in Bodega Bay, Calif., and scattered throughout the state will also collect data on natural and human contributions to the atmosphere such as dust and pollution. This data-gathering campaign follows the 2009-2011 CalWater1 field campaign, which yielded new insights into how precipitation processes in the Sierra Nevada can be influenced by different sources of aerosols that seed the clouds.
“This will be an extremely important study in advancing our overall understanding of aerosol impacts on clouds and precipitation,” said Kimberly Prather, a CalWater lead investigator and Distinguished Chair in Atmospheric Chemistry with appointments at Scripps Oceanography and the Department of Chemistry and Biochemistry at UC San Diego. “It will build upon findings from CalWater1, adding multiple aircraft to directly probe how aerosols from different sources, local, ocean, as well as those from other continents, are influencing clouds and precipitation processes over California.”
“We are collecting this data to improve computer models of rain that represent many complex processes and their interactions with the environment,” said PNNL’s Leung. “Atmospheric rivers contribute most of the heavy rains along the coast and mountains in the West. We want to capture those events better in our climate models used to project changes in extreme events in the future.”
Prather’s group showed during CalWater1 that aerosols can have competing effects, depending on their source. Intercontinental mineral dust and biological particles possibly from the ocean corresponded to events with more precipitation, while aerosols produced by local air pollution correlated with less precipitation.
The CalWater 2015 campaign is comprised of two interdependent efforts. Major investments in facilities include aircraft, ship time, and sensors by NOAA. Marty Ralph, Kim Prather, and Dan Cayan from Scripps, and Chris Fairall, Ryan Spackman, and Allen White of NOAA lead CalWater-2. The DOE-funded ARM Cloud Aerosol Precipitation Experiment (ACAPEX) is led by Ruby Leung from PNNL. NSF and NASA have also provided major support for aspects of CalWater, leveraging the NOAA and DOE investments.
Here’s an exercise: The next time you hear someone talking about algorithms, replace the term with “God” and ask yourself if the meaning changes. Our supposedly algorithmic culture is not a material phenomenon so much as a devotional one, a supplication made to the computers people have allowed to replace gods in their minds, even as they simultaneously claim that science has made us impervious to religion.
It’s part of a larger trend. The scientific revolution was meant to challenge tradition and faith, particularly a faith in religious superstition. But today, Enlightenment ideas like reason and science are beginning to flip into their opposites. Science and technology have become so pervasive and distorted, they have turned into a new type of theology.
The worship of the algorithm is hardly the only example of the theological reversal of the Enlightenment—for another sign, just look at the surfeit of nonfiction books promising insights into “The Science of…” anything, from laughter to marijuana. But algorithms hold a special station in the new technological temple because computers have become our favorite idols.
In fact, our purported efforts to enlighten ourselves about algorithms’ role in our culture sometimes offer an unexpected view into our zealous devotion to them. The media scholar Lev Manovich had this to say about “The Algorithms of Our Lives”:
Software has become a universal language, the interface to our imagination and the world. What electricity and the combustion engine were to the early 20th century, software is to the early 21st century. I think of it as a layer that permeates contemporary societies.
This is a common account of algorithmic culture, that software is a fundamental, primary structure of contemporary society. And like any well-delivered sermon, it seems convincing at first. Until we think a little harder about the historical references Manovich invokes, such as electricity and the engine, and how selectively those specimens characterize a prior era. Yes, they were important, but is it fair to call them paramount and exceptional?
It turns out that we have a long history of explaining the present via the output of industry. These rationalizations are always grounded in familiarity, and thus they feel convincing. But mostly they are metaphors. Here’s Nicholas Carr’s take on metaphorizing progress in terms of contemporary technology, from the 2008 Atlantic cover story that he expanded into his bestselling book The Shallows:
The process of adapting to new intellectual technologies is reflected in the changing metaphors we use to explain ourselves to ourselves. When the mechanical clock arrived, people began thinking of their brains as operating “like clockwork.” Today, in the age of software, we have come to think of them as operating “like computers.”
Carr’s point is that there’s a gap between the world and the metaphors people use to describe that world. We can see how erroneous or incomplete or just plain metaphorical these metaphors are when we look at them in retrospect.
Take the machine. In his book Images of Organization, Gareth Morgan describes the way businesses are seen in terms of different metaphors, among them the organization as machine, an idea that forms the basis for Taylorism.
Gareth Morgan’s metaphors of organization (Venkatesh Rao/Ribbonfarm)
We can find similar examples in computing. For Larry Lessig, the accidental homophony between “code” as the text of a computer program and “code” as the text of statutory law becomes the fulcrum on which his argument that code is an instrument of social control balances.
Each generation, we reset a belief that we’ve reached the end of this chain of metaphors, even though history always proves us wrong precisely because there’s always another technology or trend offering a fresh metaphor. Indeed, an exceptionalism that favors the present is one of the ways that science has become theology.
In fact, Carr fails to heed his own lesson about the temporariness of these metaphors. Just after having warned us that we tend to render current trends into contingent metaphorical explanations, he offers a similar sort of definitive conclusion:
Today, in the age of software, we have come to think of them as operating “like computers.” But the changes, neuroscience tells us, go much deeper than metaphor. Thanks to our brain’s plasticity, the adaptation occurs also at a biological level.
As with the machinic and computational metaphors that he critiques, Carr settles on another seemingly transparent, truth-yielding one. The real firmament is neurological, and computers are fitzing with our minds, a fact provable by brain science. And actually, software and neuroscience enjoy a metaphorical collaboration thanks to artificial intelligence’s idea that computing describes or mimics the brain. Compuplasting-as-thought reaches the rank of religious fervor when we choose to believe, as some do, that we can simulate cognition through computation and achieve the singularity.
* * *
The metaphor of mechanical automation has always been misleading anyway, with or without the computation. Take manufacturing. The goods people buy from Walmart appear safely ensconced in their blister packs, as if magically stamped out by unfeeling, silent machines (robots—those original automata—themselves run by the tinier, immaterial robots algorithms).
But the automation metaphor breaks down once you bother to look at how even the simplest products are really produced. The photographer Michael Wolf’s images of Chinese factory workers and the toys they fabricate show that finishing consumer goods to completion requires intricate, repetitive human effort.
Eyelashes must be glued onto dolls’ eyelids. Mickey Mouse heads must be shellacked. Rubber ducky eyes must be painted white. The same sort of manual work is required to create more complex goods too. Like your iPhone—you know, the one that’s designed in California but “assembled in China.” Even though injection-molding machines and other automated devices help produce all the crap we buy, the metaphor of the factory-as-automated machine obscures the fact that manufacturing isn’t as machinic nor as automated as we think it is.
The algorithmic metaphor is just a special version of the machine metaphor, one specifying a particular kind of machine (the computer) and a particular way of operating it (via a step-by-step procedure for calculation). And when left unseen, we are able to invent a transcendental ideal for the algorithm. The canonical algorithm is not just a model sequence but a concise and efficient one. In its ideological, mythic incarnation, the ideal algorithm is thought to be some flawless little trifle of lithe computer code, processing data into tapestry like a robotic silkworm. A perfect flower, elegant and pristine, simple and singular. A thing you can hold in your palm and caress. A beautiful thing. A divine one.
But just as the machine metaphor gives us a distorted view of automated manufacture as prime mover, so the algorithmic metaphor gives us a distorted, theological view of computational action.
“The Google search algorithm” names something with an initial coherence that quickly scurries away once you really look for it. Googling isn’t a matter of invoking a programmatic subroutine—not on its own, anyway. Google is a monstrosity. It’s a confluence of physical, virtual, computational, and non-computational stuffs—electricity, data centers, servers, air conditioners, security guards, financial markets—just like the rubber ducky is a confluence of vinyl plastic, injection molding, the hands and labor of Chinese workers, the diesel fuel of ships and trains and trucks, the steel of shipping containers.
Once you start looking at them closely, every algorithm betrays the myth of unitary simplicity and computational purity. You may remember the Netflix Prize, a million dollar competition to build a better collaborative filtering algorithm for film recommendations. In 2009, the company closed the book on the prize, adding a faux-machined “completed” stamp to its website.
But as it turns out, that method didn’t really improve Netflix’s performance very much. The company ended up downplaying the ratings and instead using something different to manage viewer preferences: very specific genres like “Emotional Hindi-Language Movies for Hopeless Romantics.” Netflix calls them “altgenres.”
An example of a Netflix altgenre in action (tumblr/Genres of Netflix)
While researching an in-depth analysis of altgenres published a year ago at The Atlantic, Alexis Madrigal scraped the Netflix site, downloading all 76,000+ micro-genres using not an algorithm but a hackneyed, long-running screen-scraping apparatus. After acquiring the data, Madrigal and I organized and analyzed it (by hand), and I built a generator that allowed our readers to fashion their own altgenres based on different grammars (like “Deep Sea Forbidden Love Mockumentaries” or “Coming-of-Age Violent Westerns Set in Europe About Cats”).
Netflix VP Todd Yellin explained to Madrigal why the process of generating altgenres is no less manual than our own process of reverse engineering them. Netflix trains people to watch films, and those viewers laboriously tag the films with lots of metadata, including ratings of factors like sexually suggestive content or plot closure. These tailored altgenres are then presented to Netflix customers based on their prior viewing habits.
One of the hypothetical, “gonzo” altgenres created by The Atlantic‘s Netflix Genre Generator (The Atlantic)
Despite the initial promise of the Netflix Prize and the lurid appeal of a “million dollar algorithm,” Netflix operates by methods that look more like the Chinese manufacturing processes Michael Wolf’s photographs document. Yes, there’s a computer program matching viewing habits to a database of film properties. But the overall work of the Netflix recommendation system is distributed amongst so many different systems, actors, and processes that only a zealot would call the end result an algorithm.
The same could be said for data, the material algorithms operate upon. Data has become just as theologized as algorithms, especially “big data,” whose name is meant to elevate information to the level of celestial infinity. Today, conventional wisdom would suggest that mystical, ubiquitous sensors are collecting data by the terabyteful without our knowledge or intervention. Even if this is true to an extent, examples like Netflix’s altgenres show that data is created, not simply aggregated, and often by means of laborious, manual processes rather than anonymous vacuum-devices.
Once you adopt skepticism toward the algorithmic- and the data-divine, you can no longer construe any computational system as merely algorithmic. Think about Google Maps, for example. It’s not just mapping software running via computer—it also involves geographical information systems, geolocation satellites and transponders, human-driven automobiles, roof-mounted panoramic optical recording systems, international recording and privacy law, physical- and data-network routing systems, and web/mobile presentational apparatuses. That’s not algorithmic culture—it’s just, well, culture.
* * *
If algorithms aren’t gods, what are they instead? Like metaphors, algorithms are simplifications, or distortions. They are caricatures. They take a complex system from the world and abstract it into processes that capture some of that system’s logic and discard others. And they couple to other processes, machines, and materials that carry out the extra-computational part of their work.
Unfortunately, most computing systems don’t want to admit that they are burlesques. They want to be innovators, disruptors, world-changers, and such zeal requires sectarian blindness. The exception is games, which willingly admit that they are caricatures—and which suffer the consequences of this admission in the court of public opinion. Games know that they are faking it, which makes them less susceptible to theologization. SimCity isn’t an urban planning tool, it’s a cartoon of urban planning. Imagine the folly of thinking otherwise! Yet, that’s precisely the belief people hold of Google and Facebook and the like.
A Google Maps Street View vehicle roams the streets of Washington D.C. Google Maps entails algorithms, but also other things, like internal combustion engine automobiles. (justgrimes/Flickr)
Just as it’s not really accurate to call the manufacture of plastic toys “automated,” it’s not quite right to call Netflix recommendations or Google Maps “algorithmic.” Yes, true, there are algorithmsw involved, insofar as computers are involved, and computers run software that processes information. But that’s just a part of the story, a theologized version of the diverse, varied array of people, processes, materials, and machines that really carry out the work we shorthand as “technology.” The truth is as simple as it is uninteresting: The world has a lot of stuff in it, all bumping and grinding against one another.
I don’t want to downplay the role of computation in contemporary culture. Striphas and Manovich are right—there are computers in and around everything these days. But the algorithm has taken on a particularly mythical role in our technology-obsessed era, one that has allowed it wear the garb of divinity. Concepts like “algorithm” have become sloppy shorthands, slang terms for the act of mistaking multipart complex systems for simple, singular ones. Of treating computation theologically rather than scientifically or culturally.
This attitude blinds us in two ways. First, it allows us to chalk up any kind of computational social change as pre-determined and inevitable. It gives us an excuse not to intervene in the social shifts wrought by big corporations like Google or Facebook or their kindred, to see their outcomes as beyond our influence. Second, it makes us forget that particular computational systems are abstractions, caricatures of the world, one perspective among many. The first error turns computers into gods, the second treats their outputs as scripture.
Computers are powerful devices that have allowed us to mimic countless other machines all at once. But in so doing, when pushed to their limits, that capacity to simulate anything reverses into the inability or unwillingness to distinguish one thing from anything else. In its Enlightenment incarnation, the rise of reason represented not only the ascendency of science but also the rise of skepticism, of incredulity at simplistic, totalizing answers, especially answers that made appeals to unseen movers. But today even as many scientists and technologists scorn traditional religious practice, they unwittingly invoke a new theology in so doing.
Algorithms aren’t gods. We need not believe that they rule the world in order to admit that they influence it, sometimes profoundly. Let’s bring algorithms down to earth again. Let’s keep the computer around without fetishizing it, without bowing down to it or shrugging away its inevitable power over us, without melting everything down into it as a new name for fate. I don’t want an algorithmic culture, especially if that phrase just euphemizes a corporate, computational theocracy.
But a culture with computers in it? That might be all right.
I FIRST ENCOUNTEREDUlrich Beck as a (superannuated) postdoc. I was a Humboldt Stipendiat in Berlin, where in 1987, I heard the sociologist Helmuth Berking give a paper on Beck’s “Reflexive Modernisierung” (Reflexive Modernization) at a Freie Universität colloquium. I had already published a paper called “Postmodernity and Desire” in the journal Theory and Society, and Beck’s notion of reflexive modernization seemed to point to an opening beyond the modern/postmodern impasse. Today, Foucault, Deleuze, and even Lebenssoziologie (Life sociology) are all present in German intellectual life. But in 1987, this kind of stuff was beyond the pale. Habermas and Enlightenment modernism ruled. And rightly so: It is largely thanks to Habermas that Germany now is a land rooted less in fiercely nationalistic Blut und Boden (Blood-and-Soil) than in a more pluralistic Verfassungspatriotismus (Constitutional Patriotism).
Beck’s foundational Risikogesellschaft (Risk Society), however, abandoned the order of Habermas’s “ideal speech situation” for contingency and unintended consequences. This was hardly a celebration of contingency; Beckian contingency was rooted in the Chernobyl disaster; it was literally a poison, or in German a Gift. Hence Beck’s subsequent book was entitled Gegengift, or “Counter-poison.” It was subtitled Die organisierte Unverantwortlichkeit (The Organized Irresponsibility). Beck’s point was that institutions needed to be responsible for a politics of antidote that would address the unintentional generation of environmental crises. This was a critique of systematic institutional irresponsibility—or more literally “un-responsibility”—for ecological disaster. Beck’s thinking became more broadly accepted in Germany over the years. Yet the radically original themes of contingency and unintended consequences remained central to Beck’s own vision of modernity and inspired a generation of scholars.
Beck’s influence has been compared by Joan Subirats, writing in in El País, to that of Zygmunt Baumanand Richard Sennett. Yet there is little in Bauman’s idea of liquidity to match the power of Beck’s understanding of reflexivity. It was based in a sociology of knowledge in which the universal of the concept could never subsume the particular of the empirical. At the same time, Beck’s subject was still knowledge, not the impossibility of knowledge and inevitability of the irrational (not, in other words, the “known unknowns” and the “unknown unknowns” that have proved so damaging to contemporary political thought). Beck’s reflexivity, then, was not just about a Kant’s What can I know?—it was just as much a question of the Kantian What should I do? and especially What can I hope?
For Beck, “un-responsible” institutions were still situated in what he referred to as “simple modernity.” They would need to deal with modernity’s ecological contingency in order to be reflexive. They would need to be aware of unintended consequences, of what environmental economists (and later the theory of cognitive capitalism) would understand as “externalities.” Beck’s reflexivity extended to his later work on cosmopolitanism and Europe. For him, Europe is not an ordering of states as atoms, in which one is very much like the other. It is instead a collection of singularities. Hence his criticism of German Europe’s “Merkiavelli”-ism in treating Greece and the European South as if all were uniform Teutonic entities to be subject to the principle of austerity.
Though Beck has remained highly influential, Bruno Latour’s “actor-network” theory has outstripped his ideas in terms of popularity, establishing a dominant paradigm among sociologists. Yet the instrumentalist assumptions of actor-network theory do not open up the ethical or hopeful dimension of Beck’s work. The latter has been a counter-poison, an antidote to the instrumentalism at the heart of today’s neoliberal politics, in which our singularity has been eroded under the banner of a uniform and possessive individualism. Because of the contingency at its heart, Beck’s work could never become a dominant paradigm.
Beck’s ideas clearly drove the volume Reflexive Modernization, which he, Anthony Giddens, and I published in 1994. There, I developed a notion of “aesthetic reflexivity,” and although in some ways I am more of a Foucault, Deleuze, and perhaps Walter Benjamin guy, Beck’s ideas still drive my own work today. Thus we should extend Beckian reflexivity to speak of a reflexive community, and of a necessary risk-sharing that must be at the heart of any contemporary politics of the commons.
I was offered the post to be Ulrich’s Nachfolger (successor) at University of Bamberg when he moved to Munich in 1992. In the end, I decided to stay in the UK, but we kept in touch. Although to a certain extent I’ve become a cultural theorist, Ulrich always treated me as a sociologist, and he was right: When I attended his seventieth birthday party in April 2014, all of cultural Munich was there, from newspaper editors to museum directors. Every February, when he was based at the London School of Economics, Ulrich and his wife Elisabeth would spend a Sunday afternoon with Celia Lury and me at our house in Finsbury Park/Highbury, enjoying a lunch of Kaffee und Kuchen (coffee and cake) and deli cheeses and hams. No more than a fortnight before his death Ulrich emailed me about February 2015. I replied sadly that I would be in Asia and for the first time would miss this annual Sunday gathering. At his seventieth birthday Ulrich was in rude health. I was honestly looking forward to his eightieth. Now neither the Islington Sundays nor the eightieth birthday will happen. It is sad.
Scott Lash is the Research Director at the Center for Cultural Studies at Goldsmiths, University of London.
THE DEATH OF ULRICH BECK is terrible news. It is a tragedy for his family, for his research team, and for his many colleagues and friends, but it is also a tragedy for European thought.
Ulrich was a public intellectual of the infinitely rare kind in Germany, one that was thought only to exist in France. But he had a very individual way—and not at all French—of exercising this authority of thought: There was nothing of the intellectual critic in him. All his energy, his generosity, his infinite kindness, were put in the service of discovering what actors were in the midst of changing about their way of producing the social world. So for him, it was not about discovering the existing laws of such a world or about verifying, under new circumstances, the stability of old conceptions of sociology. No: It was the innovations in ways of being in the world that interested him above all. What’s more, he didn’t burden himself with a unified, seemingly scientific apparatus in order to locate those innovations. Objectivity, in his eyes, was going to come from his ability to modify the explanatory framework of sociology at the same time as actors modified their way of connecting to one another. His engagement consisted of simply prolonging the innovations he observed in them, innovations from which he was able to extricate power.
This ability to modify the explanatory framework was something that Ulrich would first manifest in his invention of the concept of Risikogesellschaft (risk society), which was initially so difficult to comprehend. By the term risk, he didn’t mean that life was more dangerous than before, but that the production of risks was henceforth a constituent part of modern life and that it was foolhardy to pretend that we were going to take control of them. To the contrary, it was necessary to replace the question of the mode of production and of the unequal distribution of wealth with the symmetrical question of the mode of production and the unequal distribution of ills. Coincidentally, the same year that he proposed the term Risikogesellschaft, the catastrophe of Chernobyl lent his diagnostic an indisputable significance—a diagnostic that current ecological transformations have only reinforced.
In turning the uneven division of ills into the common thread of his inquiries, Ulrich would gradually change the vocabulary of the social sciences. And, first and foremost, he changed the understanding of the relationship between societies and their environment. Everything that had seemed to be outside of culture—and outside of sociology—he would gradually reintegrate, because the consequences of industrial, scientific, and military actions were henceforth part of the very definition of communal life. Everything that modernity had decided to put off until later, or simply to deny, needed to become the very content of collective existence. Hence the delicate and intensely discussed expression “reflexive modernity” or “second modernity.”
This attention to risk would, in turn, modify all the usual ingredients of the social sciences: First, politics—its conventional definition gradually being emptied of its content while Ulrich’s notion of “subpolitics” spread everywhere—but also psychology, the elements of which never ceased to change, along with the limits of collectives. Even love, to which he devoted two books with his wife Elisabeth Beck-Gernsheim, who is so grief stricken today. Yes, Ulrich Beck went big. Perhaps this is why, on a visit to Munich, he was keen to take me on a pilgrimage to Max Weber’s house. The magnitude of Beck’s conceptions, the audacity of trying to rethink—with perfect modesty and without any pretension of style, without considering himself to be the great innovator that he was—truly made him a descendant of Weber. Like him, Beck wanted sociology to encompass everything.
What makes Beck’s death all the harder to accept, for everyone following his work, is that for many years he was making the social sciences undergo a kind of de-nationalization of its methods and theoretical frameworks. Like the question of risk, the question of cosmopolitism (or better, of cosmopolitanism) was one of his great concerns. By this venerable term, he was not designating some call for the universal human, but the redefinition of humans belonging to something other than nation-states. Because his investigations constantly butted against the obstacle of collected facts managed, conceived of, and diffused by and for states—which clearly made impossible any objective approach toward the new kinds of associations for which the empty term globalization did not allow—the methods of examination themselves had to be radically modified. In this, he was succeeding, as can be seen in the impressive expansion of his now leaderless research group.
Beck manifested this mistrust of the nation-state framework in a series of books, articles, and even pamphlets on the incredible experience of the construction of Europe, a phenomenon so admirable and yet so constantly disdained. He imagined a Europe of new affiliations, as opposed to a Europe of nation-states (and, in particular, in contrast to a uniquely Germanic or French conception of the state). How sad it is to think that such an essential question, yet one that is of interest to so few thinkers, can no longer be discussed with him.
I cannot imagine a sadder way to greet the new year, especially considering that Beck’s many research projects (we were just talking about them again in Paris a few weeks ago) addressed the most urgent questions of 2015: How to react to the world’s impotence on the question of climate change? How to find an adequate response to the resurgences of nationalisms? How to reconsider Europe through conceptions of territory and identity that are not a crude and completely obsolete reprise of sovereignty? That European thought has lost at this precise moment such a source of intelligence, innovation, and method is a true tragedy. When Beck asked, in a recent interview, “How does the transformative power of global risk (Weltrisikogesellschaft) transform politics?” no one could have suspected that he was going to leave us with the anxiety of finding the answer alone.
Bruno Latour is professor at Sciences Po Paris and Centennial Professor at the London School of Economics.
Translated from French by Molly Stevens.
A version of this text was published in German on January 5 in the Frankfurter Allgemeine Zeitung.
Governments that want the natural sciences to deliver more for society need to show greater commitment towards the social sciences and humanities.
30 December 2014
Nature 517, 5 (01 January 2015) doi:10.1038/517005a
Physics, chemistry, biology and the environmental sciences can deliver wonderful solutions to some of the challenges facing individuals and societies, but whether those solutions will gain traction depends on factors beyond their discoverers’ ken. That is sometimes true even when the researchers are aiming directly at the challenge. If social, economic and/or cultural factors are not included in the framing of the questions, a great deal of creativity can be wasted.
This message is not new. Yet it gets painfully learned over and over again, as funders and researchers hoping to make a difference to humanity watch projects fail to do so. This applies as much to business as to philanthropy (ask manufacturers of innovative crops).
All credit, therefore, to those who establish multidisciplinary projects — for example, towards enhancing access to food and water, in adaptation to climate change, or in tackling illness — and who integrate natural sciences, social sciences and humanities from the outset. The mutual framing of challenges is the surest way to overcome the conceptual diversities and gulfs that can make such collaborations a challenge.
All credit, too, to leading figures in policy who demonstrate their commitment to this multidimensional agenda. And all the more reason for concern when governments show none of the same comprehension.
Such is the case in the United Kingdom. Research-wise, the country is in a state that deserves a bit of attention from others and certainly merits some concern from its own citizens. Its university funders last month announced the results of a unique exercise in nationwide research assessment — the Research Excellence Framework (REF), which will have a major impact on the direction of university funding. Almost simultaneously, its government released a strategy document: ‘Our plan for growth: science and innovation’. And in November, its government’s chief science adviser published a wide-ranging annual report that reflects the spirit of inclusiveness mentioned above. Unfortunately, the government’s strategy does not.
The importance of inclusivity
Whatever the discipline, a sensible research-assessment policy puts a high explicit value both on outstanding discovery and scholarship, and on making a positive impact beyond academia. In that spirit, the REF (www.ref.ac.uk) aggregatedthree discretely documented aspects of the research of each university department: the quality and importance of the department’s academic output, given a 65% weighting in the overall grade; the quality of the research environment (15%); and the reach and significance of its impact beyond academia (20%).
The influences of the data and panel processes that went into the REF results will not be analysed publicly until March. The signs are that the impacts component of assessment has allowed some universities to rise higher up the rankings than they would otherwise. But the full benefits and perverse incentives of the system will take deeper analysis to resolve.
“If you want science to deliver for society, you need to support a capacity to understand that society.”
A remarkable and contentious aspect of UK science policy is the extent to which the REF rankings will determine funding. The trend has been for such exercises to concentrate funding sharply towards the upper tiers of the rankings.
Most important in the current context is whether an over-dependence on funding formulae will undermine the nation’s abilities to meet its future needs. A preliminary analysis by a policy magazine, Research Fortnight, reaches a pessimistic conclusion for those who believe that the social sciences are strategically important: given the REF results, the social sciences will gain a smaller slice of the pie than the size of the community might have suggested. If that reflects underperformance in social science at a national scale, and given the strategic importance of these disciplines, a national ambition in, for example, sociology, anthropology and psychology that reaches beyond the funding formula needs to be energized.
A reader of the government’s science and innovation strategy (go.nature.com/u5xbnx) might reach the same conclusion. Its fundamental message is to be welcomed: understandably focusing on enhancing economic growth, it highlights the need for support of fundamental research, open information, strategic technologies and stimuli for business engagement and investment. But there is just one sentence that deals with the social sciences and humanities: a passing mention in the introduction that they are included whenever the word ‘science’ is used.
Credit to both chief science adviser Mark Walport and his predecessor, John Beddington, for their explicit and proactive engagement with the social sciences. This year’s report, ‘Innovation: managing risk, not avoiding it’ (see go.nature.com/lwf1o7), demonstrates a commitment to inclusivity: it is a compendium of opinion and reflection from experts in psychology, behavioural science, statistics, risk, sociology, law, communication and public engagement, as well as natural sciences.
An example of the report’s inclusive merits can be found in the sections on uncertainty, communication, conversations and language, in which heavyweight academics highlight key considerations in dealing with contentious and risk-laden areas of innovation. Case studies relating to nuclear submarines, fracking and flood planning are supplied by professionals and advocates directly involved in the debates. This is complemented by discussions of the human element in estimating risk from the government’s behavioural insights team, as well as discussions of how the contexts of risk-laden decisions play a part. Anyone who has a stake in science or technology that is in the slightest bit publicly contentious will find these sections salutary.
The report’s key message should be salutary for policy-makers worldwide. If you want science to deliver for society, through commerce, government or philanthropy, you need to support a capacity to understand that society that is as deep as your capacity to understand the science. And your policy statements need to show that you believe in that necessity.
POSTED ON JANUARY 15, 2015 AT 11:05 AM UPDATED: JANUARY 15, 2015 AT 1:50 PM
A Sri Lankan man throws his bait as he fishes in Colombo, Sri Lanka, Monday, July 1, 2013.
CREDIT: AP PHOTO/ERANGA JAYAWARDENA
A new study from scientists at Harvard and Rutgers Universities has been sweepingtheinternet, and for good reason: it shows, quite alarmingly, that the planet’s seas have been rising much faster than we thought.
The research can be confusing on its face. At first glance, it shows that scientists have actually been overstating the rate of sea level rise for the first 90 years of the 20th century. Instead of rising about six inches over that period of time, the Harvard and Rutgers scientists discovered that the sea actually only rose by about five inches. That’s a big overstatement — a two quadrillion gallon overstatement, in fact — enough to fill three billion Olympic-size swimming pools, the New York Times reported.
But here’s the thing. If the sea wasn’t rising as steadily as we believed from 1900 to 1990, that means that it has been rising much more quickly than we thought from 1990 to the present day. In other words, we used to think the rate of acceleration of sea level rise in the last 25 years was only a little worse compared to the past — now that we know the rate used to be much slower, we know that it’s much worse.
This chart shows as estimate of global sea level side from four different analyses, shown in red, blue, purple, and black. Shaded regions show uncertainty.
CREDIT: NATURE
“What this paper shows is that the sea-level acceleration over the past century has been greater than had been estimated by others,” lead writer Eric Morrow said in a statement. “It’s a larger problem than we initially thought.”
Specifically, previous research had stated the seas rose about two-thirds of an inch per decade between 1900 and 1990. But with the new study, that rate was recalculated to less than half an inch a decade. Both old and new research say that since 1990, the ocean has been rising at about 1.2 inches a decade, meaning the gap is much wider than previously thought.
Most scientists believe that the main driver of sea level rise is the thermal expansion of warming oceans and the melting of the world’s ice sheets and mountain glaciers, two phenomena driven by global warming. Antarctica, for example, is losing land ice at an accelerating rate. In December, scientists discovered that a West Antarctic ice sheet roughly the size of Texas is losing the amount of ice equivalent to Mount Everest every two years, representing a melt rate that has tripled over the last decade.
The common skeptic argument is that while Antarctica is losing land ice, it is actually gaining sea ice. While that’s true, sea ice melt does not affect sea level rise. It’s like an ice cube in a glass — if it melts, nothing happens. Up north in the Arctic, however, the loss of sea ice is just as important to look at, because when it melts, more sunlight is absorbed by the oceans. In Antarctica, sea ice melt is less of a problem for ocean warmth.
In addition, tropical glaciers in the Andes Mountains are melting, threatening freshwater supplies in South America. Some scientists have also predicted that the Greenland Ice Sheet — which covers about 80 percent of the massive country — is approaching a “tipping point” that could also have “huge implications” for global sea levels and ocean carbon dioxide absorption.
“We know the sea level is changing for a variety of reasons,” study co-author Carling Hay said. “There are ongoing effects due to the last ice age, heating and expansion of the ocean due to global warming, changes in ocean circulation, and present-day melting of land-ice, all of which result in unique patterns of sea-level change.”
All that may seem pretty grim, but there is a least one good thing to come out of the research — a new and hopefully more accurate method for measuring sea level rise. Before this study, scientists estimated global sea level by essentially dropping long yard sticks into different points of the ocean, and then averaging out the measurements to see if the ocean rose or fell.
For this study, Morrow and Hay attempted to use the data from how individual ice sheets contribute to global sea-level rise, and how ocean circulation is changing to inform their measurements. If the method proves to be better, it could serve to, as the New York Times put it, “increase scientists’ confidence that they understand precisely why the ocean is rising — and therefore shore up their ability to project future increases.”
Summary: The year 2014 ranks as Earth’s warmest since 1880, according to two separate analyses by NASA and National Oceanic and Atmospheric Administration (NOAA) scientists. The 10 warmest years in the instrumental record, with the exception of 1998, have now occurred since 2000. This trend continues a long-term warming of the planet, according to an analysis of surface temperature measurements.
This color-coded map displays global temperature anomaly data from 2014. Credit: NASA’s Goddard Space Flight Center
The year 2014 ranks as Earth’s warmest since 1880, according to two separate analyses by NASA and National Oceanic and Atmospheric Administration (NOAA) scientists.
The 10 warmest years in the instrumental record, with the exception of 1998, have now occurred since 2000. This trend continues a long-term warming of the planet, according to an analysis of surface temperature measurements by scientists at NASA’s Goddard Institute of Space Studies (GISS) in New York.
In an independent analysis of the raw data, also released Friday, NOAA scientists also found 2014 to be the warmest on record.
“NASA is at the forefront of the scientific investigation of the dynamics of the Earth’s climate on a global scale,” said John Grunsfeld, associate administrator for the Science Mission Directorate at NASA Headquarters in Washington. “The observed long-term warming trend and the ranking of 2014 as the warmest year on record reinforces the importance for NASA to study Earth as a complete system, and particularly to understand the role and impacts of human activity.”
Since 1880, Earth’s average surface temperature has warmed by about 1.4 degrees Fahrenheit (0.8 degrees Celsius), a trend that is largely driven by the increase in carbon dioxide and other human emissions into the planet’s atmosphere. The majority of that warming has occurred in the past three decades.
“This is the latest in a series of warm years, in a series of warm decades. While the ranking of individual years can be affected by chaotic weather patterns, the long-term trends are attributable to drivers of climate change that right now are dominated by human emissions of greenhouse gases,” said GISS Director Gavin Schmidt.
While 2014 temperatures continue the planet’s long-term warming trend, scientists still expect to see year-to-year fluctuations in average global temperature caused by phenomena such as El Niño or La Niña. These phenomena warm or cool the tropical Pacific and are thought to have played a role in the flattening of the long-term warming trend over the past 15 years. However, 2014’s record warmth occurred during an El Niño-neutral year.
“NOAA provides decision makers with timely and trusted science-based information about our changing world,” said Richard Spinrad, NOAA chief scientist. “As we monitor changes in our climate, demand for the environmental intelligence NOAA provides is only growing. It’s critical that we continue to work with our partners, like NASA, to observe these changes and to provide the information communities need to build resiliency.”
Regional differences in temperature are more strongly affected by weather dynamics than the global mean. For example, in the U.S. in 2014, parts of the Midwest and East Coast were unusually cool, while Alaska and three western states — California, Arizona and Nevada — experienced their warmest year on record, according to NOAA.
The GISS analysis incorporates surface temperature measurements from 6,300 weather stations, ship- and buoy-based observations of sea surface temperatures, and temperature measurements from Antarctic research stations. This raw data is analyzed using an algorithm that takes into account the varied spacing of temperature stations around the globe and urban heating effects that could skew the calculation. The result is an estimate of the global average temperature difference from a baseline period of 1951 to 1980.
NOAA scientists used much of the same raw temperature data, but a different baseline period. They also employ their own methods to estimate global temperatures.
GISS is a NASA laboratory managed by the Earth Sciences Division of the agency’s Goddard Space Flight Center, in Greenbelt, Maryland. The laboratory is affiliated with Columbia University’s Earth Institute and School of Engineering and Applied Science in New York.
NASA monitors Earth’s vital signs from land, air and space with a fleet of satellites, as well as airborne and ground-based observation campaigns. NASA develops new ways to observe and study Earth’s interconnected natural systems with long-term data records and computer analysis tools to better see how our planet is changing. The agency shares this unique knowledge with the global community and works with institutions in the United States and around the world that contribute to understanding and protecting our home planet.
The data set of 2014 surface temperature measurements is available at:
Source: Institut de Recherche pour le Développement (IRD)
Summary: The earthquake that rocked Haiti on 12 January 2010 was one of the four greatest killers recorded worldwide since 1990. It smacked headlong into the metropolitan area of Port-au-Prince, home to over one in five Haitians, destroying public buildings and housing as it went. Despite the immediate response from the international community, with rescue teams and pledges of financial assistance and support for reconstruction and development, things are still far from back to normal.
The earthquake that rocked Haiti on 12 January 2010 was one of the four greatest killers recorded worldwide since 1990. It smacked headlong into the metropolitan area of Port-au-Prince, home to over one in five Haitians, destroying public buildings and housing as it went. Despite the immediate response from the international community, with rescue teams and pledges of financial assistance and support for reconstruction and development, things are still far from back to normal.
Haiti is one of the most vulnerable developing countries when it comes to natural disasters and the most exposed country in the region. The earthquake’s repercussions were much more dramatic here than in other countries hit by stronger earthquakes. For example, an earth-quake of the same magnitude hit Christchurch, New Zealand’s second-largest city, that same year with no fatalities. Other recurring factors in addition to the country’s vulnerability to natural shocks have contributed to Haiti’s economic deterioration, with chronic political and institutional instability and a poor education system top of the list.
Following the phase of emergency aid to earth-quake victims more than four years ago, the time has come to review and analyse its impacts on Haitian society. A robust, constructive diagnosis of the post-earthquake situation, especially household living conditions and the labour mar-ket, calls for high-quality representative statistical data that are hard to collect in crisis and post-crisis situations. Yet a diagnosis is needed if improvements are to be made on public em-ployment, housing and sustainable reconstruc-tion policies and to natural disaster management policies, including preventive measures. An as-sessment of this sort also needs to provide in-formation on the impact of aid, especially inter-national aid whose effectiveness has been ques-tioned. Such was the purpose of the Post-Earthquake Living Conditions Survey (ECVMAS) conducted in late 2012. The Haitian Statistics and Data Processing Institute (IHSI) worked with DIAL and the World Bank to sur-vey a sample of 5,000 households representative of the entire population. It was the first national socioeconomic survey to be taken since the earthquake.
2014 was 0.69°C (1.24°F) above the 20th century average of 14.1°C, making it the hottest year on record since NOAA’s National Climatic Data Center began taking measurements in 1880. The record surpassed the previous hottest year record, shared by 2005 and 2010, by 0.04°C (0.07°F). As the Earth heats up, new temperature records are increasingly common, but 2014’s record-breaking global temperature—which represents the average of land and ocean surface temperatures—is especially remarkable given that 2014 saw little influence from El Niño warming and was an ENSO-neutral year. Here is some important context on how the 2014 temperature record reaffirms long-term, human-caused global warming trends; how recent warming is tied to extreme weather patterns; and how analysts use global temperature datasets to assess the state of the climate. Top points to note include:
In 2014, the U.S. saw unprecedented levels of simultaneous extreme heat in the West and cooler than average temperatures in the East, with both trends linked to global warming.
2014’s heat record is alarming in the absence of a full El Niño-Southern Oscillation (ENSO) and provides yet more evidence that that human-caused warming is now the dominant force driving changes in global temperature trends.
Global warming is not only on the rise but is fueling extreme weather and unprecedented patterns of extreme temperature anomalies.
Sea surface temperatures in particular are reaching record highs, driving extreme atmospheric patterns that cause heavy rainfall and floods in some countries and droughts in others.
Three of the four major groups that track combined ocean and land surface global temperatures—NOAA, NASA, and the JMA— have confirmed that 2014 was the hottest year on record, even with biases that underestimate warming in the ocean and Arctic.
Record Heat Supports Long-Term Warming Trend
Climate change linked to unusual temperature trends in the U.S.
Human-caused warming in 2014 trumped the ENSO signal.
February 1985 was the last month where global temperature fell below the 20th century monthly average, making December 2014 the 358th consecutive month where global land and ocean surface temperature was above average. Each of the last three decades has been much warmer than the decade before. In the 1990s, every year was warmer than the average of the previous decade, and the 2000s were warmer still. Now, according to NOAA, thirteen out of fifteen of the hottest years on record occurred since 2000, and the two exceptions (1997 and 1998) were strong El Niño years. In 2014, six out of 12 months tied or topped previous monthly global temperature records.
The combination of human-caused warming and year-to-year natural variation has generally determined which years set new temperature records. Prior to 2014, 2010 and 2005 tied for the hottest year on record, both of which were El Niño years. This makes sense because, in addition to long-term warming due to an increase in atmospheric greenhouse gases, the ENSO can bump global temperatures up or down for one to several years at a time. During El Niño events, some of the heat that gets stored in the oceans spreads out and gets released back into the atmosphere, causing large-scale atmospheric circulation changes and an increase in global temperature. La Niña periods, on the other hand, are characterized by cooler than average temperatures.
What makes 2014 especially remarkable is that it set a new global temperature record during an ENSO-neutral year. From January-February 2014, sea surface temperatures were mostly below average across the eastern equatorial Pacific. By the fall, temperatures were above average, leading to speculation about the onset of an El Niño event. Scientists in the U.S. have three criteria, each of which must be met to officially declare the start of an El Niño. Conditions in the fall of 2014 met the first two criteria (that monthly sea surface temperature anomalies exceed 0.5°C and last across several seasons), but not the final criterion (observance of an atmospheric response associated with more rain over the central Pacific and less rain over Indonesia).
Global annual average temperature anomalies (relative to the 1961-1990 average) for 1950-2013 based on an average of the three data sets from NASA, NOAA and the UK Met Office. Coloring indicates whether a year was classified as an El Niño year (red), an ENSO neutral year (grey) or a La Niña year (blue).
This means 2014 was the hottest year on record without the added boost from a full-fledged El Niño event, and it will have been even warmer than recent years with moderate ENSO contributions (2010 and 2005). Moreover, this implies that the amount of warming due to human activity is enough to trump the natural year-to-year variation associated with the ENSO cycle. With NOAA holding there is a 50-60 percent chance of a noteworthy El Niño event developing in early 2015, there’s a good chance 2015 will be even hotter, making for two record-setting years in a row. What’s more, as more heat is pumped into the ocean, climate models project a doubling in the frequency of extreme El Niño events in the future.
Record ocean surface temperatures driving 2014’s heat demonstrate the ocean’s role as an important heat sink and are linked to unusual atmospheric patterns.
Global average sea surface temperature (which is a conservative and incomplete cross-section of the ocean) has shown an alarming trend in 2014. From MaythroughNovember, each month set a new record for global sea surface temperature anomaly (or departure from average), with June also setting a new record for the highest departure from average for any month. The record was short-lived, however, as June’s temperatures were quickly surpassed first in August and then again in September. A study analyzing the record ocean surface warming in 2014 finds that unusually warm surface temperatures in the North Pacific were largely responsible. While it is still too soon to know for sure, this could indicate the start of a new trend where the massive amount of heat being absorbed by the ocean is making its way to the surface, and getting reflected in surface temperatures.
Oceanic warming is especially worrisome because it has broad and complex impacts on the global climate system. Most immediately, the ocean is connected to the atmosphere—the two systems work together to move heat and freshwater across latitudes to maintain a balanced climate. This is known as ocean-atmospheric coupling. Climate scientists are actively researching how changes in ocean and atmospheric heat content impact circulation patterns, in particular how changes in circulation affect the weather patterns that steer storms. For example, one recent analysis found that ocean warming might cause atmospheric precipitation bands to shift toward the poles, causing an increase in the intensity and frequency of extreme precipitation events at middle and high latitudes as well as a reduction in the same near the equator. Already, we are starting to experience patterns consistent with this kind of analysis.
Recent observational data has indicated a slowing in the rate of ocean surface warming relative to other climate variables, which scientists have pinned to cool-surface La Niña episodes in the equatorial Pacific. However, it is important to remember that different regions of the ocean heat up differently, and global observational data often underreports changes in regions that are difficult to measure (such as around the poles or in the deep oceans). The deep oceans in particular are responsible for absorbing much of the excess heat. Deep ocean circulation patterns carry sun-warmed tropical waters into the higher latitudes where they sink and flow back towards the Equator, acting as a kind of buffer to climate change by slowing the rate of surface warming. In addition, research shows that three major ocean basins—the Equatorial Pacific, North Atlantic, and Southern Ocean—are important areas of ocean heat uptake and that observational data often fails to capture the full extent of actual warming in these regions. Despite the limitations associated with measuring changes in ocean heat content, however, we are still seeing record-breaking heat in the oceans.
Warmer World Linked To More Extreme Weather
Unusual jet stream patterns, linked to warming in the Arctic and warmer sea surface temperatures in the Pacific, drove extreme drought in the western U.S. and chills in the East.
Temperatures in the U.S. throughout 2014 were exceptional, marked by simultaneous record heat in the West and cooler than average temperatures in the East. While it may seem strange for global warming to sometimes be accompanied by colder winters, recent studies hold that warming in the Arctic and in the western Pacific Ocean has led to changes in the jet stream, which can result in volatile weather patterns and unusually persistent periods of extreme weather in the mid-northern latitudes. The avenues through which warming influences the jet stream represent a new and still emerging facet of climate science.
Throughout 2013 and 2014, the jet stream frequently dipped from the Arctic to the south, creating a persistent dipole—or two opposed atmospheric pressure systems—with the Western U.S. receiving warm, high-pressure air from the Pacific, and the Eastern U.S. receiving Arctic air carried by the sunken jet stream.
Arguably the most severe outgrowth of this recent trend in the U.S. has been the historic 2012-2014 California drought (which forecasters predict will continue into 2015). The state began 2014 with its lowest Sierra snowpack recording—12 percent—in more than 50 years of record keeping. In August, California set a new U.S. Drought Monitor record with 58.4 percent of the state in the worst drought category, known as “exceptional drought.” The dry conditions along the West Coast also fueled a severe wildfire season. On August 2, California Governor Jerry Brown declared a state of emergency due to the ongoing drought, fires and deteriorating air quality throughout the state. Meanwhile, Oregon and Washington topped the nation in total number of acres burned, with Washington experiencing its largest wildfire ever recorded.
The horizontal line marks the precipitation level of the 2000 – 2004 drought, the worst of the past 800 years up to 2012. Droughts of this intensity are predicted to be the new normal by 2030, and will be considered an outlier of extreme wetness by 2100
By contrast, the Central and Eastern U.S. experienced unusually persistent cold temperatures throughout 2014. The winter of 2013-2014 was among the coldest on record for the Great Lakes, and Minnesota, Wisconsin, Michigan, Illinois, and Indiana each had winter temperatures that ranked among the ten coldest on record. Ice coverage over the Great Lakes peaked at 92.2 percent on March 6, the second highest measurement on record. The summer was also cooler than average for the region, which led into an unseasonably frigid fall.
Several U.S. locations experienced their coldest Novembers on record due to a procession of cold fronts tapping air from the Arctic. At the start, the Arctic outbreak was largely the product of the extra-tropical remnant of Typhoon Nuri from the Pacific. The system was the most powerful storm to ever move over the Bering Sea, gaining strength from warmer than average ocean and atmospheric conditions. Due to its strength, the storm caused the jet stream to sink southward bringing Arctic conditions to the United States. As a result, North America snow cover reached a record extent for mid-November—15.35 million square kilometers—crushing the old record from 1985 by over two million square kilometers. On November 16, temperatures were warmer in Alaska (significantly in some cases) than in many Central and Eastern U.S. states. Arctic temperatures ran up to 40 degrees above average (with Fairbanks, Alaska blowing away old temperature records by almost two degrees), while the Central and Eastern U.S. experienced record snowfall and temperatures up to 40 degrees below average.
The weather forecast across the United States from November 16 through November 20
Taken together, 2014 has witnessed a record-setting split in the U.S. between regions of simultaneous hot and cold temperatures. According to Scott Robeson, a climate scientist at Indiana University Bloomington, these hot and cold extremes are important. Robeson recently authored a studyon warm and cold anomalies in the northern hemisphere and found, “Average temperatures don’t tell us everything we need to know about climate change. Arguably, these cold extremes and warm extremes are the most important factors for human society.” Robeson notes that temperatures in the Northern Hemisphere are considerably more volatile than in the South, where there is less land mass to add complexity to weather systems. The extreme weather observed in 2014 in the U.S. has many layers of complexity, with ocean and Arctic temperatures influencing circulation patterns, and agrowingbodyofscientificevidence suggests global warming may be the common denominator.
Internationally, 2014 saw record heat and drought in some countries, but cold spells and flooding in others. As in the U.S., many of these trends are associated with unusual ocean-atmospheric circulation patterns with likely connections to climate change.
Perturbations in the jet stream have wide ranging climate impacts that vary depending on geographical region. One recent analysis finds a connection between a wavy jet stream pattern—with greater dips from north to south—and increases in the probabilities of heat waves in western North America and central Asia; cold outbreaks in eastern North America; droughts in central North America, Europe and central Asia; and wet spells in western Asia.
Just as most of the weather in the western U.S. is below the jet stream and connected to the Pacific, most of the weather in Europe rides in under the jet stream from the Atlantic. While the jet stream has been unusually far north in the Pacific, bringing high temperatures and drought to the western U.S., the jet stream has been unusually far south across the Atlantic. As a result, the UK was hit by an exceptional run of winter storms and an intense polar vortex at the start of 2014, with rainfall amounts, storm intensities, wave heights, and other extreme weather trends at or near record levels. Related damages from December 23, 2013 – March 1, 2014 added up to $1.5 billion. Global warming has doubled the risk of extreme conditions, as warmer temperatures and melting ice in the Arctic cause the jet stream to push cold air southwards.
In January and February, an exceptional dry spell hit Southeast Asia, with the worst impacts—including water shortages, wildfires, crop failure, and increased incidence of infectious disease—felt in Singapore, Malaysia, Indonesia, and Thailand. Singapore suffered its longest dry spell on record between January 13 and February 8, which caused extensive damage to rice crops and fish stocks at several offshore farms. Dengue hotspots in Malaysia experienced a four-fold increase in infections to about 14,000 compared with the same period last year.
Continuous, heavy rainfall in May resulted in some of the worst flooding ever recorded in Southeast Europe, mainly Serbia, Bosnia and Herzegovina (BiH), and Croatia. Three months’ worth of rain fell in only three days, making it the heaviest rainfall in BiH since records began in 1894. On May 15, the Serbian Government declared a state of emergency for its entire territory. The storm caused $4.5 billion in damage.
May also saw the Eastern Pacific’s strongest May hurricane on record, Hurricane Amanda, which peaked as a top-end Category 4 hurricane with 155 mph winds. The impressive hurricane was linked to record sea surface temperatures, which measured 0.59°C above the 20th century average of 16.3°C, the highest temperature anomaly on record for May. In July in the Western Pacific, Typhoon Rammasun became the strongest typhoon to hit China’s Hainan Province in 21 years, surprising forecasters as it gained more strength than anticipated. Like Amanda, wind speeds topped out around 155 mph. The typhoon remained very strong as it made landfall, leading to extreme rainfall and flooding in China that caused $7.2 billion in damage. Global warming is expected to increase the rainfall from tropical cyclones.
In Australia, 2014 was the third hottest year on record (with 2013 being the hottest) and was characterized by frequent periods of abnormally warm weather that contributed to huge bushfires in Victoria and South Australia. According to Dr. Karl Braganza, manager of the Bureau of Meteorology’s climate monitoring section, Australia is seeing “reoccurring heat waves, long durations of heat but very little cold weather.” A report by Australia’s Climate Council finds that the frequency and severity of bushfires is getting worse in the southern state of New South Wales each year due to “record-breaking heat and hotter weather over the long term.”
Following the wettest January to August on record, the UK experienced its driest September since records began in 1910, receiving 19.4mm of rain, or 20 percent of the expected average. Monthly temperatures in the UK were also significantly above average. One recent study finds that human-caused global warming has increased the chances of extremely hot summers in parts of Europe tenfold. The UK Met Office is currently researching how jet stream variations and changes to atmospheric circulation may be increasing the risk of patterns that slow the movement of weather systems, allowing heat waves to develop and intensify.
Understanding the Global Surface Temperature Datasets
Three of the major global temperature datasets that combine both ocean and atmospheric temperatures have declared 2014 the hottest year on record.
The 10 warmest years on record according to the NOAA and NASA datasets.
The four most highly cited combined SST and land temperature datasets are NOAA’s MLOST, NASA’s GISTEMP, the UK’s HadCRUT, and the JMA’s CLIMAT. While HadCRUT has yet to confirm, NOAA, NASA and the JMA—using independent data and analysis—have decalred 2014 the hottest year on record. The Japanese Meteorological Agency (JMA) was one of the first agencies to report 2014’s heat record in a preliminary analysis and found that 2014’s global temperature was 0.63°C above average. NOAA’s data holds that 2014’s temperature was 0.69°C above average, and NASA that it was 0.68°C above average.
Satellites that measure temperatures in the lower atmosphere, or troposphere, did not rank 2014 as a record year, but the troposphere is only one region where excess heat gets stored.
Because satellite datasets measure the atmosphere, and not the climate system as a whole, it is inaccurate to compare satellite temperature averages with combined land and SST averages. Combined land and SST datasets are based on instrumental readings taken on site in the ocean and atmosphere, while satellite records focus on the troposphere and infer temperatures at various levels using measurements of radiance (the intensity of radiation passing through a point in a given direction). Both types of datasets improve our understanding of the rate at which the Earth is warming and how the climate system as a whole distributes heat. But because the two types of datasets vary in terms of their scope, it is perfectly possible for the atmospheric temperature average, as measured by satellites, not to set a new record, while the global combined land and SST average does.
This was the case in 2014. The two most widely cited satellite records are the University of Alabama in Huntsville (UAH) and the privately owned Remote Sensing Systems (RSS) datasets. According to the RSS data, 2014’s annual average temperature in the lower troposphere was the sixth warmest on record, or 0.26°C above the long-term average. The UAH data has not yet been confirmed, but will likely reaffirm the RSS finding. This is to be expected, however, in a year where record ocean heat was the dominant driver of observed warming.
Temperature analyses provide an important health gauge for the planet.
The instrumental temperature record—based on readings from ships and buoys that measure sea-surface temperature (SST) as well as land-based weather stations—has provided vital information about the Earth’s climate over the last century and beyond. To reconstruct global temperatures, each agency divides the Earth’s surface into latitude-longitude grid boxes that are used to integrate in situ (“on site”) temperature measurements from around the globe.
The three most highly cited combined SST and land temperature datasets are NOAA’s MLOST, NASA’s GISTEMP, and the UK’s HadCRUT. All three datasets report global average temperature as an anomaly, or departure from average, relative to a reference period. This is because absolute temperatures can vary (depending on factors like elevation), whereas anomalies allow for more meaningful comparisons between locations and accurate calculations of temperature trends. HadCRUT uses the most recent reference period to calculate anomalies, 1961-1990, followed by GISTEMP’s 1951-1980 period. MLOST, on the other hand, uses the 20th century, 1901-2000, as its reference period to establish a longer-term average.
Global Land and Ocean Temperature Anomalies, January-December
While the concept of these datasets is fairly simple, their construction is challenging due to difficulties in obtaining data; documenting and accounting for changes in instrumentation and observing practices; addressing changes in station location and local land use; understanding random measurement errors; and deciding where and how to fill in missing data in space and time. Each group has approached the above challenges somewhat differently. The final datasets differ in their spatial coverage, spatial resolution, starting year, and degree of interpolation (a method of constructing missing data points based on surrounding, discrete points). For this reason, NOAA, NASA, and UK Met Office global temperature anomalies vary subtly.
Global temperature data often underestimates the amount of warming due to coverage bias.
Analyzing temperature observations at a global scale often comes at the cost of not including important spatial detail. This challenge—known as coverage bias—is something all three of the major global temperature datasets struggle with and attempt to reconcile.
NOAA’s Merged Land-Ocean Surface Temperature Analysis (MLOST) uses land surface air temperatures taken from the Global Historical Climatology Network (GHCN) dataset and ocean temperatures from the Extended Reconstructed Sea Surface Temperature (ERSST) dataset, and combines these into a comprehensive global surface temperature dataset. The comprehensive dataset spans from 1880 to the present at monthly resolution on a 5×5 degree latitude-longitude grid. MLOST uses interpolation, but areas without enough data—mainly at the poles, over Africa, and at the center of the Atlantic and Pacific Oceans—are masked in the data analysis to prevent any overreliance on reconstructions that are based on too little data.
NASA Goddard’s Global Surface Temperature Analysis (GISTEMP) also uses GHCN data from 1880 to the present, but GISTEMP has some important differences from NOAA’s MLOST. While GISTEMP has a more focused spatial resolution, with a 2×2 grid, and better coverage at the poles due to the inclusion of data from Antarctic “READER” stations, it only provides data in terms of temperature anomalies. All three of the major global datasets report global temperatures as anomalies to make comparison and computation easier, but GISTEMP is unique in that it works solely with anomaly data from the outset. NOAA and HadCRUT have absolute temperature data from which they derive regional anomalies. As for HadCRUT, it is unique in that it incorporates many additional sources beyond GHCN and is the only global analysis that does not use interpolation. It also has more spatial coverage gaps than MLOST and GISTEMP and a tendency to significantly underreport warming, primarily due to a lack of temperature data at the Arctic, which is warming much fasterthan other regions.
Chuvas devem continuar abaixo da média em 2015, diz Cemaden (G1)
Ano deve ser influenciado por eventos extremos de 2014, diz especialista
Se o ano passado foi um período de condições climáticas extremas no Brasil, entre elas a seca em diversas regiões, a situação em 2015 pode piorar. Esta é a avaliação feita pelo Centro Nacional de Monitoramento e Alertas de Desastres Naturais (Cemaden) em Cachoeira Paulista (SP), que já prevê chuvas abaixo da média novamente.
De acordo com o meteorologista do Cemaden, Marcelo Seluchi, neste verão choveu pouco mais da metade do normal para o período. O órgão é uma das extensões do Instituto Nacional de Pesquisas Espaciais (Inpe) para estudos e alertas de desastres naturais. “Comparado com o ano passado, a situação de 2015 pode piorar nas metrópoles em várias regiões do Brasil e no Vale do Paraíba”, afirma.
Cantareira pode secar em julho, prevê centro de monitoramento (O Globo)
Governador Alckmin diz que foi mal interpretado ao falar sobre racionamento
O Sistema Cantareira, responsável por abastecer 6,5 milhões de pessoas na Grande São Paulo, pode secar em julho, caso o consumo de água na Região Metropolitana continue o mesmo e a chuva mantenha o ritmo observado nos últimos meses. A projeção foi feita pelo Centro Nacional de Monitoramento e Alertas de Desastres Naturais (Cemaden), ligado ao Ministério da Ciência e Tecnologia.
Combinação de seca e calor extremo agrava crise do Cantareira (Estadão)
Dados oficiais mostram que nos primeiros 15 dias do ano o sistema recebeu 35% menos água do que a média de janeiro passado, enquanto as temperaturas máximas na capital batem recordes
Apontada pelo governo Geraldo Alckmin (PSDB) como a causa da crise hídrica paulista no início de 2014, a combinação de seca severa nos mananciais e calor extremo na capital está ainda mais crítica em 2015. Dados oficiais mostram que nos primeiros 15 dias do ano o Sistema Cantareira recebeu 35% menos água do que a média de janeiro passado, enquanto as temperaturas máximas na cidade estão batendo o recorde registrado no mesmo período do ano anterior.
Novo estudo indica que nível do mar subiu apenas 1,2 mm entre 1900 e 1990; avaliações antigas diziam que elevação foi de 1,8mm
Do início do século 20 até a década passada, o nível dos oceanos subiu em ritmo 30% maior do que se imaginava, de acordo com um estudo realizado por pesquisadores da Universidade de Harvard (Estados Unidos).
Summary: A multi-purpose bone tool dating from the Neanderthal era has been discovered by researchers, throwing into question our current understanding of the evolution of human behavior. It was found at an archaeological site in France.
The tool in question was uncovered in June 2014 during the annual digs at the Grotte du Bison at Arcy-sur-Cure in Burgundy, France. Extremely well preserved, the tool comes from the left femur of an adult reindeer and its age is estimated between 55,000 and 60,000 years ago. Marks observed on it allow us to trace its history. Obtaining bones for the manufacture of tools was not the primary motivation for Neanderthals hunting — above all, they hunted to obtain the rich energy provided by meat and marrow. Evidence of meat butchering and bone fracturing to extract marrow are evident on the tool. Percussion marks suggest the use of the bone fragment for carved sharpening the cutting edges of stone tools. Finally, chipping and a significant polish show the use of the bone as a scraper. Credit: University of Montreal – Luc Doyon
A multi-purpose bone tool dating from the Neanderthal era has been discovered by University of Montreal researchers, throwing into question our current understanding of the evolution of human behaviour. It was found at an archaeological site in France. “This is the first time a multi-purpose bone tool from this period has been discovered. It proves that Neanderthals were able to understand the mechanical properties of bone and knew how to use it to make tools, abilities usually attributed to our species, Homo sapiens,” said Luc Doyon of the university’s Department of Anthropology, who participated in the digs. Neanderthals lived in Europe and western Asia in the Middle Paleolithic between around 250,000 to 28,000 years ago. Homo sapiens is the scientific term for modern man.
The production of bone tools by Neanderthals is open to debate. For much of the twentieth century, prehistoric experts were reluctant to recognize the ability of this species to incorporate materials like bone into their technological know-how and likewise their ability to master the techniques needed to work bone. However, over the past two decades, many clues indicate the use of hard materials from animals by Neanderthals. “Our discovery is an additional indicator of bone work by Neanderthals and helps put into question the linear view of the evolution of human behaviour,” Doyon said.
The tool in question was uncovered in June 2014 during the annual digs at the Grotte du Bison at Arcy-sur-Cure in Burgundy, France. Extremely well preserved, the tool comes from the left femur of an adult reindeer and its age is estimated between 55,000 and 60,000 years ago. Marks observed on it allow us to trace its history. Obtaining bones for the manufacture of tools was not the primary motivation for Neanderthals hunting — above all, they hunted to obtain the rich energy provided by meat and marrow. Evidence of meat butchering and bone fracturing to extract marrow are evident on the tool. Percussion marks suggest the use of the bone fragment for carved sharpening the cutting edges of stone tools. Finally, chipping and a significant polish show the use of the bone as a scraper.
“The presence of this tool at a context where stone tools are abundant suggests an opportunistic choice of the bone fragment and its intentional modification into a tool by Neanderthals,” Doyon said. “It was long thought that before Homo sapiens, other species did not have the cognitive ability to produce this type of artefact. This discovery reduces the presumed gap between the two species and prevents us from saying that one was technically superior to the other.”
Luc Doyon, Geneviève Pothier Bouchard, and Maurice Hardy published the article “Un outil en os à usages multiples dans un contexte moustérien,” on December 15, 2014 in the Bulletin de la Société préhistorique française. Luc Doyon and Geneviève Potheir Bouchard are affiliated with the Department of Anthropology of the Université de Montréal. Maurice Hardy, who led the archaeological digs at the Grotte du Bison, is affiliated with Université Paris X — Nanterre.
Source: University of Illinois at Urbana-Champaign
Summary: A new study suggests that dogs may have first successfully migrated to the Americas only about 10,000 years ago, thousands of years after the first human migrants crossed a land bridge from Siberia to North America.
New evidence suggests dogs arrived in the Americas only about 10,000 years ago. Some believe the ancient dogs looked a lot like present-day dingos. Credit: Angus McNab
A new study suggests that dogs may have first successfully migrated to the Americas only about 10,000 years ago, thousands of years after the first human migrants crossed a land bridge from Siberia to North America.
The study looked at the genetic characteristics of 84 individual dogs from more than a dozen sites in North and South America, and is the largest analysis so far of ancient dogs in the Americas. The findings appear in the Journal of Human Evolution.
Unlike their wild wolf predecessors, ancient dogs learned to tolerate human company and generally benefited from the association: They gained access to new food sources, enjoyed the safety of human encampments and, eventually, traveled the world with their two-legged masters. Dogs also were pressed into service as beasts of burden, and sometimes were served as food, particularly on special occasions.
Their 11,000- to 16,000-year association with humans makes dogs a promising subject for the study of ancient human behavior, including migratory behavior, said University of Illinois graduate student Kelsey Witt, who led the new analysis with anthropology professor Ripan Malhi.
“Dogs are one of the earliest organisms to have migrated with humans to every continent, and I think that says a lot about the relationship dogs have had with humans,” Witt said. “They can be a powerful tool when you’re looking at how human populations have moved around over time.”
Human remains are not always available for study “because living populations who are very connected to their ancestors in some cases may be opposed to the destructive nature of genetic analysis,” Witt said. Analysis of ancient dog remains is often permitted when analysis of human remains is not, she said.
Previous studies of ancient dogs in the Americas focused on the dogs’ mitochondrial DNA, which is easier to obtain from ancient remains than nuclear DNA and, unlike nuclear DNA, is inherited only from the mother. This means mitochondrial DNA offers researchers “an unbroken line of inheritance back to the past,” Witt said.
The new study also focused on mitochondrial DNA, but included a much larger sample of dogs than had been analyzed before.
Molecular anthropologist Brian Kemp of Washington State University provided new DNA samples from ancient dog remains found in Colorado and British Columbia, and the Illinois State Archaeological Survey (ISAS) provided 35 samples from a site in southern Illinois known as Janey B. Goode, near present-day St. Louis. The Janey B. Goode site is located near the ancient city Cahokia, the largest and first known metropolitan area in North America. Occupation of the Janey B. Goode site occurred between 1,400 and 1,000 years ago, the researchers said, while Cahokia was active from about 1,000 to 700 years ago.
Dozens of dogs were ceremonially buried at Janey B. Goode, suggesting that people there had a special reverence for dogs. While most of the dogs were buried individually, some were placed back-to-back in pairs.
In Cahokia, dog remains, sometimes burned, are occasionally found with food debris, suggesting that dogs were present and sometimes were consumed. Dog burials during this time period are uncommon.
As previous studies had done, the Illinois team analyzed genetic signals of diversity and relatedness in a special region (the hypervariable region) of the mitochondrial genome of ancient dogs from the Americas. University of Iowa anthropology professor Andrew Kitchen contributed significantly to this analysis.
The researchers found four never-before-seen genetic signatures in the new samples, suggesting greater ancient dog diversity in the Americas than previously thought. They also found unusually low genetic diversity in some dog populations, suggesting that humans in those regions may have engaged in dog breeding.
In some samples, the team found significant genetic similarities with American wolves, indicating that some of the dogs interbred with or were domesticated anew from American wolves.
But the most surprising finding had to do with the dogs’ arrival in the Americas, Witt said.
“Dog genetic diversity in the Americas may date back to only about 10,000 years ago,” she said.
“This also is about the same time as the oldest dog burial found in the Americas,” Malhi said. “This may not be a coincidence.”
The current study, of only a small part of the mitochondrial genome, likely provides an incomplete picture of ancient dog diversity in the Americas, Malhi said.
“The region of the mitochondrial genome sequenced may mask the true genetic diversity of indigenous dogs in the Americas, resulting in the younger date for dogs when compared with humans,” he said.
More studies of ancient dogs are in the works, the researchers said. Witt has already sequenced the full mitochondrial genomes of 20 ancient dogs, and more are planned to test this possibility, the researchers said.
Journal Reference:
Kelsey E. Witt, Kathleen Judd, Andrew Kitchen, Colin Grier, Timothy A. Kohler, Scott G. Ortman, Brian M. Kemp, Ripan S. Malhi. DNA analysis of ancient dogs of the Americas: Identifying possible founding haplotypes and reconstructing population histories. Journal of Human Evolution, 2014; DOI: 10.1016/j.jhevol.2014.10.012
Artigo de José Monserrat Filho* comenta editorial publicado na revista Nature
“Olhem para as estrelas e aprendam com elas.”
Albert Einstein
Se os governos desejam que as ciências exatas e naturais levem mais benefícios à sociedade, eles precisam se comprometer mais com as ciências sociais e humanas. Há que integrar todas essas áreas para que as ciências exatas e naturais ofereçam soluções ainda mais abrangentes e completas. Essa, em suma, é a visão defendida pela Nature, renomada revista científica inglesa, em seu editorial “Tempo para as Ciências Sociais“, de 30 de dezembro de 2014.
Para a Nature, “a física, a química, a biologia e as ciências ambientais podem oferecer soluções maravilhosas a alguns dos desafios que as pessoas e as sociedades enfrentam, mas para que ganhem força, tais soluções dependem de fatores que vão além do conhecimento de seus descobridores“. A publicação argumenta que “se fatores sociais, econômicos e culturais não são incluídos na formulação das questões, grande dose de criatividade pode ser desperdiçada“.
Quer dizer, quando não se presta a devida atenção às ciências sociais, corre-se o risco de perder em criatividade (campos e elementos que alimentam a imaginação, a busca de melhores e mais amplas soluções), o que nas atividades cientificas é grave insuficiência.
A Nature pede total apoio “a quem cria projetos multidisciplinares – por exemplo, para aumentar o acesso aos alimentos e à água, fazer adaptações às mudanças climáticas, ou tratar de doenças – integrando, desde o início, as ciências naturais e as ciências sociais e humanas”.
Total apoio também é solicitado “às figuras de proa na política que demonstram seu compromisso com esta agenda multidimensional” e expressam “toda uma série de preocupações quando os governos não manifestam a mesma compreensão”.
A revista elogia Mark Walport, o principal assessor científico do governo inglês, e seu antecessor, John Beddington, por estarem comprometidos com relação as ciências sociais. O relatório do Reino Unido de 2014, sob o título de “Inovação: gestão de risco sem evitá-lo”, reúne opiniões e reflexões de especialistas em psicologia, ciência do comportamento, estatística, estudos de risco, sociologia, direito, comunicação e política pública, bem como em ciências naturais.
O documento inclui temas como incerteza, comunicação, conversações e linguagem, com cientistas reconhecidos tecendo considerações cruciais sobre inovação em áreas controversas e cheias de dúvidas. Cientistas e juristas trabalham juntos, por exemplo, nos estudos de caso sobre submarinos nucleares e sobre previsões de inundação e infiltrações.
O principal recado do relatório vale para os responsáveis pela formulação de políticas de C&T em qualquer país: Se você deseja que a ciência leve benefícios à sociedade, por meio do comércio, do governo ou da filantropia, você precisa apoiar os meios de capacitação para se entender a sociedade, o que é tão profundo quanto a capacidade de entender a ciência. E quando fizer declarações políticas precisa deixar claro que você acredita nessa necessidade.
Será que tudo isso é válido também para a ciência e a tecnologia espaciais?
As atividades espaciais, embora efetuadas com base em conhecimentos científicos e tecnológicos, envolvem interesses sociais, econômicos, políticos, jurídicos e culturais de enorme relevância. O mundo inteiro depende hoje do espaço em sua vida cotidiana. Isso gera um caudal de problemas em todas as áreas. Política e Direito Espaciais são campos estratégicos da política internacional. As ações militares no solo, nos mares e no espaço aéreo são todas comandadas através do espaço, e já se planeja até instalar armas em órbitas da Terra, o que poderá convertê-las em teatro de guerra. Enquanto isso, as Nações Unidas avançam na elaboração das diretrizes para garantir a “Sustentabilidade a Longo Prazo das Atividades Espaciais”, que também enfrentam o perigo crescente do lixo espacial. Em debate, igualmente, está o desafio de criar um sistema global de gestão do tráfico espacial para garantir maior segurança e proteção de todos os voos e objetos espaciais. Mais que nunca é essencial o maior conhecimento possível de tudo o que se passa e se faz no espaço, perto e longe da Terra. Medidas de transparência e fomento à confiança no espaço são propostas pela Assembleia Geral das Nações Unidas. E quem senão as ciências sociais para refletir sobre o futuro da civilização humana no espaço?
* Vice-Presidente da Associação Brasileira de Direito Aeronáutico e Espacial (SBDA), Diretor Honorário do Instituto Internacional de Direito Espacial, Membro Pleno da Academia Internacional de Astronáutica e Chefe da Assessoria de Cooperação Internacional da Agência Espacial Brasileira (AEB).


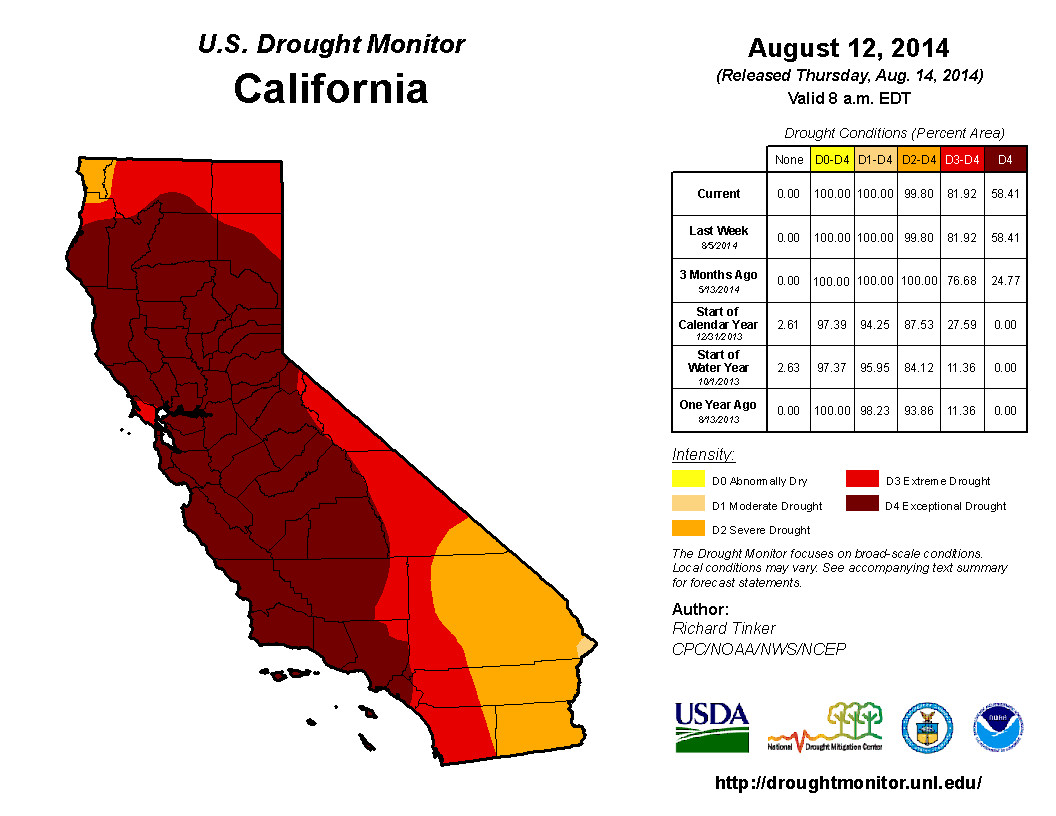
Você precisa fazer login para comentar.