14 February 2022 16:00
Lifting hundreds of millions of people out of “extreme poverty” – where they live on less than US$1.90 per day – would drive a global increase in emissions of less than 1%, according to new research.
The study, published in Nature Sustainability, highlights the global inequality in emissions between people in rich and poor countries. For example, it finds that the average carbon footprint of a person living in sub-Saharan Africa is 0.6 tonnes of carbon dioxide (tCO2). Meanwhile, the average US citizen produces 14.5tCO2 per year.
The authors find that the average carbon footprint in the top 1% of emitters was more than 75-times higher than that in the bottom 50%.
“The inequality is just insane,” the lead author of the study tells Carbon Brief. “If we want to reduce our carbon emissions, we really need to do something about the consumption patterns of the super-rich.”
A scientist not involved in the research says that “we often hear that actions taken in Europe or the US are meaningless when compared to the industrial emissions of China, or the effects of rapid population growth in Africa. This paper exposes these claims as wilfully ignorant, at best”.
Emissions inequality
Humans release tens of billions of tonnes of CO2 into the atmosphere every year. However, the distribution of these emissions is unequal – as they are disproportionately produced by people in wealthier countries who typically live more carbon-intensive lifestyles.
The new study uses what it calls “outstandingly detailed” global expenditure data from the World Bank Consumption Dataset from 2014 to assess the carbon footprints of people in different countries, and with different consumption levels.
Dr Klaus Hubacek is a professor of science, technology and society at the University of Groningen and an author on the study. He tells Carbon Brief what is included in consumption figures:
“Driving the model with the consumption patterns calculates the carbon emissions not only directly through expenditure for heating and cooling, but the embodied carbon emissions in the products they buy. So it’s taking account of the entire global supply chains to calculate those carbon emissions.”
Dr Yuli Shan – a faculty research fellow in climate change economics at the University of Groningen – is also an author on the study. He explains that using consumption data ensures that carbon emissions are linked to the countries that use goods and services, rather than the countries that produce them. This is important, because “poor countries emit large quantities of CO2 due to the behaviour of people in developed countries”, he adds.
The map below shows the average carbon footprints of residents of the 116 countries included in the study. The shading indicates the size of the carbon footprint, for low (blue) to high (red). Note the exponential scale on the colour bar.
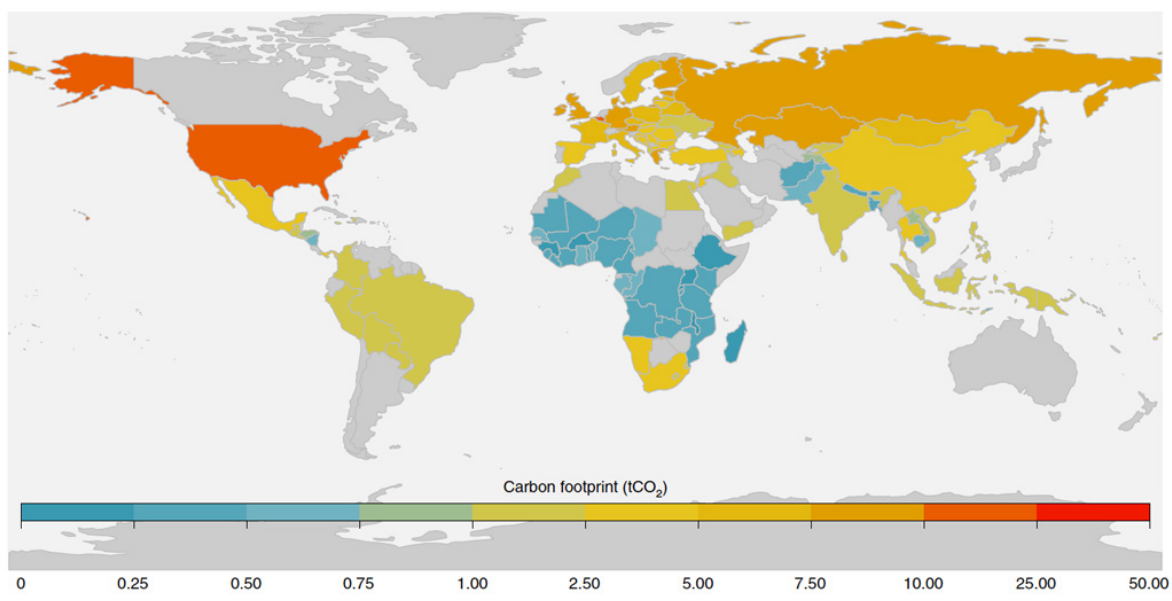
The authors find that Luxembourg has the highest average national per capita carbon footprint in the study, at 30tCO2 per person, followed by the US with 14.5tCO2. It is worth noting that a number of countries with high per-capita emissions are not included in the study, such as Australia, Canada, Japan, Saudi Arabia and Iran, as these are not included in the dataset.
In contrast, Madagascar, Malawi, Burkina Faso, Uganda, Ethiopia and Rwanda all have average carbon footprints of less than 0.2tCO2.
Dr Shoibal Chakravarty is a visiting professor at the Divecha Centre for Climate Change and was also not involved in the research. He tells Carbon Brief that the study “significantly improves on previous attempts” to measure per-capita emissions, and is “more rigorous that past efforts”.
The rich and the ‘super-rich’
Within each country, the authors also split the population into groups based on how much they spend, on average. Benedikt Bruckner – the lead author on the study, also from the University of Groningen – tells Carbon Brief that while previous studies typically used four or five groups, this study uses more than 200.
The high number of “expenditure bins” allows for “more precise, more detailed [and] more accurate” analysis, Hubacek says.
When including bins, the spread of carbon footprints ranges from less than 0.01 tCO2 for more than a million people in sub-Saharan countries to hundreds of tonnes of CO2 for about 500,000 individuals at the top of the “global expenditure spectrum”, the authors find.
The authors then split the global population into the top 1%, next 9%, next 40% and bottom 50% of emitters. Their share of global emissions (left) and average carbon footprint (right) are shown in red, yellow, light blue and dark blue below, respectively.

The study finds that the average carbon footprint in the top 1% of emitters is more than 75-times higher than that in the bottom 50%.
This gap is “astonishing”, Dr Wiliam Lamb – a researcher at the Mercator Research Institute who was not involved in the study – tells Carbon Brief. He adds that responsibility for global emissions lies with the “super-rich”:
“In the public conversation on climate change, we often hear that actions taken in Europe or the US are meaningless when compared to the industrial emissions of China, or the effects of rapid population growth in Africa. This paper exposes these claims as wilfully ignorant, at best. By far the worst polluters are the super-rich, most of whom live in high income countries.”
Lamb notes that the expenditure of the “super-rich” may be even higher than suggested by this analysis, because “their earnings may be derived from investments, while their expenditures can be shrouded in secrecy.”
Dr Bruckner also highlights this underestimation, noting that while the highest carbon footprints in this study go up to hundreds of tonnes of CO2 per year, past studies into the super-rich have produced carbon footprint estimates of more than 1,000 tonnes per year. “The inequality is just insane,” he tells Carbon Brief. He adds:
“If we want to reduce our carbon emissions, we really need to do something about the consumption patterns of the super-rich.”
Eradicating poverty
In 2015, the United Nations set a series of Sustainable Development Goals – the first of which is to “end poverty in all its forms everywhere”. The goal focuses on eradicating “extreme poverty” – defined as living on less than US$1.90 per day – as well as halving poverty as defined by national poverty lines.
The map below shows the proportion of people in the 119 countries mapped are living in extreme poverty, from a low level (blue) to high (red).
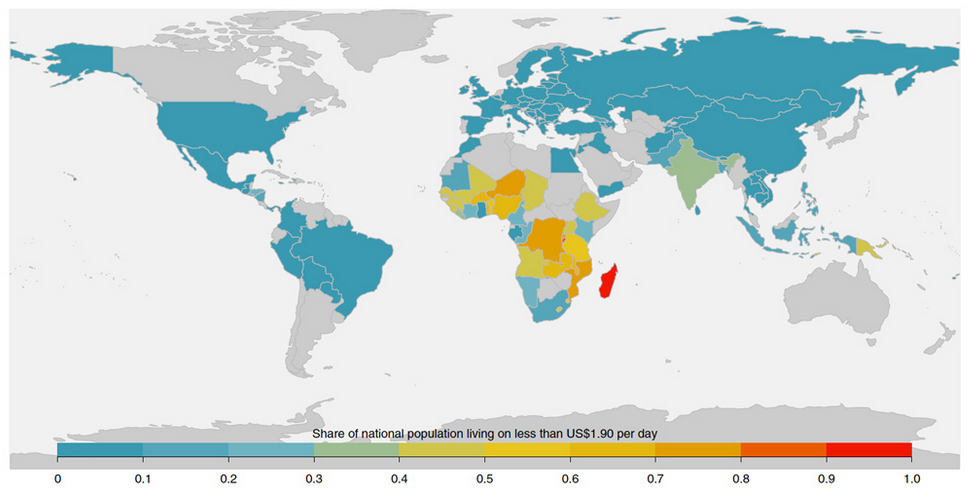
More than a billion people were living below the extreme poverty line of US$1.90 per day in 2014, according to the study. The authors find that “extreme poverty” is mostly concentrated in Africa and south Asia – where per capita CO2 emissions are generally the lowest.
“Carbon inequality is a mirror to extreme income and wealth inequality experienced at a national and global level today,” the study says.
To investigate how poverty alleviation would impact global carbon emissions, the authors devised a range of possible “poverty alleviation and eradication scenarios”.
These scenarios assume no changes in population or energy balance. Instead, they shift people living in poverty into an expenditure group above the poverty line – and assume that their consumption patterns and carbon footprints change accordingly given present-day consumption habits in their country.
The authors find that eradicating “extreme poverty” – by raising everyone above the US$1.90 per day threshold – would drive up global carbon emissions by less than 1%.
Countries in Africa and south Asia would see the greatest increase in emissions, the authors find. For example, they find that emissions in low and lower-middle income countries in sub-Saharan Africa – such as Madagascar – would double if everyone were lifted out of extreme poverty.
Meanwhile, the study finds that lifting 3.6 billion people over the poverty line of US$5.50 per day would drive an 18% increase in global emissions.
The study shows that “eradicating extreme poverty is not a concern for climate mitigation”, says Dr Narasimha Rao – an associate professor of energy systems at the Yale School of Environment, who was not involved in the study.
Warming targets
To meet the targets outlined in the Paris Agreement – of limiting global warming to 1.5C or “well below” 2C above pre-industrial levels – humanity has a limited “carbon budget” left to emit.

The study investigates how the average carbon footprints of different countries line up with the Paris warming targets.
The graphic below shows average carbon footprints in a range of countries and regions, including the US, Middle East, North Africa and Turkey (MENAT) and sub-Saharan Africa. The colour of each column indicates the region’s average expenditure per person, measured using “purchasing power parity” to account for the different costs of living between different countries.

The dotted lines show the target per-capita footprint that the world would need to adopt to limit warming to 2C (top line) and 1.5C (bottom line).
The authors find that according to existing literature, humanity needs to reach an average carbon footprint of 1.6-2.8tCO2 in the coming decade to limit warming to 1.5C or 2C above preindustrial levels.
In this chart, the US exceeds this amount the most dramatically. Meanwhile, individuals in sub-Saharan Africa are well below the global target range – emitting only 0.6tCO2 per year on average.
“From a climate justice perspective, the clear focus of climate policy should be on high emitters,” Lamb tells Carbon Brief. He adds:
“We have a moral imperative to reduce emissions as fast as possible in order to avoid climate impacts where they will land the worst – in the Global South – as well as to ease the burden of the transition on vulnerable populations.”
Dr Shonali Pachauri is a researcher at the International Institute for Applied Systems Analysis, and was not involved in the study. She tells Carbon Brief that this analysis “shin[es] a light on the level of inequality in carbon emissions evident across the world today”. She adds:
“[The analysis] is critical to setting equitable and just targets for climate mitigation, such that those who contribute the most to current emissions mitigate the most in alignment with the UNFCCC’s common but differentiated responsibility and polluter pays principle.”
Bruckner et al (2022), Impacts of poverty alleviation on national and global carbon emissions, Nature Sustainability, doi:10.1038/s41893-021-00842-z


Você precisa fazer login para comentar.